Three-dimensional models of metal-poor stars
Abstract
I present here the main results of recent realistic, 3D, hydrodynamical simulations of convection at the surface of metal-poor red giant stars. I discuss the application of these convection simulations as time-dependent, 3D, hydrodynamical model atmospheres to spectral line formation calculations and abundance analyses. The impact of 3D models on derived elemental abundances is investigated by means of a differential comparison of the line strengths predicted in 3D under the assumption of local thermodynamic equilibrium (LTE) with the results of analogous line formation calculations performed with classical, 1D, hydrostatic model atmospheres. The low surface temperatures encountered in the upper photospheric layers of 3D model atmospheres of very metal-poor stars cause spectral lines of neutral metals and molecules to appear stronger in 3D than in 1D calculations. Hence, 3D elemental abundances derived from such lines are significantly lower than estimated by analyses with 1D models. In particular, differential 3D1D LTE abundances for C, N, and O derived from CH, NH, and OH lines are found to be in the range to dex. Large negative differential 3D1D corrections to the Fe abundance are also computed for weak low-excitation Fe i lines. The application of metal-poor 3D models to the spectroscopic analysis of extremely iron-poor halo stars is discussed.
pacs:
95.30.Lz, 97.10.Ex, 97.10.Tk1 Introduction
The first evidence of the existence of stars characterized by a lower abundance of metals with respect to hydrogen than in the Sun came in the Mid-20th century, in particular with the works of ? and ?. These authors observed that giant and dwarf stars with weaker metal lines in their spectra typically had a larger velocity dispersion than stars with stronger spectral lines; also, high-velocities appeared to be associated only with the weak-line stars. These works suggested that population II stars (as dubbed by ?) differed from population I stars not only by their kinematic properties but also in terms of basic chemical composition, the former being characterized by an overall lower iron abundance. The following year ? produced the first quantitative abundance analysis of population II stars; the authors analysed the two stars HD19445 and HD140283 and derived significantly lower abundances of calcium and iron with respect to hydrogen than in the Sun, which actually allowed to explain the peculiar spectral and photometric properties of these objects.
It soon became clear that metal-poor stars were extremely interesting objects which could provide important clues about the formation and the chemical and dynamical evolution of the Galaxy. Better tools for quantitative spectroscopy of low-metallicity stars were therefore also required, and the first 1D model stellar atmospheres of metal-poor stars started to appear in the late 1960s-early 1970s. Noteworthy are the works by ? and ?; the latter in particular constitutes the first extended grid of theoretical 1D model atmospheres of giant stars with metallicities ranging from solar down to [Fe/H].111[Fe/H], where and are the number densities of Fe and H, respectively, and the subscript symbol refers to the Sun. Since then, 1D model stellar atmospheres have been continuously developed and improved (see, e.g., reviews by ?, ?), especially with regard to input physics and opacities, and are still nowadays the most widely used models in stellar abundance analyses.
Yet, classical 1D model stellar atmospheres are normally constructed under a number of simplifying assumptions, such as plane-parallel geometry or spherical symmetry, hydrostatic equilibrium, and flux constancy. Moreover, 1D modelling of stellar atmospheres inherently relies on rudimentary implementations of convective energy transport, which is usually treated by means of the mixing-length theory (?) or similar alternative formulations (e.g ?), all characterized by a number of tunable but not necessarily physical free parameters. In late-type stars however, the convection zone reaches and appreciably influences the surface layers from which the emergent stellar flux is formed. For instance, high spatial resolution imaging of the solar photosphere immediately reveals a distinctive granulation pattern that reflects the bulk gas motions in the upper part of the convective zone near the optical surface. Given the dynamic and multi-dimensional character of convection, the use of time-independent, hydrostatic, 1D, model atmospheres in abundance analyses of late-type stars is arguably a potential source of severe systematic errors. In addition, the strengths and exact shapes of spectral lines cannot possibly be predicted in 1D without resorting to ad hoc fudge parameters such as micro- and macro-turbulence, which are supposed to account for non-thermal Doppler broadening due to bulk flows in the stellar atmosphere. During the past thirty years, on the other hand, various computer codes have been developed to perform time-dependent, 3D, hydrodynamical simulations of convection at the surface of late-type stars (e.g. ?, ?, ?, ?, ?, ?, ?, ?). Such stellar surface convection simulations can naturally be used as time sequences of 3D model stellar atmospheres to study in a self-consistent way the impact of photospheric inhomogeneities and correlated velocity fields on the formation of spectral lines and on spectroscopic abundance analyses. In fact, 3D simulations have been shown successful in reproducing several observational constraints such as the morphology of the granulation pattern in the Sun as well as detailed shapes of spectral lines in other solar-like stars. Recent analyses based on 3D simulations of convection at the surface of the Sun, dwarfs, subgiants, and giants (e.g. ?, ?, ?, ?, ?) indicate that the structural differences between 3D hydrodynamical and 1D hydrostatic model atmospheres can significantly impact the predicted strengths of spectral lines and, in turn, lead to large differences in the derived elemental abundances, especially at low metallicities. In the following, I will illustrate the main results of recent 3D simulations of convection at the surface of metal-poor red giants (?, ?) and discuss some applications of these models to spectral line formation and abundance analysis.
2 The 3D convection simulations
The 3D, time-dependent, compressible, explicit, radiative-hydrodynamical code by (?) has been used here to simulate convection at the surface of red giant stars with varying effective temperatures ( to K), surface gravity (cgs), and metallicity ranging from solar down to [Fe/H]. The equations of mass, momentum, and energy conservation are solved on a discrete Cartesian mesh at moderate numerical resolution () for a representative volume of stellar surface large enough to cover about ten granules horizontally and eleven pressure scale heights vertically. In terms of optical depth in the continuum at Å, the simulations extend from to . The upper and lower boundaries are open, while periodical boundary conditions are assumed horizontally. The simulations make use of realistic input physics: the equation of state comes from ?, continuous opacities from the Uppsala opacity package (updated version of ?), line opacities from ? and ?. The solar chemical composition by ? is adopted with the abundances of all metals scaled proportionally to the [Fe/H] value assumed for the simulation. The radiative heating term in the energy conservation equation is computed by solving the radiative transfer equation at each time-step for all grid-points at the surface and along eight inclined rays plus the vertical. To reduce the computational time, opacities are re-grouped in four opacity bins (?). Also, local thermodynamic equilibrium (LTE) is assumed, with a Planckian source function and scattering treated as true absorption.
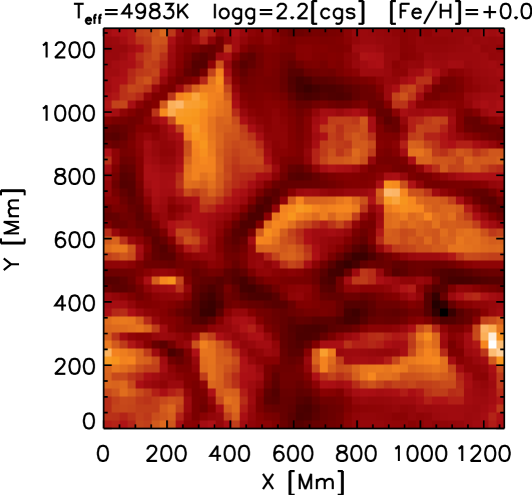
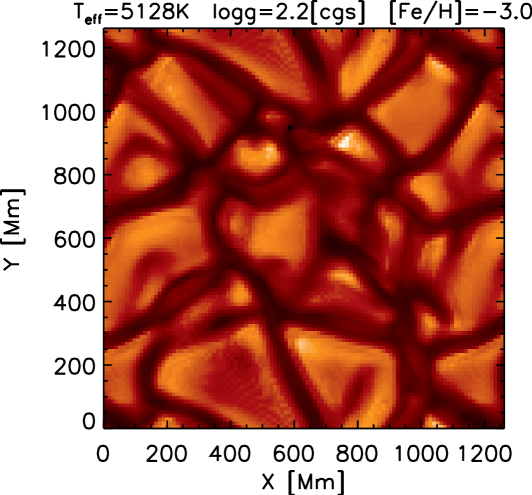
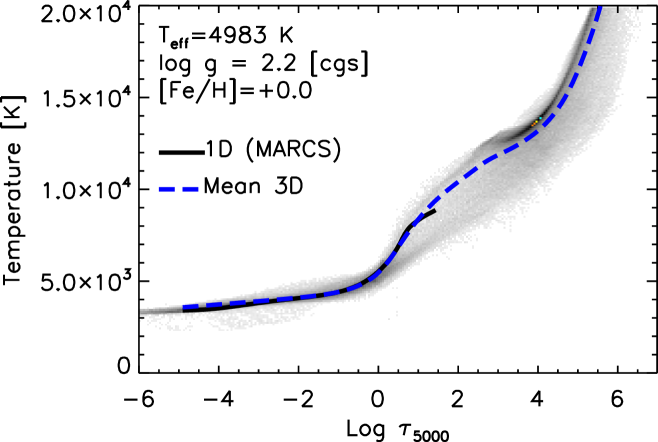
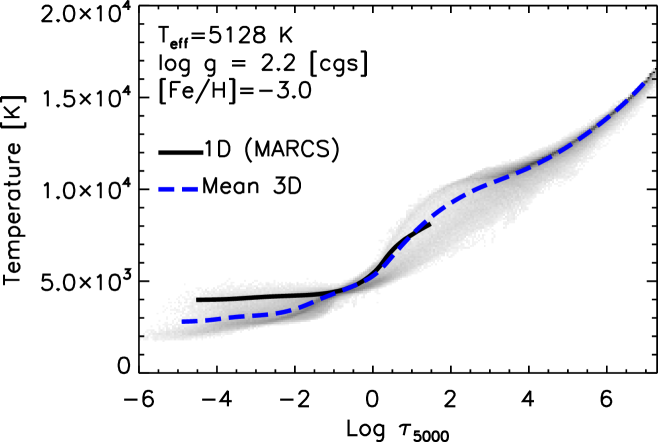
The temperature and density structures at the surface of red giant convection simulations are qualitatively fairly similar to the the ones previously described in the works by (?) and (?) on dwarfs and turnoff stars. Warm plasma rises from the stellar interior and rapidly cools as it approaches the optical surface; there it eventually becomes denser than the surrounding gas, turns over, and plunges back towards the interior. The bulk flows at the surface self-organize into a dynamical granulation pattern characterized by large, warm upflows separated by a network of cool, narrow downdrafts. Figure 1 shows the spatially resolved outgoing intensity in the continuum opacity bin for two red giant simulation snapshots with similar effective temperatures, at solar and very low ([Fe/H]) metallicity. The properties of the emergent granulation patterns are slightly different in the two cases: at solar metallicity, the granules are typically larger and the overall intensity contrast is lower than at [Fe/H]. More remarkable however is the metallicity dependence of the temperature stratification in the 3D simulations; figure 2 illustrates, as a function of optical depth, the predicted temperature structures from the two giant simulations at [Fe/H] and [Fe/H]. The resulting thermal structures are compared with the 1D stratifications from marcs model atmospheres (?, ?) generated for the same stellar parameters, and with the same opacity data and chemical compositions as the 3D simulations. At solar metallicity, the mean temperature structure in the upper photosphere of the 3D simulation appears very similar to the stratification from the corresponding 1D model where radiative equilibrium is enforced by the stationary condition. At very low metallicity, on the contrary, the temperature in the upper layers of the 3D simulations tends to remain significantly below the radiative equilibrium value marked by the corresponding 1D model. The reason for this difference can be found by looking at the energy conservation equation. The temperature in the upper layers of 3D simulations is mostly regulated by two competing mechanisms: radiative heating due to the reabsorption by spectral lines of radiation coming from deeper in, and adiabatic cooling due to the expansion of the upflowing gas in granules. At very low metallicity, fewer and weaker lines contribute to the total opacity, therefore the significance of radiative heating from spectral lines is reduced, adiabatic cooling becomes preponderant, and the balance between the two mechanisms is achieved at lower temperatures than in stationary 1D models.
At [Fe/H], the temperature difference between the mean 3D and 1D photospheric structures is substantial and can amount to K. With regard to stellar spectroscopy, such differences, as well as temperature and density inhomogeneities, can have a dramatic effect on the predicted strengths of spectral lines. The cooler photospheric stratification of the 3D convection simulations of very metal-poor stars is expected to have affect significantly temperature-sensitive features, such as molecular lines or weak low-excitation lines from minority species (e.g. neutral metals). Gravity-sensitive features are also affected as the lower photospheric temperatures of the 3D simulations also imply reduced gas and electron pressures.
3 Spectral line formation
As mentioned above, 3D simulations of convection at the surface of late-type stars can be used as time-dependent, 3D, hydrodynamical model atmospheres for spectral line formation purposes. In this section, I will sketch the general strategy used to compute line profiles with 3D model atmospheres and to derive differential 3D1D elemental abundances. From the full convection simulations, representative sequences of typically - snapshots are taken at regular intervals in time; these time-series should cover sufficiently long periods to provide good statistical samples of the evolution of the surface granulation patterns. The snapshots are interpolated to a finer depth-scale to increase the spatial resolution in the atmospheric layers with optical depth less than to achieve higher numerical accuracy. Flux profiles are computed for a variety of lines from metals and molecules. The radiative transfer equation is solved for about to wavelength-points per spectral line profile, along typically - rays, and for all grid-points at the surface of the 3D model. As during the construction of the simulation, the assumption of LTE is made, with scattering treated as true absorption. The same numerical code, input physics, and opacity data are used to compute spectral line profiles with 1D model atmospheres corresponding to the same stellar parameters; in the 1D calculations, a non-zero value of the micro-turbulence is adopted to mimic non-thermal Doppler broadening of the lines. I would like to emphasize once more here that in 3D, on the contrary, no free parameters such as micro- or macro-turbulence enter the calculations: only the velocity fields predicted by the convection simulations are taken into account to reproduce non-thermal broadening, asymmetries, and wavelength shifts associated with the bulk motions of the gas in the stellar atmosphere.
The impact of 3D hydrodynamical models on stellar spectroscopy is evaluated by means of a differential 3D1D abundance analysis based on a simple curve-of-growth method. The abundance of the trace element is varied independently in the 3D and 1D calculations to match the equivalent width of a given spectral line; the difference between the two abundances represents the differential 3D1D correction to the abundance of the trace element derived from that particular spectral feature.
4 Results
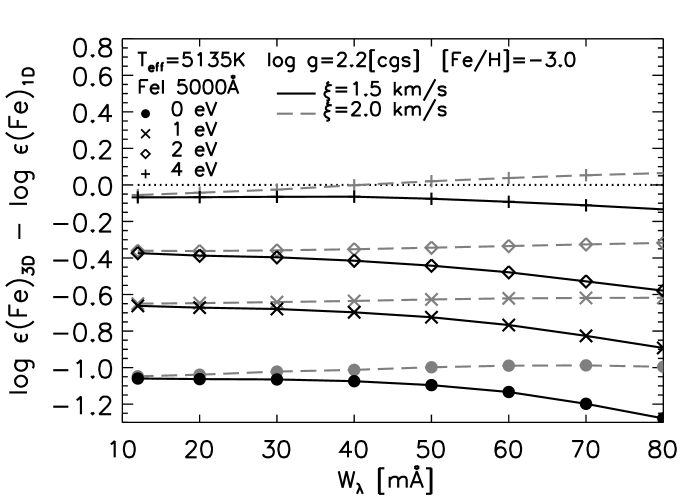
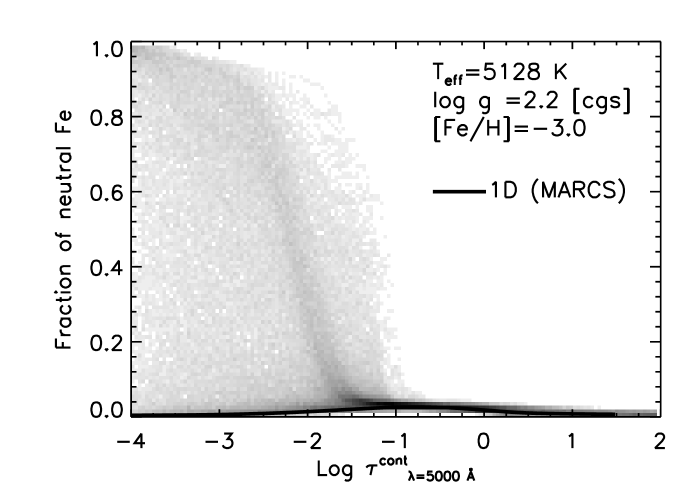
In this section, I will present some representative results of differential 3D1D LTE abundance analyses at very low metallicity, where the impact of 3D models on the strengths of spectral lines is anticipated to be largest. Figure 3 shows the differential 3D1D LTE corrections to the Fe abundance for a very metal-poor red giant as derived from “fictitious” Fe i lines at Å with varying equivalent widths ( between and mÅ) and lower-level excitation potentials.222Fictitious lines (?, ?, ?, ?) provide a benchmark to analyse the behaviour of spectral lines solely as a function of lower-level excitation potential, wavelength, and strength, disregarding complications introduced by blends and wavelength dependency of continuous opacities in samples of real lines. Such corrections are overall large and negative, particularly in the case of low-excitation lines, for which the differences between the predicted 3D and 1D LTE Fe abundances are of the order of dex. The behaviour of the differential 3D1D LTE iron abundances from Fe i lines at low metallicity can be qualitatively explained by comparing the variations of the fraction of neutral-to-total Fe number densities with optical depth in the 3D hydrodynamical and in the corresponding 1D marcs model atmospheres (Fig. 4). Under he assumption of LTE, in the 1D marcs model, iron is nearly completely ionized throughout the atmosphere; on the contrary, in the 3D model, the lower surface temperatures encountered in the upper photosphere allow a significant fraction of iron to recombine into neutral form. Hence, at a given Fe abundance, the density of absorbing neutral iron particles will be higher in the upper photosphere of the 3D model than in the 1D model and Fe i lines will also appear stronger. Reversely, comparing with the 1D case, a lower Fe abundance is required in 3D to match the same equivalent width of a given Fe i line.
A similar behaviour holds for the differential 3D1D LTE abundance corrections derived from lines of other neutral metals (?, ?). Molecule formation as well shows an extreme sensitivity to temperature in the upper photospheric layers of late-type stars. This temperature sensitivity causes the 3D1D LTE corrections to elemental abundances derived from the analysis of molecular features to also be large and negative in very metal-poor stars (?, ?, ?).
5 3D abundance analysis of extreme halo stars
An interesting application of 3D model atmospheres of very metal-poor stars is the investigation of the impact of stellar granulation on the abundance analysis of the two extremely iron-poor halo stars HE01075240 and HE13272326 (?, ?). These two stars are remarkable in the sense that the abundance of the iron-peak elements in their atmospheres is the lowest ever observed in stellar environments ([Fe/H]), while at the same time they are characterized by very large over-abundances of carbon, nitrogen, and oxygen with respect to iron. The interest aroused by these two objects comes from the consideration that HE01075240 and HE13272326 might be direct descendants of a previous generation of metal-free stars. Various hypotheses have been proposed to explain the origin of the two stars but in order to identify the most plausible formation scenario, an accurate determination of the their chemical composition is necessary. ? and ? have performed an abundance analysis of HE01075240 and HE13272326 with the aid of 3D model atmospheres and following the basic procedure sketched in Sec. 3. The main results of the 3D1D LTE abundance analysis of the two stars are summarized in Tab. 1. The 3D LTE Fe abundance is estimated to be about dex lower than according to the 1D analysis, while the abundances of carbon, nitrogen, and oxygen derived from CH, NH, and OH molecular lines are decreased by dex or more. In the case of HE0107-5240, it is possible to derive the value of C and N abundances from more than one molecular indicator. Interestingly, while ? found a discrepancy of about dex between the 1D carbon abundance values derived from CH and C2 lines, the 3D analysis brings the abundances from these two indicators down to the same value of dex. The 3D analysis of CN lines in HE0107-5240, however, returns an extremely large and negative 3D1D correction to the nitrogen abundance (about dex), which is not consistent with the 3D1D correction evaluated from NH lines (see Tab. 1). This discrepancy could be, on the other hand, ascribable to the highly uncertain -values of NH lines (?). This problem certainly deserves further investigation.
-
HE01075240 HE13272326 Element Indicator C CH C C2 – – N NH N CN – – O OH Fe Fe i -
a (?, ?, ?)
-
b (?)
-
c (?)
-
d Assuming
6 Discussion
The prediction of photospheric temperatures significantly below the radiative equilibrium value is a central result of surface convection simulations of metal-poor late-type stars. One implication of this result is that 3D1D abundance corrections in very metal-poor stars are in general significantly larger than other systematic errors usually quoted in classical abundance analyses (?). It is therefore necessary to investigate to what extent the cooler temperature stratification of the 3D models is controlled by the assumptions made during the construction of the simulations.
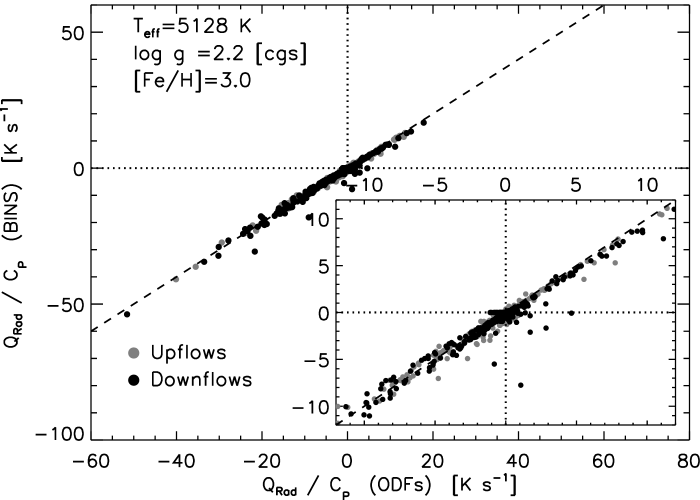
A relevant question in this respect is whether the opacity-binning scheme used for the calculation of the radiative heating rates represents a reasonably accurate approximation to the solution of the radiative transfer equation for the full set of wavelengths of the original opacity distribution functions (ODFs). Figure 5 shows the results of test calculations where the radiative heating rates are computed with the two different approaches in “1.5D” approximation along individual columns in a vertical slice of a metal-poor red giant simulation snapshot. The correlation between the opacity-binning and ODF-based schemes is very good, suggesting that the former is probably accurate enough in reproducing radiative heating and temperatures at the surface of metal-poor 3D simulations.

Another important issue is whether the treatment of scattering as true absorption in the solution of the radiative transfer equation introduces systematic errors in the temperature at the surface of 3D convection simulations. According to preliminary tests with 1D os-marcs (?) model atmospheres of metal-poor giants, the 1D temperature stratifications predicted when scattering is included as true absorption is overall hotter than in calculations where scattering is treated correctly as such. In the example considered in Fig. 6, temperature differences between the two cases reach K in the upper photosphere. This result would therefore suggest that the radiative heating rates and temperature might actually be overestimated at the surface of 3D models of metal-poor stars. It is not obvious, however, that the effect of implementing scattering as true absorption would proceed in the same direction in 3D. A full 3D treatment of scattering is paramount in this respect to establish whether the surface temperatures possibly underestimated in present metal-poor 3D models. I refer to the contribution of W. Hayek in these proceedings for more details about 3D radiative transfer with scattering in convection simulations.
It is also crucial to assess how spectral line formation is affected by the approximations involved in the solution of the radiative transfer equation. The treatment of scattering as true absorption is a matter of concern also for 3D line formation calculations. Rayleigh scattering off H i is, in fact, an important source of extinction in the UV and blue part of the spectrum. At those wavelength, implementing scattering as true absorption causes the outgoing flux in the continuum to be underestimated and hence leads to the prediction of weaker spectral lines. The effect is expected to be more important at very low metallicities, due to the weak line-blocking, and in in metal-poor 3D model atmospheres where the density of scatterers (H i) is high because of the low surface temperatures. The use of a differential 3D1D abundance analysis ensures at least that the uncertainties in the treatment of scattering are minimized.
Finally, I would like to caution that many of the abundance indicators considered in the present contribution (e.g. neutral metals and possibly molecules as well) are most likely affected by departures from LTE or from chemical equilibrium at the local temperature. Neutral iron, for instance, is expected to be prone to such departures. The main non-LTE mechanism for Fe i in the photospheres of late-type stars is namely efficient over-ionization driven by the UV radiation field coming from layers deeper in. This causes Fe i levels to be underpopulated with respect to LTE, makes Fe i lines weaker than the LTE case at a given Fe abundance, and, consequently, leads to the prediction of higher Fe abundances. Fe i departures from LTE have been estimated by (?) for the two extreme halo stars HE01075240 and HE13272326 by means of a 1D analysis (Tab. 2). The results of this preliminary calculations clearly suggest that the non-LTE effects are considerable and opposite to the corrections for stellar granulation. This implies that a combined 3D non-LTE analysis of Fe i line formation in a similar way as done by ? and ? for Li i is essential to produce realistic Fe abundance determinations. For completeness, I should also add that the departures of Fe i from LTE depend crucially on the magnitude of H+Fe collisional excitation and ionization processes, whose cross-sections are still poorly known. This explains, at least in part, why current estimates of non-LTE effects on Fe i line formation are still hampered by large uncertainties (see also review by A. Korn in these proceedings).
-
HE01075240 HE13272326 Model [Fe/H]LTE [Fe/H]non-LTE [Fe/H]LTE [Fe/H]non-LTE 1D marcs mean 3D
7 Conclusions
I have presented here some illustrative results of the application of 3D surface convection simulations of very metal-poor stars to spectral line formation in LTE. The differences between the predicted temperature stratifications of 3D hydrodynamical simulations and 1D hydrostatic model atmospheres, and the 3D temperature and density inhomogeneities and correlated velocity gradients can significantly affect line strengths and, in turn, the elemental abundances inferred from spectral lines. At very low metallicities, the deviations of the mean 3D thermal structure from the classical 1D stratification are largest, and cause the 3D1D LTE differential abundances to be negative and considerable for lines of neutral species (down to about dex for weak low-excitation Fe i line). Corrections to CNO abundances derived from weak low-excitation CH, NH, and OH features are also found to be typically in the range dex to dex in very metal-poor giants (?). Finally, I have discussed possible systematic errors affecting the present 3D abundance analyses, such as departures of Fe i line formation from LTE; non-LTE corrections to the Fe abundance are opposite to and, according to preliminary 1D test calculations, of the same order of magnitude as the ones due to stellar granulation.
References
References
- [1]
- [2] [] Asplund M 2005 ARA&A 43, 481–530.
- [3]
- [4] [] Asplund M, Carlsson M & Botnen A V 2003 A&A 399, L31–L34.
- [5]
- [6] [] Asplund M & García Pérez A E 2001 A&A 372, 601–615.
- [7]
- [8] [] Asplund M, Gustafsson B, Kiselman D & Eriksson K 1997 A&A 318, 521–534.
- [9]
- [10] [] Asplund M, Nordlund Å, Trampedach R & Stein R F 1999 A&A 346, L17–L20.
- [11]
- [12] [] Baade W 1944 ApJ 100, 137–+.
- [13]
- [14] [] Barklem P S, Belyaev A K & Asplund M 2003 A&A 409, L1–L4.
- [15]
- [16] [] Bessell M S & Christlieb N 2005 in V Hill, P François & F Primas, eds, ‘From Lithium to Uranium: Elemental Tracers of Early Cosmic Evolution’ Vol. 228 of IAU Symposium pp. 237–238.
- [17]
- [18] [] Bessell M S, Christlieb N & Gustafsson B 2004 ApJ 612, L61–L63.
- [19]
- [20] [] Böhm-Vitense E 1958 Zeitschrift fur Astrophysik 46, 108–+.
- [21]
- [22] [] Canuto V M & Mazzitelli I 1991 ApJ 370, 295–311.
- [23]
- [24] [] Carlsson M, Stein R F, Nordlund Å & Scharmer G B 2004 ApJ 610, L137–L140.
- [25]
- [26] [] Chamberlain J W & Aller L H 1951 ApJ 114, 52–+.
- [27]
- [28] [] Christlieb N, Bessell M S, Beers T C, Gustafsson B, Korn A, Barklem P S, Karlsson T, Mizuno-Wiedner M & Rossi S 2002 Nature 419, 904–906.
- [29]
- [30] [] Christlieb N, Gustafsson B, Korn A J, Barklem P S, Beers T C, Bessell M S, Karlsson T & Mizuno-Wiedner M 2004 ApJ 603, 708–728.
- [31]
- [32] [] Collet R, Asplund M & Thévenin F 2005 A&A 442, 643–650.
- [33]
- [34] [] Collet R, Asplund M & Trampedach R 2006 ApJ 644, L121–L124.
- [35]
- [36] [] Collet R, Asplund M & Trampedach R 2007 A&A 469, 687–706.
- [37]
- [38] [] Drawin H W 1968 Zeit. für Phys. 211, 404–417.
- [39]
- [40] [] Drawin H W 1969 Zeit. für Phys. 225, 483–493.
- [41]
- [42] [] Frebel A, Aoki W, Christlieb N, Ando H, Asplund M, Barklem P S, Beers T C, Eriksson K, Fechner C, Fujimoto M Y, Honda S, Kajino T, Minezaki T, Nomoto K, Norris J E, Ryan S G, Takada-Hidai M, Tsangarides S & Yoshii Y 2005 Nature 434, 871–873.
- [43]
- [44] [] Frebel A, Collet R, Eriksson K, Christlieb N & Aoki W 2008 ArXiv e-prints 805.
- [45]
- [46] [] Freytag B, Steffen M & Dorch B 2002 Astronomische Nachrichten 323, 213–219.
- [47]
- [48] [] Grevesse N & Sauval A J 1998 Space Sci. Rev. 85, 161–174.
- [49]
- [50] [] Gustafsson B 2004 in A McWilliam & M Rauch, eds, ‘Origin and Evolution of the Elements’ p. 102.
- [51]
- [52] [] Gustafsson B, Bell R A, Eriksson K & Nordlund Å 1975 A&A 42, 407–432.
- [53]
- [54] [] Gustafsson B, Edvardsson B, Eriksson K, Graae Jorgensen U, Nordlund A & Plez B 2008 ArXiv e-prints 805.
- [55]
- [56] [] Gustafsson B & Jorgensen U G 1994 A&A Rev. 6, 19–65.
- [57]
- [58] [] Krishna Swamy K S 1969 A&A 1, 297–+.
- [59]
- [60] [] Kurucz R L 1992 Revista Mexicana de Astronomia y Astrofisica 23, 181–186.
- [61]
- [62] [] Kurucz R L 1993 Opacities for Stellar Atmospheres Vol. 2–12 of Kurucz CD-ROMs Cambridge, Mass.: SAO.
- [63]
- [64] [] Ludwig H G, Allard F & Hauschildt P H 2002 A&A 395, 99–115.
- [65]
- [66] [] Mihalas D, Däppen W & Hummer D G 1988 ApJ 331, 815–825.
- [67]
- [68] [] Nordlund Å 1982 A&A 107, 1–10.
- [69]
- [70] [] Nordlund Å & Dravins D 1990 A&A 228, 155–217.
- [71]
- [72] [] Roman N G 1950 ApJ 112, 554–+.
- [73]
- [74] [] Schwarzschild M & Schwarzschild B 1950 ApJ 112, 248–+.
- [75]
- [76] [] Steffen M & Holweger H 2002 A&A 387, 258–270.
- [77]
- [78] [] Stein R F & Nordlund Å 1998 ApJ 499, 914–933.
- [79]
- [80] [] Vögler A 2004 A&A 421, 755–762.
- [81]