-
The Metallicity Distribution of Distant F and G type stars in the CFHT Legacy Survey Deep Field
Abstract: We study the metal abundances of F and G type stars in the Galactic disk and halo using the CanadaFranceHawaii Telescope Legacy Survey D4 field. For a sample of stars within 7 kpc of the Galactic plane, we derive mean abundance values of [Fe/H] dex for the thick disk, and [Fe/H] dex for the stellar halo, respectively. These metallicites are consistent with the metallicity estimates from the Sloan Digital Sky Survey Data Release 6. We do not find a vertical abundance gradient for the thick disk between 1 kpc and 4 kpc. However, stars within 1 kpc of the Galactic plane are saturated in our dataset, and therefore we cannot rule out the observed vertical metallicity gradient for the thick disk stars in the . Moreover, we find a negative trend in the halo metallicity with increasing distance from the Galactic plane. This trend could be due to a contribution from an increasing number of very metal poor stars that belong to the outer halo. However, systematic effects in photometric metallicities are largest for the most metal poor stars, and therefore these effects cannot be ruled out.
Keywords: stars: abundances: stars: distances: techniques: photometric
1 Introduction
Our view of the formation of the Milky Way has changed dramatically since the discoveries of complex substructures in the Galaxy. The Milky Way has four spatially and kinematically distinct components; thin disk, thick disk, halo, and the bulge. However, recent discoveries of irregular structures like the Sagitarrius dwarf tidal stream and the Monoceros stream show that the formation of galaxies is not a steady process resulting in a smooth distribution of stars. Instead, galaxies are constantly shaped by the infalling smaller galaxies (see Juric et al. 2008 and the references there in).
The Sloan Digital Sky Survey () and the Sloan Extension for Galactic Understanding and Exploration () are providing photometry and spectroscopy for a very large number of stars that can be used to study the stellar populations in the Galaxy. Such a study involving stars with the SDSS spectra demonstrated that the Galactic halo is likely to have two components; an inner and an outer component (Carollo et al. 2007). These two components seem to have different spatial density profiles, stellar orbits, and metallicities. Carollo et al. (2007) suggest that the outer halo formed through dissipationless chaotic merging of smaller subsystems within a pre-existing dark matter halo, supporting the complex galaxy formation scenarios. Ivezic et al. (2008) use the SDSS photometry data to study the metallicity distribution of disk and halo stars. However, their dataset is not deep enough to test the dichotomy of the halo.
The CanadaFranceHawaii Telescope Legacy Survey () provides a valuable new source to study the metallicity distribution of the Galactic stellar populations. The third data release of the Deep survey now provides photometry down to a limiting magnitude of 26. lack spectroscopic observations, which would provide the most accurate metallicities. However, imaging data can also be used to deduce stellar metallicities through the traditional UV excess method (Wallerstein 1962; Sandage 1969). The metal absorption lines mostly affect the UV part of the spectrum, therefore metalrich and metalpoor stars with the same effective temperature (or the same color) can be differentiated based on their UV colors. In addition, imaging data enables us to obtain a complete flux-limited sample of stars and push the studies of stellar metallicities to fainter magnitudes than the spectroscopic surveys. Here we use the data for the D4 Field to perform such an analysis. Section 2 describes the data and the selection of point sources. The derivation of metallicites from the photometric data and its application to the system is discussed in Section 3, whereas the results from this analysis are discussed in Section 4.
2 The Data
The CFHTLS D4 field is located at RA = , DEC = (J2000), , and . The TERAPIX T003 public data release for the D4 field covers an area of 0.86 deg2 and provides photometry with limiting AB magnitudes of 26.5, 26.3, 26.4, 26.0, and 25.0, respectively. The high galactic latitude of this field is similar to the fields targeted by the .
Without follow-up spectroscopy, we have to rely on morphological classification to select point sources. Schultheis et al. (2006) and Limboz et al. (2008) showed that the stargalaxy separation is possible through the use of the halflight radius (hereafter, HLR) measurements from the -band images. HLR corresponds to the radius that encloses 50% of the total flux from the source. Figure 1 shows the HLR versus -band magnitudes for the sources in the D4 field. Objects with mag are saturated, and therefore have unreliable HLR measurements. Using spectroscopic data from the VLTVIRMOS Deep Survey (; Le Fevre et al. 2005), Limboz et al. (2008) demonstrated that the spectroscopically confirmed stars have HLR( and that the stargalaxy separation is reliable down to mag. Since the goes five magnitudes deeper than this, we now look into pushing the point source classification limit to fainter magnitudes.
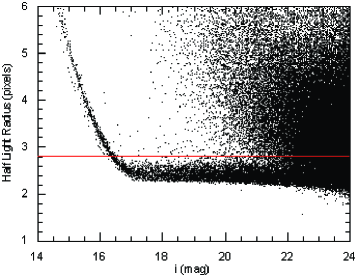
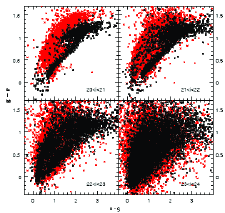
Figure 2 presents versus colorcolor diagrams for four different magnitude bins. The top left panel shows the colorcolor diagram for point sources (black points) and resolved sources (red points) for mag, where the point source classification seems reliable. This panel reveals a tight stellar sequence, and confirms the expectations that stars can be identified reliably down to 21 mag. The other panels in this figure show the colorcolor diagrams for and mag. These three panels show that the stellar sequence is still clearly visible for , but the galaxy contamination starts to become a problem for mag. We count the number of sources that are classified as point-like and that lie to the left of the stellar sequence, and compare it with the number distribution of resolved sources with HLR( to estimate contamination of the stellar sequence by galaxies. We estimate that the galaxy contamination is less than 4% in the range mag for mag. An analysis of the number distribution of resolved and un-resolved sources in the other panels show that the galaxy contamination ranges from 7% to 23% for mag, and even higher for mag. Therefore, we restric our sample to the sources with mag and . Using the above criteria, we classify 7348 sources as stars.
We use the dust maps of Schlegel at al. (1998) to de-redden the photometry. E() for the D4 field ranges from 0.023 to 0.031 mag, with a mean of 0.027 mag. The small range of reddening correction for the D4 field shows that this correction does not have a signifincant effect on our analysis. Perhaps the most important correction required for the photometry is the correction from the system to the standard filter system. Studying the differences between the system and the system, Clem et al. (2008) find that the filters are consistent with the standard system, though the band data need to be corrected using a third order polynomial. The band filter was selected to take advantage of the better UV transparency of the and it is slightly redder than the band filter. Clem et al. (2008) compare theoretical isochrones in the standard system and the corrected system and they find that the isochrones overlap each other within 0.01 mag for both dwarfs and giants with colors = 0.0 to +3.0 mag and to +3.5 mag, and with metallicities [Fe/H] = to 0.0. We use the transformation given by Clem et al. (2008) (see their Figure 5) to convert the band photometry into the standard band system. In addition, a correction is required to transform the photometry from the primed system to the 2.5 m telescope’s unprimed system. We use the transformations given by Tucker et al. (2006) to transform the photometry to the unprimed system.
The apparent magnitude distribution for our sample of stars is shown in Figure 3a. The number of stars increases with increasing magnitude until 22.1 mag, which we use as the completeness limit. For a G5 mainsequence star with = 0.4 mag (see Table 1 in Ivezic et al. 2008), this limit corresponds to a Galactocentric distance of 21 kpc and a Galactic plane distance of 17 kpc. Figure 3b shows the color distribution for our sample. There are two distinct peaks located at 0.20 mag and 1.15 mag, corresponding to F stars and late type M stars, respectively. We select our sample of F and G type stars by restricting the sample to the stars with (shown by vertical dashed lines). This results in a sample of 1315 F and G stars. Majority of these stars lie above the synthetic vs. relation of Pickles (1998), indicating that they are metalpoor disk and halo stars.
3 The Metallicity Distribution
Using spectroscopy and photometry, Ivezic et al. (2008) have developed a metallicity estimation method based on the and colors. Their method reproduces the metallicities obtained from low resolution spectroscopy with a root-mean-square scatter of 0.2 dex. They also derive a photometric parallax relation using photometry of globular clusters. The agreement between the and the filter sets, after correcting the band photometry (Clem et al. 2008), enables us to use their photometric metallicity and parallax methods on our dataset. Photometric metal abundances of the F and G dwarfs with , are determined via the following equation of Ivezic et al. (2008).
| (1) |
For G dwarfs with , we replaced the color in the above equation with . We estimate the absolute magnitudes of our sample of stars using the following relations from Ivezic et al. (2008).
| (2) |
| (3) |
| (4) |
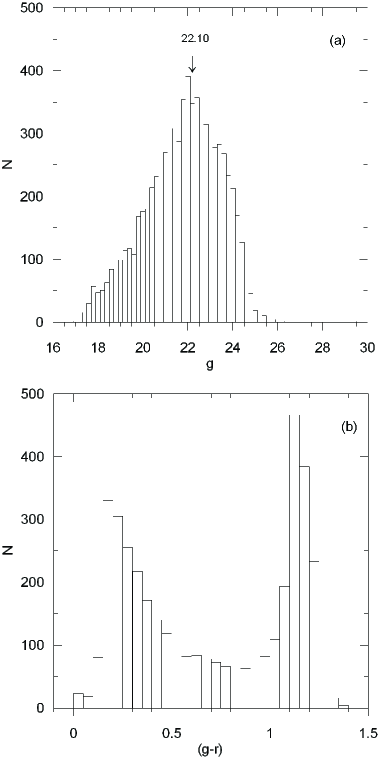
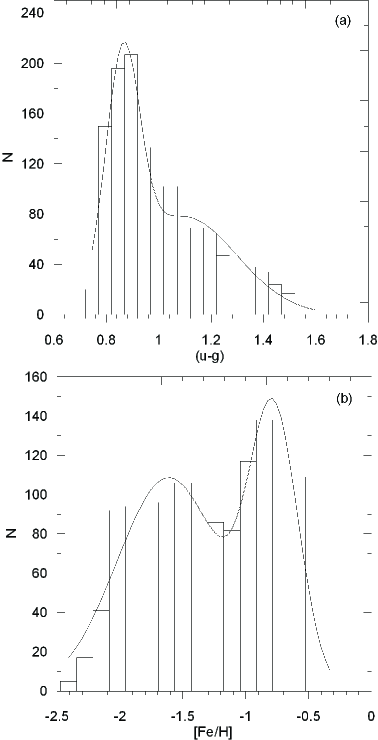
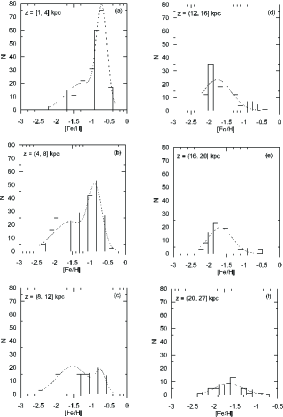
Figure 4 displays the color distribution and the derived metallicities for our sample of F and G stars. Both of these distributions are bimodal, and they are fairly well fitted with two gaussians. Ivezic et al. (2008) also found a bimodal color distribution for the sample with two peaks at and 1.1 mag. The two peaks observed in the color distribution of our sample are located at and mag. The agreement between the colors of our sample of F and G stars and that of the F and G stars shows that the transformations between the photometry and the standard system are reliable. The two peaks in the color distribution correspond to metalpoor halo stars and more metalrich and closer disk stars, respectively. The width of 0.13 mag is significantly larger than the median error of 0.02 mag at mag, providing a measure of the intrinsic variations in the color and the metallicity distribution.
The observed peaks in the color distribution translates into two peaks at [Fe/H] = and in the metallicity distribution. Figure 5 shows this distribution as a function of increasing distance from the Galactic plane. The mean metal abundances for the fitted gaussians are also listed in Table 1. The mean metal abundance shifts as a function of galactic plane distance. The thick disk dominates at kpc, and a small contribution is still visible up to kpc, after which only the halo stars with [Fe/H] are visible.
4 Discussion
Our mean metallicity estimate of [Fe/H] = for the thick disk is consistent with the results from the analysis of F and G stars in the . Using the Data Release 3 spectroscopy, Allende Prieto et al. (2006) found that thick disk G dwarfs with kpc show a compact metallicity distribution with a peak at [Fe/H] . Our mean metallicity estimates for = 12, 23, and 34 kpc (see Table 1) range from to dex, and they are entirely consistent with the Allende Prieto et al. result. However, the mean metallicity for the thick disk is more metalpoor compared to the literature values of (Gilmore &Wyse 1985) and (Carney et al. 1989). Since the photometric metallicity relation is known to underestimate the metallicity at high metallicities (see the discussion in Ivezic et al. 2008), our mean metallicity estimate for the thick disk probably suffers from these systematic effects.
Using the Data Release 6 photometry, Ivezic et al. (2008) found that the median metallicity for the thick disk smoothly decreases with distance from the plane from [Fe/H] = at 500 pc to at several kpc. We do not observe such a metallicity gradient for the thick disk between = 1 kpc and 4 kpc, but our mean metallicity estimate is consistent with their mean metallicity estimate beyond several kpc, dex. In fact, if we restrict our sample to kpc, then the mean metallicity peak for the thick disk stars in our sample shifts to [Fe/H] = , entirely consistent with the Ivezic et al. analysis. Since stars with mag are saturated in the data, we do not have any stars within 1 kpc of the Galactic plane. The trend found by Ivezic et al. is mostly based on the relatively brighter stars in their sample111This sample may be contaminated by metal-rich stars that belong to the high velocity tail of the thin disk distribution., which show a peak in metallicity at [Fe/H] . The majority of the kpc thick disk stars in their sample show a peak around [Fe/H] (see their Figure 7), similar to our analysis.
| (kpc) | |||||
|---|---|---|---|---|---|
| 1.5 | 0.73 | 0.30 | - | - | |
| 2.5 | 0.73 | 0.36 | 1.36 | 1.02 | |
| 3.5 | 0.71 | 0.29 | 1.36 | 0.88 | |
| 2.5 | 0.71 | 0.29 | 1.27 | 0.89 | |
| 6.0 | 0.85 | 0.38 | 1.57 | 0.96 | |
| 10.0 | 0.72 | 0.28 | 1.54 | 0.95 | |
| 14.0 | - | - | 1.77 | 0.69 | |
| 18.5 | - | 1.67 | 0.68 | ||
| 23.5 | - | - | 1.65 | 0.62 |
Figure 6 shows the metallicity trends for the thick disk and halo as a function of the Galactic plane distance. If we ignore the thick disk metallicity estimates beyond 8 kpc due to small number statistics, then a small shift in metallicity is observed for the thick disk between 4 and 8 kpc. However, the mean metallicities for the stars with = 14 kpc and 48 kpc are consistent within the errors. In addition, we do not find any significant trend between the Galactocentric distance and metallicity for the thick disk stars.
Our metallicity estimate of for the halo is consistent with the literature values of 1.60 dex (Ryan & Norris 1991) and 1.70 dex (Carney et al. 1996). However, it is more metal poor than the halo metallicity derived using the F and G stars (Allende Prieto et al. 2006; Ivezic et al. 2008). Allende Prieto et al. (2006) found that the halo stars exhibit a broad range of iron abundances with a peak at [Fe/H] = , whereas Ivezic et al. (2008) find a peak at 1.46 dex with a standard deviation of 0.30 dex. Restricting our sample to kpc, as in the Ivezic et al. study, we find that the mean metallicity for the halo stars within = 7 kpc is [Fe/H] = . Therefore, our metallicity estimates for both the thick disk and halo are consistent with the results from the analysis of stars within = 7 kpc.
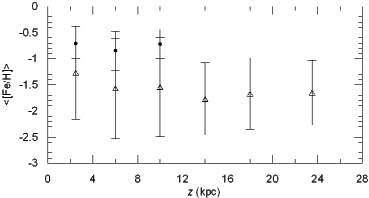
Since our results are consistent with the results from the , and the data goes deeper than the , we can use the data to study the stars more than 7 kpc away from the Galactic plane. Our dataset is complete up to = 17 kpc for stars and up to 11 kpc for the entire sample (see Section 2). Figure 6 shows that the mean metallicity for the halo decreases with increasing distance from the plane of the Galaxy. However, the metallicities are also consistent within the errors. If the decline in halo metallicity is real, this trend in metallicity and the observed broad distribution may be due to the inclusion of an increasing number of very metal poor stars in the halo.
Using spectroscopic and kinematic data from the Data Release 5, Carollo et al. (2007) found a dichotomy in the metallicity distribution of the halo stars with two peaks at [Fe/H] and [Fe/H] . They found that stars that reach large distances in their orbits above the Galactic plane show a metallicity peak around 2.1 dex, and they identified those stars as members of the outer halo. Since the number of these outer halo stars with retrograde orbits is small compared to the inner halo stars, it is impossible to identify them without kinematic information. However, a comparison of the observed metallicity distribution for our sample of stars and the fitted double gaussians in Figure 5 shows that the metalpoor tail end of the gaussian distribution for the halo underestimates the number of observed stars for kpc. The majority of the panels in Figure 5 show a nearly flat distribution of stars between [Fe/H] = and . This could be caused by a contribution from the outer halo stars. However, without kinematic information, we cannot confirm or reject this idea. In addition, the systematic effects for the photometric metallicity estimates are largest for the most metalpoor stars. Ivezic et al. (2008) find that the root-mean-square scatter of the residuals between the photometric and spectroscopic metallicity estimates of the F and G stars in the increases up to 0.30 dex for low metallicity stars. Even though we corrected for the differences between the filter and the standard filter set, a small error in this transformation may also result in systematic offsets. For example, an offset of 0.04 mag in the band data can cause a metallicity bias of up to 0.20 dex (Ivezic et al. 2008). Hence, the observed distribution may be affected by these systematic problems.
5 Conclusions
We have performed a morphological selection of point sources and analyzed the metallicity distribution of distant F and G type stars in the D4 field. We have used photometry transformed to the standard filter system, and used the photometric parallax and metallicity relations from the to obtain metallicities and distances for our sample of 1315 F and G type stars.
Limiting our study to = 7 kpc, the distance limit used by Ivezic et al. (2008), we find that our estimates for the mean metallicity of the thick disk ([Fe/H] = ) and halo (1.42 dex) are consistent with the results from the Data Release 6 photometry (0.80 dex and 1.46 dex). Since the data is deeper than the , we are also able to check for trends in the thick disk and halo metallicity distribution beyond 7 kpc. Unlike the Ivezic et al. study, we do not find a trend in metallicity for the thick disk between 1 and 4 kpc. However, the significance of the trend observed in the dataset comes from the stars within 1 kpc of the Galactic plane. Unfortunately, those stars are saturated in the observations, and the metallicity trend for the thick disk stars further away than 1 kpc from the plane is consistent with the results.
We observe a decline in metallicity of the halo with increasing distance from the Galactic plane. We suggest that this decline may be due to an increasing contribution from the very metal poor ([Fe/H]) halo stars, but we cannot rule out systematic problems in our analysis. Proper motion data from the observations will be available at the end of the survey period. These data will be useful to study the kinematic properties of our sample of stars and constrain the contribution of very metal poor stars.
6 Acknowledgements
We thank D. An for useful discussions, C. Benoist for providing us with the CFHTLS data, and the anonymous referee for useful comments. This work is partly based on observations obtained with MegaPrime / MegaCam, a joint project of CFHT and CEA/DAPNIA, at the Telescope (CFHT) which is operated by the National Research Council (NRC) of Canada, the Institut National des Science de l’Univers of the Centre National de la Recherche Scientifique (CNRS) of France, and the University of Hawaii. This work is based in part on data products produced at TERAPIX and the Canadian Astronomy Data Centre as part of the Canada-France-Hawaii Telescope Legacy Survey, a collaborative project of NRC and CNRS.
References
- Allende Prieto et al. (2006) Allende Prieto, C., Beers, T. C., Wilhelm, R., Newberg, H. J., Rockosi, C. M., Yanny, B., & Lee, Y. S. 2006, ApJ, 636, 804
- Carney et al. (1989) Carney, B., Latham, D. W., & Laird, J. B., 1989, ApJ, 97, 423
- Carney et al. (1996) Carney, B., Laird, J. B., Latham, D. W., &Aguilar, L.A., 1996, AJ, 112, 668
- Carollo et al. (2007) Carollo, D. et al. 2007, Nature, 450, 1020
- Clem et al. (2008) Clem, J., VandenBerg, D.A., Stetson, P., 2008, AJ, 135, 682
- Gilmore &Wyse (1985) Gilmore, G., Wyse, R.F.G., 1985, AJ, 90, 2015
- Helmi et al. (2003) Helmi, A. et al., 2003, ApJ, 586, 195
- Ivezic et al. (2008) Ivezic, Z. et al., 2008, ApJ, 684, 287
- Le Fevre et al. (2005) Le Fevre, O. et al., 2005, A&A, 439, 845
- Limboz et al. (2008) Limboz, F., Karatas, Y., Kilic, M., Benoist, C., Alis, S. 2008, MNRAS, 383, 957
- Ryan & Norris (1991) Ryan, S.G.., Norris, J.E., 1991, AJ, 101, 1865
- Schlegel at al. (1998) Schlegel, D. J., Finkbeiner, D. P., Davis, M., 1998, ApJ, 500, 525.
- Schultheis et al. (2006) Schultheis, M., Robin, A., Reyle, C., McCracken, H.J., Bertin, E., Mellier, Y., Le Fevre, O., 2006, A&A, 447, 185
- Pickles (1998) Pickles, A.J., 1998, PASP, 110, 863
- Tucker et al. (2006) Tucker, D.L. et al., 2006, AN, 327, 821
- Sandage (1969) Sandage, A. 1969, ApJ, 158, 1115
- Wallerstein (1962) Wallerstein, G. 1962, ApJS, 6 ,407