22email: stefano.andreon@brera.inaf.it
Morphology of galaxies in the Coma cluster region down to
This paper presents morphological type, membership, and color for a sample of galaxies in the Coma cluster direction, complete down to mag and extending down to mag. We have examined 1155 objects from the GMP 1983 catalog on B and V images of the CFH12K camera, and obtained the Hubble type in most cases. Coma cluster membership for 473 galaxies was derived using morphology, apparent size, and surface brightness, and, afterward, redshift. The comparison among morphology- and redshift- memberships and among luminosity functions derived from this morphologically-selected sample, or by using statistical members or spectroscopic members, all show that the morphological membership provided here can be trusted. For the first time, the morphological classification of Coma galaxies reaches magnitudes that are faint enough to observe the whole magnitude range of the giant types, E, S0, and spiral stages. The data presented in this paper makes our sample the richest environment where membership and morphology for complete samples down to faint magnitudes ( mag) are available, thereby enlarging the baseline of environmental studies.
Key Words.:
Galaxies: luminosity function, mass function – Galaxies: elliptical and lenticular, cD – Galaxies: Spirals Galaxies: dwarf Galaxies: clusters: individual: Coma1 Introduction
Morphological classification is probably the oldest tool used in galaxy studies, as recently reviewed in Sandage (2005). Galaxies populate only a limited number of forms. With these forms are associated, or correlated, a number of such important properties as luminosities, internal dynamics, and material composition, i.e. stars and ISM. In the study of such systems of galaxies as clusters, one would like to obtain statistically significant data, including of course the morphological types of all objects. But as emphasized by Buta (2000) the art of morphology is strongly dependent on the resolution of the images of galaxies that span such a large domain of intrinsic sizes and distances. The nec plus ultra in galaxy morphology still is the catalog of Binggeli et al. (1985 or BST2) for the Virgo cluster. An important novelty of this work was the use of morphology, apparent size, and surface brightness to ascertain the membership of faint galaxies in the cluster. It is indeed not feasible to extend redshift measurements to all detected objects, and the addition of appearance as a tool of distance estimates is welcome. The observation of new radial velocities (Binggeli et al. 1993) then confirmed nearly all the 1985 results.
The Coma cluster is one of the best-studied such objects because of its relative proximity and because it may be a prototype of dynamically relaxed clusters, although significant substructures are present (Colless & Dunn, 1996, Biviano et al. 1996). This is in marked contrast to other clusters such as Virgo with its complex geometry and important substructure (Binggeli & Huchra, 2000). Compared to the fair amount of photometric, colorimetric, and spectrographic information available for Coma cluster galaxies, morphological data are far from complete for these. Dressler (1980a, 1980b) described the overpopulation of early-type, E, and S0, galaxies in the Coma and other clusters in relation to their density, and introduced the morphology-density relation that is also discussed by Whitmore et al. (1993) and many other later works. These later studies used detailed photometry to refine the classification of relatively bright objects (Jorgensen & Franx, 1994; Michard, 1995; Andreon et al. 1996, 1997; Andreon 1996; Guttierez et al. 2004; Aguerri et al. 2004).
The aim of the present paper is to classify as many galaxies as it is feasible in the Coma cluster, increasing the number of members detected from velocity data by considering object morphology, apparent size, and surface brightness. In subsequent papers of this series, we will study the resulting member galaxies populations. These can be considered from two aspects: in-cluster variations and cluster-to-cluster comparisons. For this second approach we chose the Virgo cluster because of the superior quality and completeness of the BST2 data.
In the present paper, Sect. 2 summarizes the technical aspects of the classification, describes its output catalogs and presents an independent test of the validity of the morphological membership in the Coma cluster, i.e. the determination of the membership based on galaxy morphology, apparent size, and surface brightness. Section 3 presents our essential data: the catalog, the histograms of the various Hubble-types for Coma and the Virgo comparison sample, and a table showing the sample size of each morphological type in both clusters. We also introduce an auxiliary catalog of V magnitudes and UV colors derived from the data by Terlevich et al. (2001) (TCB01) and others. Section 4 briefly summarizes the results and gives some highlights of a later paper(s) in this series.

2 Morphological classification and membership
2.1 The used samples
The initial sample contains 1154 objects of the GMP catalog (Godwin et al. 1983) falling in the field of the CFH12K frames: the cut-off limit of the GMP is at , this magnitude being defined within the isophote. We added one galaxy, omitted in the GMP list, at X=879, Y=579 in the GMP coordinate system. We had to discard 17 stars and a number of objects that could not be classified for various reasons: CCD defects, vicinity of a bright star, severe blend, or truncation by a CCD edge.
We assume that the distance modulus of Coma is mag (Colless, 2000). On the other hand, we found the magnitudes to be 0.25 mag fainter in the mean than the usual B total corrected magnitudes of the RC2 or RC3 systems. This is derived from a comparison with the HYPERLEDA data base involving 38 bright E+S0 objects, with a scatter of 0.20 mag. The shift between the two systems may vary with magnitude and also Hubble-types. We adopt, however, the simple expression to transform the GMP catalog B magnitudes into absolute corrected magnitudes.
The Virgo comparison sample was derived from the catalog of BST2 and is intended to cover the same domain of absolute magnitude as the Coma sample. We adopt a distance modulus of 31.05 mag for the cluster (Ferrarese et al. 1996). A similar comparison as above led to for 152 objects of all types (). Then absolute magnitudes were obtained from the expression . We selected in the BST catalog the objects noted M, for members, with . We then rejected objects with the unusual types, BCD, or Amorphu. We had to suppress duplicates noted by the authors with the symbols or , the first named cell being retained. The final comparison Virgo sample numbers 514 galaxies.
2.2 Morphological classification
The deep frames from the CFH12K camera offer a convenient way to study Coma cluster galaxies in a relatively large field, i.e. 42x55, and at FWHM seeing (Adami et al. 2006). Exposure times are 7200 s in and in . One of us (RM) inspected the objects in the GMP catalog to determine the Hubble-types. We tried to follow the classification system adopted in a classical work on the Virgo cluster (Sandage & Binggeli, 1984; Sandage et al., 1985a; id., 1985b; Binggeli et al., 1985 or BST2), but the refinements introduced there for bright spirals could not be retained. In the early-type range, the types E, SA0, SB0, and E/S0 with the eventual addition of p for peculiar, and of c for compact (Ec exclusively) were considered. For spirals, the types SAa, SAb, SAc and their counterparts (SBa, SBb, SBc) for barred galaxies were used. Intermediate types like Sab, Sbc… have been disregarded. We often selected the type SA0/a to describe an SA0 (or SB0) seemingly surrounded by tightly wound spiral arms or, as usual, doubtful objects at the S0-Sa limit. Dwarf early-type galaxies are classified dE, dS0, Ec, where the latter class is for compact objects of the M32 type. For late-type dwarfs Sm and Im were used, plus a single Sdm. Part of our Sm objects might have possibly been classified Sd by others.
In classifying faint objects, it was found useful to look at both the B and V frames simultaneously because the characteristics features of spirals, i.e. massive dust and young stars systems, have more contrast in B. On the other hand, far-away E/S0 look distinctly brighter in V, while cluster dE look alike in both bands. To view the images a color look-up table of the MIDAS system was used, which displays isophotal contours well. This helps to detect diskyness in E or S0, bars in S0 or Sa, and, departures of symmetry revealing of blurred spiral structure for distant objects.
Several controls were made of our classification:
-
•
Since two widely overlapping frames are needed to cover the studied portion of the cluster, independent classifications can be obtained for a subsample of 64 bright objects. Our first attempt showed poor self-consistency, but a more stringent application of the available criteria brought notable improvements.
-
•
We classified 27 Virgo cluster spiral galaxies from DSS2 frames, having practically the same scale in kpc/pix as the CFH12K frames, although with a slightly broader PSF. Our types disagree with the Binggeli et al. catalog by one stage of the spiral sequence in 3 cases, and by two stages in one case. There are two contradictions as regards the occurrence of a bar.
-
•
We inspected F475W (i.e. approximately B) HST images taken with the Advanced Camera for Surveys for a dozen of dwarf objects, confirming the previously adopted types in all cases.
-
•
The morphological classification of Coma cluster galaxies has previously been restricted to bright objects. Andreon & Davoust (1997) compare all classifications then available. A subsample of 56 relatively bright objects ( mag) is available for comparison of the present work with Andreon et al. (1997). There are only a few contradictions: 2 changes of E against S0, 3 of Sa against S0. We also missed two bars seen in the earlier work. It is gratifying to find such good agreement in the separation of S0 from E, since in Andreon (loc. cit.), this was based on a quantitative photometric analysis.
-
•
Among the 247 galaxies classified by Dressler (1980) in a Coma cluster field of 2.1 sq.deg., we found coincidences with 124 objects on our list of cluster members in the much smaller field of the CFHT camera. Dressler’s objects are relatively bright galaxies: B objects are very scarce. There are notable differences between the present system of classification and the one of Dressler. In our work, the adopted type tends to be a later one because we shifted 29% of Dressler’s E to S0, 33% of his S0 to S0/a, half his S0/a to Sa, most of his very rare Sa to Sb. We only agree for the late spirals. These systematic differences are not too surprising, since the morphological classification is a matter of personal application of rather loose criteria. Morphologies in the seminal work by Dressler (1980) shows systematics with respect not only to ours, but also to Andreon et al. (1996, 1997) and others (see Andreon & Davoust 1997).
2.3 Membership from morphological appearance?
We attempted to classify fainter objects, up to the limit of the GMP catalog. An increasingly large proportion of these are distant giant galaxies, while the cluster members are dwarfs. One purpose of the classification then is to identify members that are too faint to have been included in the available redshift data.
2.3.1 Morphological criteria for faint-object membership
It is possible to guess whether a galaxy is a member of Coma or lies in the background thanks to a number of rather uncertain criteria. First, dwarf spirals do not exist, according to Sandage et al. (1985a). Typical spirals are then expected to disappear from the Coma population at a mag. Bright, far-away spirals appearing in the same magnitude range as faint spiral members are scarce because they lie at the bright end of the LF. Fainter and farther background spirals lose many of the features that allow a detailed classification in the 3 stages Sa, Sb, Sc. They can still be recognized, however, because the open spiral arms lead to an often asymmetric twist of the outer isophotal contours. Also, the abundance of dust results in a characteristic asymmetry along the minor axis. Therefore the morphology together with apparent size and brightness, gives a sufficient indication of the distance of a spiral to classify it as a member or background object.
Dwarfs galaxies in Coma should appear around B=18 and become the unique cluster population for . There is a morphological similarity between dE or dS0 objects in Coma and distant giant E/S0’s, but the latter appear more sharply bounded and generally have a smaller linear diameter. In ambiguous cases, we did not hesitate to bring colors to the rescue as a final test, since distant E/S0 galaxies are generally strongly K-reddened.
2.3.2 Morphology assigned membership against redshift data
The values remain the primary indicators of cluster membership, even if we tried to supplement these by considering forms, apparent size and eventually colors. Our two main sources of data were a query in NED and a compilation provided by Biviano (see Adami et al. 2005). We also consulted original sources (Colless & Dunn, 1996; Castander et al., 2001; Mobasher et al., 2001; Rines et al., 2003). The objects were classified without knowing their redshift, which were incorporated afterwards in to the tables of results. Generally, there was agreement between the morphology-based and redshift-based membership assignations with only a few conflicts. The redshift-based indication was generally preferred. We should, however, mention the cases of GMP2943, 3038, 3131, 3258, 3336, 3353, and 3615 with strongly conflicting in the available sources: the value compatible with the morphology was then adopted in these 7 cases. For the 9 objects GMP2353, 2605, 4364, 2412, 2422, 3370, 3563, 4108, and 4424, the available seemed incompatible with the morphology, apparent size, and color, the redshift-based assignation was then discarded. Of special interest are galaxies with , the usual inward limit for membership, none of these shows the expected aspect of a foreground galaxy! They were located in the cluster (GMP2293, 2633, 3262, 3275, 3633, 3780) or the background (GMP2538, 3583, 3642). According to the redshift analysis by Biviano et al. (1996), the close pair GMP3262-75 is part of a group in front of the cluster.
We emphasize that morphological-based memberships disagree with spectroscopical memberships 9 times, as much as various authors strongly disagree on the redshift of our galaxies (7 occurrences, listed above). The good agreement between morphology-based and spectroscopical-based membership testifies that our morphological membership can be trusted, at least for galaxies with reshift. The next section shows the good agreement for all galaxies, including those without a known redshift, by means of a statistical argument: the luminosity function.
2.3.3 A second test of morphology-based memberships
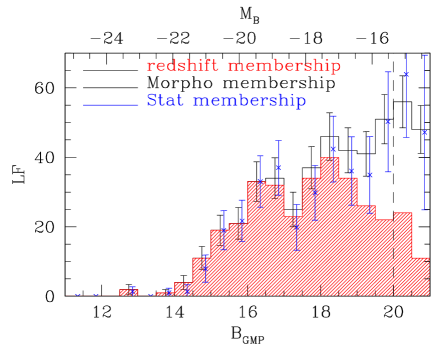
Figure 2 shows the B band luminosity functions of Coma galaxies in the studied region built in three different ways. First, we considered spectroscopically confirmed members. The spectroscopic sample is incomplete at , due to the lack of available redshifts for fainter and fainter objects. Second, we considered the sample formed by galaxies that are estimated to be members from their morphological appearance. Brigher than the spectroscopic completness limit, morphology-based and spectroscopic-based LF well agree (Fig 2).
Finally, we performed the usual statistical subtraction of background/foreground galaxies using a control field. Still using the GMP catalog we adopt an annulus between 1.0 and 1.3 degrees as control field. We only considered galaxies bluer than BR=2.0 mag, in order to reduce the contribution of background objects without affecting the members contribution, because galaxies at the Coma distance have BR mag. This annulus is too close to the cluster, i.e. is contaminated by its galaxies. The main effect of taking too near a control field is to reduce the luminosity function by a multiplicative factor without affecting its shape too much (Paolillo et al. 2001). This multiplicative factor can be found by asking that the statistically derived number of Coma galaxies brighter than B=16.75 mag be equal to the number of spectroscopy-based memberships, and it turns out to be 1.3. The LF of Coma galaxies computed from the morphological membership (solid line histogram) appears to be indistinguishable from the one obtained by the statistical method (blue data points). The above holds true both at the bright end (B mag), where by construction the integral of the two LFs are forced to be equal, but also at B mag where the two derivations are independent. Towards the faint end of the sample, where spectroscopic information is typically available for 50 % or less of the galaxies, the morphological approach possibly recovers all the members counted in the statistical approach. The above comparison, summarized in Fig. 2, shows that our extended list of members is statistically correct. It has the same level of completeness as the GMP catalog, which is the source of both our morphology and of the two samples involved in the statistical derivation of the LF. According to the authors, the GMP is nearly complete up to mag, but is only 50% complete one magnitude fainter.
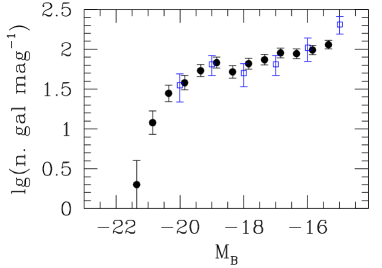
A similar experiment is repeated in Fig. 3, but using independent deeper CCD photometry (Andreon & Cuillandre 2002), no color-selection at all, and a control field unaffected by Coma galaxies, and leads to the same conclusion. Estimating the membership from the morphological appearance is feasible, not only for nearby clusters such as Virgo, but even at the distance of Coma, although the criteria cannot be the same. In this comparision, the compared sample is complete down to some two magnitude deeper. The found good agreement between morphology-derived and statistically-derived LFs extends our conclusion that morphological membership can be trusted to galaxies without a known redshift, down to mag.
| Data | Virgo | Coma0 | Coma1 | Coma2 | Coma3 |
|---|---|---|---|---|---|
| cD | 0 | 2 | 2 | 0 | 0 |
| E | 20 | 37 | 15 | 10 | 12 |
| E/S0 | 6 | 11 | 6 | 3 | 2 |
| S0 | 40 | 61 | 29 | 16 | 16 |
| S0/a | 7 | 43 | 15 | 20 | 8 |
| Sa | 26 | 56 | 21 | 15 | 20 |
| Sb | 13 | 24 | 4 | 11 | 9 |
| Sc | 62 | 7 | 0 | 1 | 6 |
| giants | 174 | 241 | 93 | 75 | 73 |
| Ec | 1 | 13 | 10 | 2 | 1 |
| dE | 224 | 129 | 49 | 45 | 35 |
| dS0 | 28 | 43 | 12 | 15 | 16 |
| dlat | 87 | 47 | 21 | 12 | 14 |
| dwarfs | 340 | 232 | 92 | 74 | 66 |
The Table gives the counts of the various Hubble types in the 5 samples. dlat refers the late-type dwarfs Sd, Sdm, Sm, Im. Partial sums are also given for the ”giant” and ”dwarf” galaxies respectively.
3 Presentation of the data
-
1.
The morphology and membership catalogs: Table E1, available at CDS and at the link http://www.brera.inaf.it/utenti/andreon/E1, lists 1155 entries containing: (1) the number of the object in the GMP catalog ( for the first entry, a galaxy missing in the GMP); (2) and (3) GMP coordinates; (4) GMP B-magnitude; (5) GMP BR color; (6) adopted redshift among available measurements, see Sect 2.3.2; (7) estimated Hubble type; (8) adopted membership, for members or for background objects; (9) Notes: for blend i.e. strongly overlapping objects; doubtful location; possibly interacting pair; strongly inclined; too faint to classify; technical problem (CCD defects, bright star too close, image cut by CCD edge, etc.). Incomplete information are replaced by dots. For instance … deals with an unclassified object; S.. is a spiral of indeterminate class; S.0 might be either an SA0 or SB0.
In Table E1, 473 galaxies are classified as Coma members, of which 343 have measured redshifts. Membership is, by its nature, probabilistic: i.e. there is (almost) never absolute certainty that a galaxy is a cluster member, yet galaxies have been put into one of the two classes: member or non-member. Therefore, any analysis of our morphological membership flags should take into account that a handful of galaxies may have a wrong membership and consequently may have inappropriate properties for Coma members, for example to be an outlier in a color-magnitude diagram. This nuisance is positively offset by the advantage of an individual correct classification for the very large majority of the sample, because galaxy properties (say color distributions) can be studied without the need to account for background contamination and to do so with good precision, because the abundant background population is almost completely filtered out by our morphological membership. An example is given in our analysis (Andreon & Michard, 2008, in preparation) of the color-magnitude relation, using an outlier-tolerant Student distribution in place of a Gaussian.
-
2.
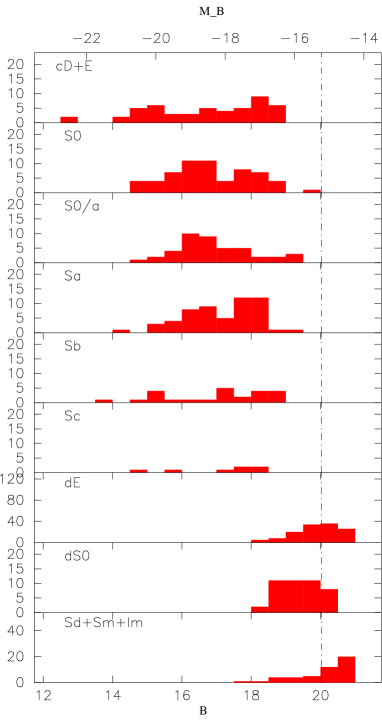
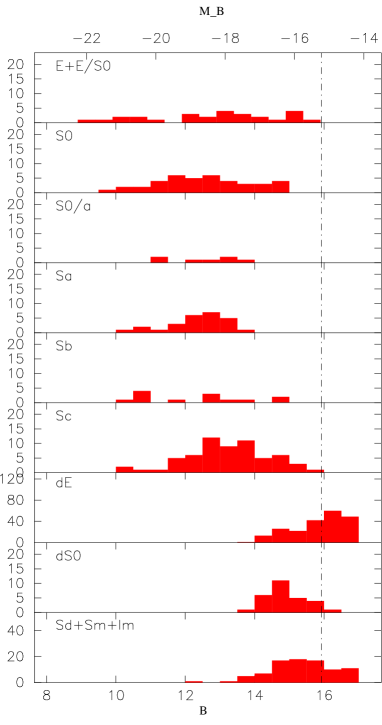
Histograms of luminosity for the various Hubble-type. Figures 4 and 5 show the LF of each morphological type in Coma and Virgo, respectively. The order of presentation is the order of the Hubble sequence from cD, normal E, through S0, and spiral stages Sa to Sc, and then the dwarfs dE’s, dS0’s, dlate (i.e. Sd, Sm, Im). The compact dwarfs Ec are not entered here because of the uncertainty of their classification. For the first time, the morphological classification of Coma galaxies reaches magnitudes that are faint enough to observe complete samples of the giant types, E, S0, and spiral stages. The corresponding histograms are limited at both the bright and faint ends of the distributions. We also observed a significant part of the dwarf types populations, whose brightest objects are at and extend to , our sample being complete about 1 mag brighter.
-
3.
Sample sizes. Table 1 collects the number of the Coma (and Virgo for comparison) members of each each morphological type: our full sample termed Coma0 and three subsamples of increasing distances to the cluster center, termed Coma1, Coma2, and Coma3. Coma1 refers to the core of the cluster, i.e. a circle of radius around the conventional GMP center; Coma2 is a concentric ring of 16.67 outer radius; Coma3 is the rest of the field around Coma2, as shown in Fig. 1. Our Coma0 sample is larger than the Virgo sample for giant types earlier than Sc.
-
4.
The spiral stages in Coma and Virgo. The population balance between the 3 spiral stages drastically changes between the two clusters, as seen in Table 1 or Figs. 4 and 5. In our Coma sample there are twice more Sa than in Virgo, but there are 12 times less Sc. The combined population Sb+Sc is thrice less important in Coma than in Virgo. Andreon & Michard (2008, in preparation) will further quantify the subject. Our results are in line with the the morphology-density relation but with an hitherto undetected difference in the segregation of the various spiral stages, because in previous works (e.g. Dressler 1980; Andreon, 1996; Whitmore et al., 1993), the distinction between the successive spiral stages could not be made and samples were limited to bright galaxies.
-
5.
Auxillary UV catalogs The above morphological data has been completed by Vt, UV catalogs from Terlevich et al. (2001, TCB01), who give U and V magnitudes within several apertures, 8.8 to . The color listed in our Table E2 is the mean color, averaged over all the available apertures within a maximal radius increasing with galaxy luminosity to account for the larger size of brighter galaxies. Due to the integrated nature of aperture colors and the large size of the adopted apertures, color gradients present in regions of low surface brightness outside the largest aperture minimally affect the measured value, because we have already integrated most of the galaxy flux. For E+S0 giants, the UV here derived agree with the Bower et al. (1992) (BLE92) values, fully corrected for K-effect and galactic absorption, and also with the data for 20 objects in common with Prugniel & Simien (1996). For 43 objects we find a mean mag with mag. Random errors assumed equal for both sets have mag in the range V mag. No such comparisons are feasible for fainter objects.
The “total” magnitudes listed in Table E2 were computed in two steps. First, we started from the aperture magnitude in the largest aperture used for the color measurement. For dwarf galaxies, which are smaller than the aperture, this is also the final color. Brighter objects, in practice giant galaxies, are truncated even in the largest aperture available from Terlevich et al. (2001), 26 arcsec. We obtained corrections for this effect from comparisons with V26 of Lobo et al. (1997) and the V in BLE92. For the cD, we adopted the R magnitudes of Andreon et al. (1996) with a shift VR =0.60 mag. Our final Vt scale coincides for giant E+S0 galaxies (after excluding these two cD’s) with the one of BLE92 (mean difference of -0.013 mag and mag). This may suggest a mean error of 0.15 mag in both sets. Our sample of Coma members with Hubble-types and UV colors numbers 314 galaxies, 60 % of which are giants and 40 % dwarfs. This is a subsample extracted from the list of GMP members defined above: the faint objects measured in TCB01 but not in the GMP were examined but rejected as probably in the background. Table E2, available at CDS and at the link http://www.brera.inaf.it/utenti/andreon/E2, lists for the 314 members: (1) Terlevich et al. identification number; (2) the number of the object in the GMP catalog; (4) and (5) GMP coordinates; (6) aperture corrected ; (7) error, rounded to two digits from mag values listed in Terlevich et al.; (8) aperture corrected ; (9) error, rounded to two digits from mag values listed in Terlevich et al.; (10) adopted redshift among available measurements; (11) estimated Hubble type; (12) membership.
4 Summary of results and highlights of forthcoming papers
A catalog of morphological types were obtained for 1155 objects in the Coma clusterfield, and memberships estimated from their appearance, i.e. morphology, surface brightness, rarely color, and, aftewards, redshifts. Four hundred seventy-three cluster members were identified, and it has been shown that our memberships can be trusted both when individual redshifts are available (Sect. 2.3.2), and when membership is only known in a statistical sense (Sect. 2.3.3). We obtained from the literature Vt/UV data for 2/3 of our Coma members and corrected them for aperture effects.
For the first time, the morphological classification of Coma galaxies reaches magnitudes faint enough to observe the full magnitude range of the giant types, E, S0, and spiral stages. Tables with morphological types, membership, and U-V colors are given. Our sample is the richest environment where membership and morphology for complete samples down to faint magnitudes ( mag) are available, thereby enlarging the baseline of environmental studies.
Some new results will be presented in detail in future papers. a) Dwarf galaxies are more abundant in Virgo than in Coma. b) It appears that late-type dwarfs in Coma are less numerous, less bright, and less active in star formation than in Virgo; c) We derived LF parameters of the giant galaxies in Coma, distinguishing between various Hubble-types and covering the full luminosity range for each type. This has not been possible up to now, except for the Virgo cluster in the classical work of Sandage et al. (1985), which we follow closely in our study. The LF of dwarfs can also be studied paying the necessary attention to sample incompleteness.
Acknowledgements.
We thank Drs. Adami, Biviano, and Durret for their help in gathering useful data.References
- (1) Adami C., Biviano A, Durret F. et al., 2005, A&A 443, 17
- (2) Adami C., Picat J.P., Savine C. et al., 2006, A&A 451, 1159
- (3) Aguerri J.A.L., Iglesias-Pramo, J., Vilchez, J.M. et al. 2004, AJ 127, 1344
- Andreon (1996) Andreon, S. 1996, A&A, 314, 763
- Andreon & Davoust (1997) Andreon, S., & Davoust, E. 1997, A&A, 319, 747
- (6) Andreon S., Davoust E., Michard R. et al., 1996, A&AS 116, 429
- (7) Andreon S., Davoust E., Poulain P., 1997, A&AS 126, 67
- (8) Andreon S., Cuillandre J.C., 2002, ApJ 569, 144
- Binggeli et al. (2000) Binggeli, B. & Huchra, J. 2000, Encyclopedia of Astronomy and Astrophysics
- (10) Binggeli B., Sandage A., Tammann G.A., 1985, AJ 90, 1681 (BST2)
- Binggeli et al. (1993) Binggeli, B., Popescu, C. C., & Tammann, G. A. 1993, A&AS, 98, 275
- (12) Biviano A., Durret F., Gerbal D. et al., 1996, A&A 311, 95
- (13) Bower R.G., Lusey J.R., Ellis R.S. 1992, MNRAS 254, 601 (BLE92)
- (14) Buta R., 2000, Encyclopedia of Astronomy and Astrophysics
- (15) Castander F.J., Nichol F.C., Merrelli A. et al., 2001, AJ 121, 2331
- (16) Colless M., Dunn A.M., 1996, ApJ 438, 435
- (17) Colless M., 2000, Encycl. Astr. Astrophys. 2000
- (18) Dressler A., 1980a, ApJS 42, 565
- (19) Dressler A., 1980b, ApJ 236, 351
- Ferrarese et al. (1996) Ferrarese, L., et al. 1996, ApJ, 464, 568
- (21) Godwin J.G., Metcalfe N., Peach J.V., 1983, MNRAS 202, 113 (GMP)
- (22) Guttierez C.M., Trujillo I., Aguerri, J.A.L. 2004, ApJ 602, 664
- Jorgensen & Franx (1994) Jorgensen, I., & Franx, M. 1994, ApJ, 433, 553
- (24) Lobo C., Biviano A., Durret F. et al.,1997, A&AS 122, 409
- (25) Michard R., 1995, ApL&C 31, 187
- (26) Mobasher B., Bridges T.J., Carter D. et al., 2001, ApJS 137, 279
- (27) Paolillo, M., Andreon, S., Longo, G. et al., 2001, A&A 367, 549
- (28) Prugniel P., Simien F., 1996, A&A 309, 749
- (29) Rines K., Geller M.J., Kurz M.J. et al., 2003, AJ 126, 2152
- (30) Sandage A., Binggeli B., 1984, AJ 89, 919 (Paper III)
- (31) Sandage A., Binggeli B, Tammann G.A., 1985a, AJ 90, 395 (Paper IV)
- (32) Sandage A., Binggeli B, Tammann G.A., 1985b, AJ 90, 1759 (Paper V)
- (33) Sandage A.,2005, ARA&A 43, 581
- (34) Terlevich A.I., Caldwell R., Bower R.G., 2001, MNRAS 326, 1547 (TCB01)
- (35) Whitmore B.C., Gilmore D.M.,Jones C., 1993, ApJ 407, 489