Information transmission in oscillatory
neural activity
Abstract
Periodic neural activity not locked to the stimulus or to motor responses is usually ignored. Here, we present new tools for modeling and quantifying the information transmission based on periodic neural activity that occurs with quasi-random phase relative to the stimulus. We propose a model to reproduce characteristic features of oscillatory spike trains, such as histograms of inter-spike intervals and phase locking of spikes to an oscillatory influence. The proposed model is based on an inhomogeneous Gamma process governed by a density function that is a product of the usual stimulus-dependent rate and a quasi-periodic function. Further, we present an analysis method generalizing the direct method [RWvSB99, BSK+00] to assess the information content in such data. We demonstrate these tools on recordings from relay cells in the lateral geniculate nucleus of the cat.
1 Introduction
Oscillatory activity is ubiquitous in the brain, manifesting itself on a macroscopic level in EEG and MEG recordings as “brain waves” and on the level of single neurons in micro-electrode recordings as periodic spike patterns. There are different forms of oscillations. Traditionally one distinguishes oscillations that co-occur with a behavioral condition such as sensory stimulation from ongoing oscillations that are spontaneous, that is, present independently of the behavioral condition. When co-occurring with stimulation, two different types of oscillations have been discerned: Stimulus-evoked oscillations are phase-locked to the stimulus, that is, the phase of the periodicity in neural activity can be reproduced by repeating the same stimulus. In contrast, in stimulus-induced oscillations the phase is variable with respect to the stimulus and cannot be predicted from one stimulus trial to the next.
In various sensory systems, it has been shown that neural oscillations that co-occur with stimulation play an important role for the coding of sensory information. Examples are the olfactory system in species ranging from insects to mammals [Adr42, Fre72, GT90, LD94], the whisker system in rats [SBA03] and the somatosensory system in primates [AV90]. The motivation for our present study is the question whether oscillations that are spontaneous or not phase-locked to the stimulus can have roles in information coding and transmission. This is conceivable since ongoing or non-stimulus-locked oscillations could still be influenced by the stimulus and thereby carry stimulus information. However, to date, this question has not been satisfactory addressed. For example, consider the visual system. Over the last four decades, numerous studies of various vertebrate species have reported oscillatory activity in the early visual system [HB66, LV67, Rod67, NS96, CBNS98, IGHT05, MRM+08]. These oscillations are sometimes stimulus-evoked but often spontaneous. The question of whether they are systematically influenced by the visual stimulus and what their functional role could be, has been subject of controversy and is still not resolved. One difficulty with addressing this question is the lack of applicable models and analysis tools. To fill this gap, we propose two new theoretical tools for studying the function of oscillatory activity: A spiking neuron model that reproduces the characteristic statistical properties of oscillatory neurons and a method to quantify the information of oscillatory spike trains even in the absence of stimulus-locking.
One possibility how ongoing oscillations can be used to convey stimulus information is in phase coding schemes, in which relative phases encode information. A prominent example is phase coding of spatial location by place cells in rat hippocampus. The spike phase relative to theta oscillations in the EEG encodes additional information about the location of the rat [OR93]. Another example for phase coding was reported in the visual system. [NS96] have found that spatially extended light stimuli can synchronize the ongoing oscillatory activities in retinal ganglion cells and that this synchronization is transmitted by LGN neurons. Information encoded in phases of ongoing oscillations in synaptic input could be used by neurons in various ways: it could be recoded, transformed, or, like in the LGN cells mentioned, it could simply be preserved in the spike train and thus be used to transmit information to the next processing stage downstream. Here we concentrate on investigating the role of ongoing oscillations in information transmission by asking how a neuron’s spike train can capture the phase of an oscillatory trend in its synaptic input. The methods we will describe are general in that they examine a necessary condition that observed ongoing oscillations can have a role in transmitting information, independent of the coding scheme and of knowing what information is transmitted.
Specifically, our aim is to model and measure how information in oscillation phases can be transmitted by a single neuron and how this transmission can coexist with information transmission utilizing spike rate. As will be shown in a model, the two information channels do not interfere and can be used to multiplex information if the oscillations are on a faster time scale than the rate modulations. Further, we introduce a method to quantify the additional information encoded in the second channel. If this additional information is insignificant, the role in information transmission can be ruled out. Importantly, however, a positive result hints to a functional role of the ongoing oscillations and encourages further investigations addressing what specific coding scheme is employed and what stimulus information is encoded. Thus, our method is a first step in assessing the functional significance of ongoing oscillations and it can be applied, even if it is unknown what kind of information is encoded.
We applied our new tools to recordings from relay cells in the lateral geniculate nucleus (LGN) of cat from the lab of Judith Hirsch, USC. Whole-cell recordings in vivo were used to record retinal excitatory postsynaptic potentials (EPSPs) and the spikes they evoke in response to naturalistic stimuli (movie sequences of 30s length). Cluster analysis of the intracellular signal allowed us to label excitatory synaptic inputs (EPSPs) in the intracellular signal and to separate these from spikes (for detailed methods of experiments and clustering, see Wang et al. 2007, Koepsell et al. 2008). Thus, the data we use in this paper consist of pairs of spike trains for each geniculate relay cell, the train of spikes produced by the relay cell and the train of presynaptic spikes produced in the retinal ganglion cell(s) projecting to the relay cell. Our method reveals additional information that is not captured in the classical rate-coding paradigm. Remarkably, the amount of additional information is commensurate with the rate-coded information and can in some cases even surmount it.
The paper is outlined as follows: To make the paper self-contained, Section 2 briefly revisits point process models for spike trains. In Section 3, a model is presented for reproducing the periodicity observed in measured neural spike trains. In Section 4, an information theoretical approach is described to measure information in oscillatory activity. In Section 5, we fit the parameters of the model to reliably reproduce the properties of periodic spike trains from cells recorded in LGN. Furthermore, we quantify the information rates in spike trains with oscillations. Finally, in Section 6 we discuss possible interpretations of the results from the information theoretic analysis regarding potential computational functions of the oscillations in retina and LGN.
2 Point process models for spike trains
In this section, we review the use of point processes in order to model a sequence of action potentials or spikes. Each spike is an impulse of about one millisecond duration with a stereotyped shape [HH52]. Thus, we can characterize the activity of a neuron by its spike train, the set of time points at which the spikes occur.
2.1 Homogeneous point processes
The simplest case is when spikes are described as homogeneous Poisson processes, that is, point processes that occur independently with a probability density or rate that is constant in time. If the time axis is divided into small bins , the probability of a spike in any of the time bins is . The observation of an inter-event interval relies on the conjunction of a spike occurring in the time bin at and the “survival” of a preceding empty interval of length . The survival probability of the spike-free interval is given by the joint probability that neither of its time bins contains a spike. Thus, the probability of an inter-spike interval is given by the product of probabilities of independent events, which can be approximated by the exponential distribution:
| (1) |
This approximation is valid for and and becomes exact for .
One can also compute the interval distribution between event pairs in a train of independent spikes that are not directly consecutive but have k-1 spikes in between, which leads to the Gamma distribution with shape parameter :
| (2) |
where is the Gamma function. If the shape factor in the Gamma distribution is an integer, it is an Erlang distribution. Note that the Gamma distribution describes the interval density in a subsampled Poisson process consisting of every -th spike. Therefore, the Gamma distribution for reduces to the exponential distribution. However, as becomes larger than one, the shape of the distribution changes qualitatively: Whereas the exponential distribution decreases monotonically with increasing interval size, the Gamma distribution for is maximal for a certain intermediate interval length.
It has been known for some time that the Gamma distribution matches inter-spike-interval (ISI) distributions of real spike trains in response to stationary stimuli much better than a exponential distribution [KFB57, PGM67]. Further, it has been shown that the Erlang probability density describes the ISI distribution of a non-leaky stochastic integrate and fire model with a fixed threshold that is driven by excitatory Poisson inputs with constant rate [Tuc88]. However, one should add that the absence of short intervals in real spike trains is caused by the neuronal refractory period, a short-lived history effect that prevents a spike from being generated briefly after another spike. For the sake of simplicity we will resort in the reminder to the use of Gamma distributions although explicit modeling of the refractory period should yield subtle differences. For example, the Gamma process eliminates leading and trailing spikes of short intervals with equal probability whereas modeling the refractory period should preferentially remove, or suppress, the trailing spike.
2.2 Inhomogeneous Gamma process
Whereas the spike rate of the homogeneous point process is constant, the firing rate of a neuron is generally a function of time, . Changes in firing rate reflect changes in the stimulus, as well as other time dependent influences on the neuron. Rate changes that are systematic and reproducible are informative for understanding what the neuronal activity is encoding. Equation (2) can be generalized to describe the probability density of the inhomogeneous Gamma process [BQF+01]
| (3) |
where is the probability of a spike interval given that the last spike was at time . To model an actual spike train, the function has to be estimated. In principle, this can be done by low-pass filtering of the raw spike train. However, on single spike trains this estimate is noisy and thus it is hard to separate systematic rate changes from estimation errors and noise fluctuations. In the next section we describe experimental designs and methods for using equation (3) to model spike trains that are not only influenced by a time-dependent stimulus but also by an oscillatory trend.
3 Modeling systematic structure in spike trains
Here, we model two different types of systematic structure in spike trains, stimulus-locked rate changes and autocorrelative structure such as periodicities in the firing rate. Both structures can be superimposed in inhomogeneous spike trains, and both can potentially contribute to the neural code.
3.1 Modeling spike trains with stimulus-dependent rate modulation
To track systematic rate changes that are locked to the stimulus , one typically chooses experimental designs with repetitions of the same stimulus. Then one can average the spike train over stimulus repeats to form the post-stimulus time histogram (PSTH), . Using optimization techniques, such as adaptive kernel estimation [ROS90], one can find the best parameters for the low-pass filter to estimate from the PSTH . For a given number of repeats, the power of and the inter-trial variability can be estimated as described in [SL03].
To model a spike train with stimulus-locked rate modulation one first has to estimate the trial-averaged rate from the PSTH and the mean rate . Next, the time is rescaled with
| (4) |
in order to obtain a constant rate [BBV+02]. Finally, the rescaled distribution of inter-spike intervals from the experiment can be fitted by a homogeneous Gamma distribution (2) with fixed rate [KFB57]. The shape parameter is determined from the moments (mean and variance ) of the empirical rescaled ISI distribution as: , see [BFK57, BQF+01].
3.2 Modeling oscillatory rate modulation
Stimulus-locked oscillatory structure is preserved by trial averaging and therefore directly reflected in the PSTH. Thus, the oscillatory spike rate can be obtained from trial averaging and used to model the spike train, just as described in the previous subsection. However, neural oscillations that are not stimulus-locked have to be modeled differently since they average out across multiple stimulus repetitions and are therefore not captured in the PSTH. In the reminder we describe how to detect and quantify such oscillations and ultimately, how to model the spike trains.
3.2.1 Detecting and quantifying oscillations
Neural oscillations have been assessed in the time domain based on autocorrelograms and inter-spike-interval (ISI) histograms. If stable oscillations are present, a modulated autocorrelogram reflects the periodic structure and also the ISI histogram becomes multi-peaked [HB66, OBL66, MHKS84, CBNS98]. Alternatively, spectral methods have been developed. Because spectral power estimates based on the plain Fourier transform of spike trains are quite noisy, multi-taper methods have been applied to improve the accuracy of detecting and characterizing peaks in the power spectrum [JM01]. Recently, the oscillation score (OS) has been proposed which exploits structure in time and frequency domain [MJM+08]. To compute the oscillation score, the autocorrelogram is first filtered and the central peak is removed (since it is not indicative of oscillatory structure). Next, the result is Fourier transformed and the peak frequency is detected in the spectrum. Finally, the oscillation score is defined as the ratio between peak height and baseline in the spectrum. The oscillation score is a reliable indicator for oscillatory trends because it is insensitive to confounding factors, such as refractory effects and bursts.
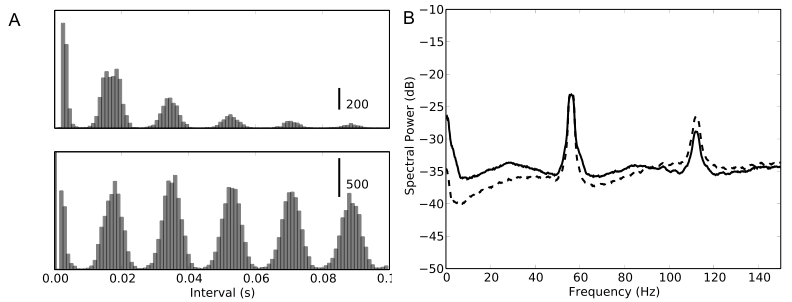
Fig. 1 displays autocorrelograms and ISI histograms for relay cells of the lateral geniculate nucleus of the cat during visual stimulation with natural stimuli. As one can see, for this cell the oscillations are prominent according to either of the described criteria. The timings of synaptic inputs (EPSPs) of this cell are shown in Fig. 2A together with the spikes they evoke (Fig. 2B). The cell belongs to a subset of relay cells in the LGN with oscillatory spike trains that otherwise behave quite regularly, having the usual center-surround receptive fields and refractory periods of about one millisecond (see upper panels), see [KWV+08] for more details.
3.2.2 Estimating oscillation amplitude and phase
To model the periodic structure of the spike train induced by afferent inputs to the neuron, the instantaneous oscillation phase in the input has to be estimated for each point in time (see Fig. 2). For LGN cells it known that the synaptic inputs can exhibit periodicity originating from the retina [HB66, OBL66, Rod67, CBNS98]. The LGN recordings we analyze here are in vivo whole-cell recordings and we can extract the train of excitatory postsynaptic potentials (EPSPs) –the input spike train– from the measured membrane potential.
To determine the instantaneous phase of the input oscillation of an LGN cell we compute the complex analytic signal of the input spike train (EPSPs)
| (5) |
by convolving the EPSP train with a complex Morlet wavelet (inset of Fig. 2A)
| (6) |
centered at a frequency with temporal width and normalization factor C. The amplitude of the analytic signal corresponds to the local power in the frequency band centered at with bandwidth .
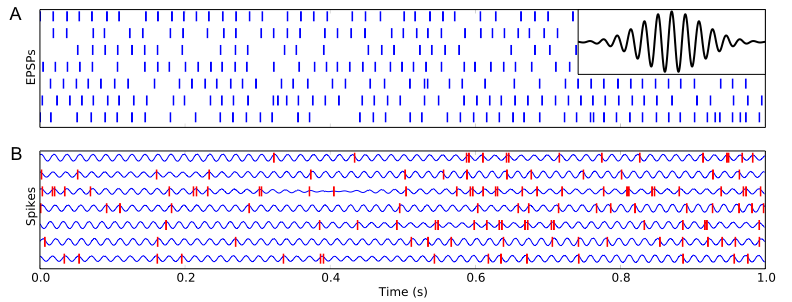
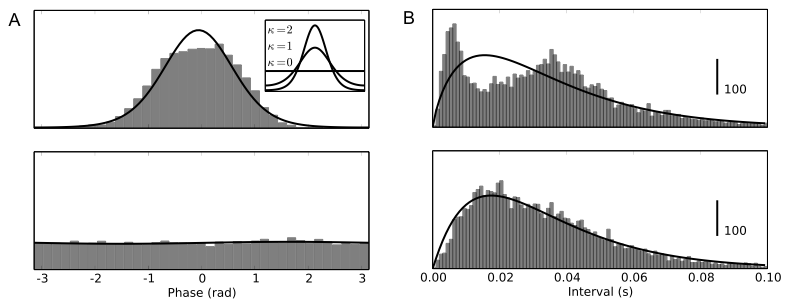
The angle of the analytic signal defines the instantaneous phase of the input oscillation. To assess the influence of the input oscillation on the LGN spike train, we measure how the spikes are distributed over the phase of the input oscillation (see Fig. 2B). The top panel in Fig. 3A shows that the resulting phase histogram is peaked, that is, the spikes are more likely to occur at a certain phase in the input oscillation. If one uses the input phase from another trial to form the phase histogram of spikes (shift predictor), the resulting histogram shown in the bottom panel of Fig. 3A is flat, indicating that the input oscillation is not locked to the stimulus. To determine the optimal frequency for this analysis we used the frequency determined from the oscillation score measurement (see Section 3.2.1). To quantify the spike locking to the input oscillation, the phase histogram is fitted with a von Mises (or cyclic Gaussian) distribution
| (7) |
The mean phase is computed from circular mean of the spike phase distribution
| (8) |
The concentration parameter is obtained by numerical solution of the equation
| (9) |
where and are the modified Bessel functions of zeroth and first order. The concentration parameter is a measure of phase locking; the phase distribution becomes uniform for and approaches a Gaussian distribution with standard deviation for large , see inset in Fig. 3A. The phase concentration is often characterized by the circular variance
| (10) |
which assumes values between zero and one. The circular variance is related to the concentration parameter by . The von Mises Distribution is the maximum entropy distribution for a given circular mean and variance.
3.2.3 The quasi-periodic gamma model
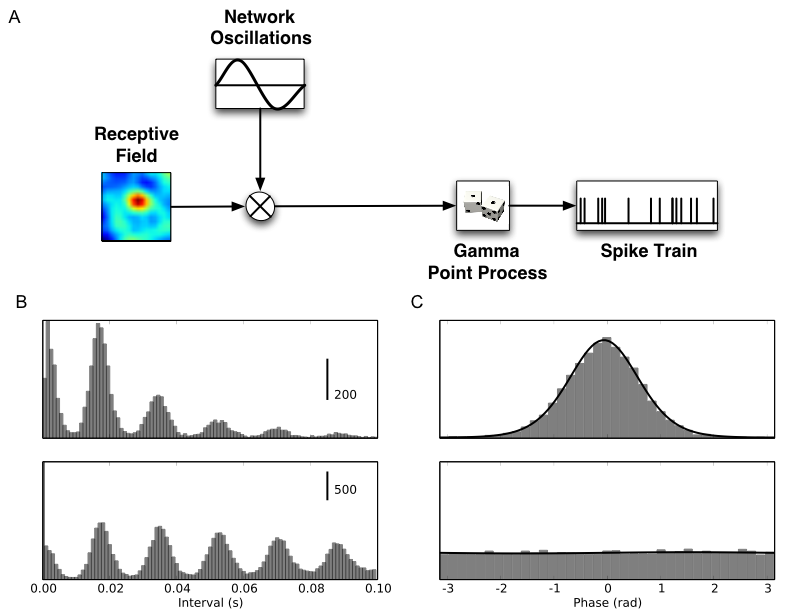
To understand the effect of the combination of stimulus-dependent rate modulation and the influence of input oscillations that are not locked to the stimulus, we devised a simple model to include both effects, the quasi-periodic gamma (QPG) model (Fig. 4A). It describes spike generation by an inhomogeneous Gamma process (3) with a factorial instantaneous rate given by the product
| (11) |
The first factor is the stimulus-locked rate determined as described in Section 3.1. The second factor is a von Mises distribution describing the periodic modulation that can be fit to data as described in Section 3.2.2. In order to get independent estimates of stimulus-locked and periodic modulations, it is important that the oscillations have a higher frequency than the frequency content of the stimulus-locked modulation. For LGN cells in cat these two frequency bands are well separated, since the stimulus signal rolls off at frequencies well below the ones of the observed oscillations in the gamma frequency band (40-80 Hz). In the following, we use the phase of a random band-pass signal with frequency . In total, the QPG model has the five free parameters: . In general, however, the instantaneous phase of the periodic activity may be a function of the stimulus. The relations between the described QPG model and previous models will be considered in the discussion section.
4 Information in oscillatory spike trains
In this section we describe how the information content in oscillatory spike trains can be estimated. Various methods have been developed for estimating information rates of neural responses, e.g. [EP75, RWvSB99], for an overview, see Ref. [BT99]. Most of these methods depend on certain properties of the statistics of signal and noise in the stimulus as well as in the neural response, for example many models assume Gaussianity. Here, we apply the direct method which is applicable to signals with arbitrary statistics to the QPG model of Section 3.2.3.
4.1 Direct method
The direct method [RWvSB99, BSK+00] estimates the mutual information between an event in the neural response and a time-varying stimulus . If the information is conveyed by single occurrences of event (and not temporal patterns), the information per event is given by
| (12) |
If the distribution of event is uniform during the trial , that is, , the unconditional entropy is simply . is the conditional entropy of the event , given a time-varying stimulus :
| (13) | |||||
If the stimulus is rich enough, the ensemble average over stimuli and the time average over the stimulus are equivalent [BSK+00] and thus the former can be omitted in equation (13).
The conditional distribution of spikes can be estimated empirically by recording neural responses to repeats of the stimulus and forming the PSTH (see Section 3.1). The conditional distribution is then given as . Thus, each spike transmits the information [BSK+00]:
| (14) |
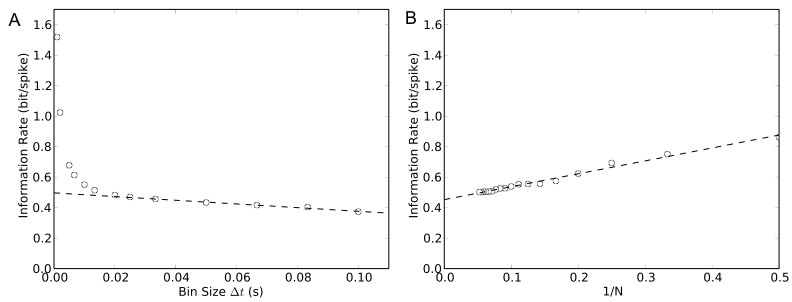
The accuracy of the information rate estimated for finite data depends on the bin width used to compute the integral in equation (14). The estimate converges to the true entropy only asymptotically (limit of zero bin width and infinite number of trials). More specifically, narrow bin sizes with finite data lead to a pronounced overestimation of the amount of information transmitted. The circles in Fig. 5A show how for a data set with 20 trials the information is overestimated as the bin size decreases. The estimate is improved, however, by a linear extrapolation () of the values for larger bin size, Fig. 5A, dashed line. The resulting value is 0.50 bit/spike, see (see [BSK+00]). Extrapolating this result in addition to larger numbers of trials (N) also with a line () yielded 0.46 bit/spike (Fig. 5B, dashed curve).
4.2 The multiconditional direct method
In the following, we apply the direct method to the case of oscillations that are not locked to the stimulus. If an oscillation is present, the spike train contains information not only about the stimulus signal but also about the phase of the oscillatory trend. To quantify the contribution of the oscillation to the information rate, the two cases described in Section 1 have to be treated differently; stimulus-locked oscillations and oscillations that are not locked to the stimulus. Stimulus-locked oscillations are conveyed in the PSTH and therefore equation (14) can be used directly to estimate the mutual information in single spikes exerted by the stimulus and the oscillatory trend.
Oscillatory trends that are not locked to the stimulus are averaged out in the PSTH. Therefore the additional information about the oscillation cannot be measured by equation (14) 111But note that equation (14) can still be used to estimate the information in stimulus-locked rate modulation.. Here, we describe the multiconditional direct method that can measure information in oscillatory activity, even if not locked to the stimulus. We quantify the information that a spike conveys about both the stimulus and the phase of an oscillatory trend. Note that this is different from quantifying the stimulus information conveyed by a spike in a phase coding scheme, which would be (see Discussion).
The periodic trend function can be described by an instantaneous phase which increases monotonically with wrap-around condition . The phase is a quasi-periodic function in time with period : . The probability of a spike occuring at time now depends on both influences, the stimulus and the oscillatory trend function. At any moment in time , the joint influence is fully described by the stimulus and the current phase of the oscillatory trend . The conditional entropy that includes both influences can then be written:
| (15) | |||||
Here the same argument applies for dropping the ensemble average over the stimuli as in equation (13). In addition, we use the fact that the oscillations are not stimulus locked and therefore the instantaneous phase does not depend on the stimulus and all phases occur equally often: .
As before, the conditional distribution can be acquired empirically by recording neural responses during multiple repetitions of the stimulus . The response varies not only with the stimulus but also with the instantaneous oscillation phase . To capture both dependencies, an extended response histogram has to be collected. The stimulus can be parameterized by the relative stimulus time, just as in the standard PSTH. But because the oscillations are not stimulus-locked, the histogram requires a second dimension to represent the instantaneous phase . The extended response histogram contains the response binned by relative stimulus time and instantaneous phase . With proper normalization the conditional probability is given by: . The unconditional probability of a spike at time is with entropy as before.
Using equation (12) the multiconditional direct method can be formulated: The information per spike is given as:
| (16) |
One might ask, what the maximal amount of information is that could be encoded in the spike train this way. If the stimulus-locked rate and the periodic oscillations would encode information independently, which would be optimal, their respective contribution to the right hand side of formula (16) would be additive. The contributions from the oscillations is bounded by the negative entropy of the von Mises distribution
| (17) |
Thus, the upper bound of the total information rate of single spikes in oscillatory spike trains is given by
| (18) |
with the first term on the RHS obtained from (14) and the second term from (17). A deviation from this upper bound indicates mutual information between the phase and the rate signal which might be utilized for redundant encoding of information (see Discussion).
4.2.1 The phase de-jittering method
An alternative option to determine the information is a de-jittering method, proposed in Ref. [KWV+08], in order to measure the information carried by single spikes in trials with different values for the instantaneous phase of the oscillation in the inputs. Here, we shift the spikes by an amount corresponding to their oscillation phase in order to correct for the effect of different state of the input oscillation and subsequently measure the single-spike information using the direct method (14). This amounts to an oscillation-dependent rescaling of the time axis and effectively de-jitters the spike train.
This method relies on the fact that the stimulus-locked spike rate does not change on the time scale of the oscillations and therefore is not affected by the de-jittering. Even though this is only an approximation, the de-jittering method gives comparable estimates to the multiconditional direct method (16) and it has the advantage that it requires much less data to be feasible.
5 Model fitting and simulation experiments
In this section, we describe how to fit the QPG model to measured data and apply it to intracellular recordings of thalamic relay cells in cat LGN. We then use the QPG model to generate different types of surrogate data for testing and comparing the information theoretic measures described in Section 4.
5.1 Fitting the QPG model to LGN recordings
We fitted the five free parameters () of the model to match the data of the cell shown in Fig. 1A. Specifically, frequency and bandwidth of the oscillatory component was fitted to the oscillations measured in the input (train of EPSPs), the concentration and mean of the spike phases was fitted to the experimental phase histograms and the shape factor of the Gamma distribution was optimized to match the output spike train. The center frequency of the oscillation was set to the frequency determined by the oscillation score method (see [MJM+08] and Section 3.2.1) and for the bandwidth we chose Hz, corresponding to the width of the peak in the power spectrum (Fig. 1B) and a temporal width of ms. To generate the oscillatory component, a bandpass filter with these parameters was applied to a white-noise signal throughout the entire recording length, irrespective of stimulus onsets. Thus, the resulting phase distribution across trials was flat, as in the experimental data (Fig. 3B). The concentration parameter and the mean phase were determined by fitting the von Mises distribution to the phase distribution of the spikes using equations (8) and (9). Finally, the shape parameter of the Gamma process was determined by using time rescaling [BBV+02] as described in Section 3.1 (see Fig. 3B).
The QPG model reproduces the characteristics of the real data quite well. The simulated ISI histogram and autocorrelogram in Fig. 4B is very similar to the histograms from the data in Fig. 1B and also the histograms of spike phases are similar: simulated data shown in Fig. 4C and real data in Fig. 3A. Another indication that the QPG model captures the measured spike train very well is the good match between the time-rescaled ISI histogram using equation (11) and the Gamma distribution, compare histogram and solid line in Fig. 3B (bottom panel). As a control we rescaled the ISI histogram just by , ignoring the oscillations. The resulting histogram is clearly not well described by a Gamma distribution, Fig. 3B (top panel).
5.2 Estimation of Information rates
The fitted QPG model was used to create three different types of simulated data. The surrogate data reflected the entire structure of the fitted experimental data, as well as the QPG model permitted. The spike trains in the surrogate data exhibited stimulus-locked modulation and an oscillatory trend that was not locked to the stimulus. Since it is very difficult to conduct in vivo recordings over long periods of time, the number of stimulus repetitions available in the real data is very limited, in our case to 20 trials. The surrogate data can be made arbitrarily large and thus they allow to study effects of data limitation. Further, surrogate data allow to estimate information measures even though the original data set would be much too small to achieve a reliable estimation.
For the purpose of comparison we also generated data sets with the QPG model that had systematic differences from the real data. The second type of simulated data used all the fit parameters reflecting the stimulus modulation and the oscillation strength of the experimental data. However, unlike in the data the oscillatory trend in the model was aligned over repeats, that is, this data set contained stimulus-locked oscillations. The third type of simulated data reflected only the stimulus modulation observed in the data but no oscillatory structure.
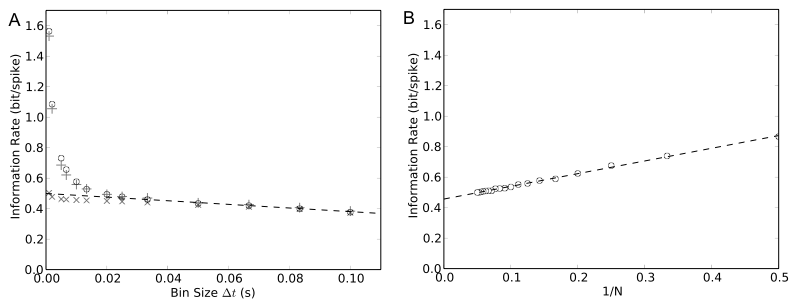
First we asked how the results with the standard direct method depends on the amount of data. We computed information rates with equation (14) for 20 trials (same number of trials as in the data) and for 500 trials from the surrogate data. Fig. 6 shows the information rates for the surrogate data in the same format as Fig. 5. The results for 20 trials (circles in in Fig. 6A) exhibit a similarly strong bias for bin sizes smaller than as is also observed for the experimental data (Fig. 5A). Using the linear extrapolation from larger bin sizes to estimate the information rate as in Fig. 5, the results for the surrogate data are very similar to the results on the real data in Fig. 5: 0.50 bit/spike for extrapolation to small time bins () Fig. 6A; and 0.45 bit/spike for extrapolation to small time bins and large numbers of trials (), Fig. 6B. In addition, the surrogate data allow to verify the validity of the linear extrapolation. The information estimates for 500 trials (crosses in Fig. 6A) lie slightly lower than the ones for 20 trials, as expected, but follow the linear trend to much smaller bin sizes.
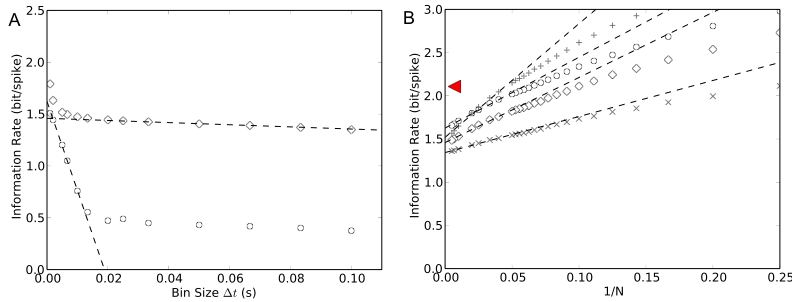
Next, we used equation (16) on the surrogate data to assess the contribution of the not stimulus-locked oscillations to the information rate of the spike trains generated by the QPG model. For comparison, we studied also the effect of stimulus-locked oscillations by applying the standard formula for direct information (14) to the simulated data with the oscillations aligned across trials. In both cases we used 500 simulated trials. Fig. 7 depicts the resulting information rates. For the stimulus-locked oscillations (circles) the additional information due to the oscillations is visible only at small bin sizes in Fig. 7A and therefore can easily be overlooked with limited data. In contrast, the result of non-stimulus-locked oscillations (diamonds) can be extrapolated from larger bin sizes. But note that the information rate of not stimulus-locked oscillations relies on an extended response histogram (in time and phase) and therefore the required amount of data is not smaller than for stimulus-locked oscillations. Therefore, both methods we use in Fig. 7 to estimate the information rates rely on boosting the amount of data with the QPG model, the extrapolations to zero bin size could not have been done directly on the experimental data with only 20 repeats. In the right panel (Fig. 7B) the obtained estimates for the information rates are extrapolated to infinite number of trials using different numbers of phase bins in the extended response histogram. Three observations with the resulting asymptotic information rates should be emphasized. First, oscillations contribute a significant amount of information. They add about 1 bit/spike for this cell, more than twice the information contained in stimulus-locked rate modulations alone (cf. Fig. 6A/B). Second, the information rates have a similar value, around 1.5 bit/spike, whether or not the oscillations are locked to the stimulus. Note that the rates for not stimulus-locked oscillations converge to 1.5 bit/spike for 10 or more phase bins. Third, the measured information rates reach about 70% of the value one would expect, if stimulus-locked and oscillatory modulation were entirely independent. The upper bound (18) for this cell that was best fitted with is bit/spike, as marked by the red triangle in Fig. 7B.
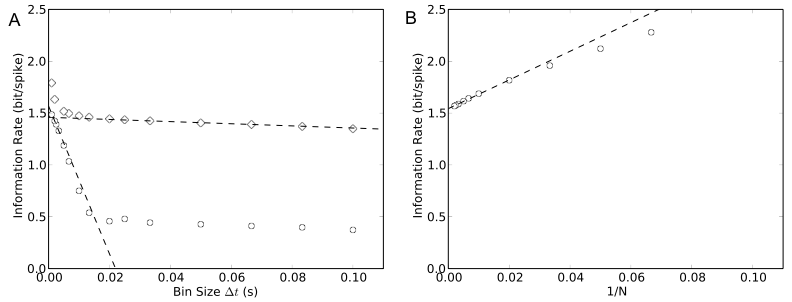
We have investigated whether the de-jittering method in Section 4.2.1 gives comparable results to the multiconditional method to estimate the information in oscillatory spike trains. The de-jittering method has been used in Ref. [KWV+08] to estimate information rates. However, since the limited amount of experimental data, the information of the de-jittered spike train has been estimated using the signal-to-noise ratio and the assumption of a Gaussian information channel. Here, we de-jittered the simulated data as described in Section 4.2.1 and applied equation (14) to determine the information rate in single spikes. Fig. 8A/B shows that the information rate estimation using de-jittering agrees quite well with the results obtained by the more rigorous treatment described in this paper. This comparison confirms that the de-jittering method is a viable method to estimate the information in oscillatory activity on limited amounts of data without explicitly modeling the data.
6 Discussion
6.1 Phase transmission versus phase coding
The phenomenon we have focused on in this paper is phase coupling of oscillatory neural activity between input and output of a neuron that also responds to an externally defined stimulus. Specifically, we proposed a model and a method to measure information transmission rates if the oscillations are not locked to the stimulus. In the phase transmission we consider, each spike provides information about the external stimulus and about the phase of the input oscillation. The appropriate measure for the information rate in this transmission process is .
It is important to emphasize how phase transmission is different from a traditional spike phase code and how both schemes are related. In a spike phase code, such as in place fields of the hippocampus, information is encoded by relative shifts of spikes with respect to a reference oscillation (theta waves). To read off the relative phases, the receiver has also to have independent access to the oscillatory reference signal. Accordingly, the transmitted information rate should be measured by , where are the relative phases between spikes and reference signal. Once oscillations are used to phase-encode information, one can ask how neurons downstream can pick up phase structure in the spike trains, carrying either phase encoded information or the reference signal, and reliably reproduce (or transmit) it in their output. This type of phase transmission we have investigated in oscillatory LGN cells.
Two recent studies provide evidence for additional phase-coded information in the visual system, however with respect to stimulus-locked oscillations: Montemurro et al. [MRM+08] have shown that the spike phase relative to slow ( Hz) oscillations in the local field potential of V1 which are locked to the stimulus carries additional stimulus information. Masse and Cook [MC08] have shown that the spike phase in MT relative to oscillations which are driven by the stimulus frame refresh carries additional information. It has been an open question whether spike phases relative to spontaneous oscillations that are not locked to the stimulus encode additional information. For the LGN data we have provided evidence that phase information is reliably transmitted. However, what type of phase code is employed and what information is encoded has not been addressed in this paper.
6.2 Potential artifacts and sources of bias in parameter estimation
Oscillatory artifacts due to line noise or due to frame and refresh rates in the monitor are of concern in all studies involving oscillations in neural responses to visual stimuli. Therefore, controls have to be conducted. To control for line noise one can search for spectral peaks centered at the line frequency of 60 Hz. Weak line noise artifacts were visible in some of the raw membrane recordings, however, never in the spike or EPSP trains we extracted. Further, artifacts in the membrane voltage were always easy to discern from true spectral peaks by their narrow width. To control for monitor artifacts one can use the monitor refresh signal in the phase locking analysis described in Section 3.2.2. The resulting phase distributions were flat. Furthermore, we observed that the oscillations persisted in spontaneous spiking activity when the eye was closed (data not shown).
Further, one has to exclude that the procedure described in Section 3.2.2 for estimating an oscillation phase from intracellular recordings introduces “false” phase locking between inputs and outputs of the LGN cells. The phase estimation can in fact become noisy if the event rates become low and errors in the event detection can introduce biases. In our case, however, the event rates where quite high, above 30 spikes/second on average (see Fig. 2A). Furthermore, the main imperfection in the event detection (to miss input events near spikes) would weaken the phase locking effect and not introduce false ones.
If the information rate is estimated with limited data it is possible that the oscillations are not fully averaged out in the PSTH. If the frequency bands of oscillations and stimulus-locked modulation are separated, the standard practice of using low-pass filtering in computing the PSTH (Section 3.1) reduces this effect already significantly. Potential residual oscillations in the PSTH lead to overestimation of the information in the stimulus-dependent rate modulation. Note that this potential bias does not introduce an artifactual information gain due to oscillations. Actually, it would work against finding a significant gain in information through the oscillatory activity because the overestimated quantity is subtracted.
6.3 Relations between our methods and earlier work
The QPG model we devised to describe phase locking of neural responses to an oscillatory input is related to some earlier models. In the limit of zero bandwidth, the oscillation phase becomes and the QPG model (with constant visual input) degenerates to a modulated Gamma process with a cyclic trend [Ber81]. Koyama and Shinomoto have proposed a model for oscillatory spike trains that uses instead of the von Mises function as the factor to convey an oscillatory trend [KS05]. We chose the von Mises distribution to model phase modulations since it is the highest entropy distribution for a given phase concentration and is able to model arbitrary phase concentrations. In contrast, the Koyama and Shinomoto (KS) model is limited to describing phase concentrations below corresponding to a circular variance of , even for maximal modulation . This limitation of the KS model can be easily verified using Eq. (8)-(10).
We have derived the multiconditional information rate (16) to measure the information rate through single spikes in a neuron that experiences two simultaneous influences, a stimulus-locked rate modulation and a periodic rate modulation that is not locked to the stimulus. This method is an extension of the direct method applied to single-spike events (14) [RWvSB99, BSK+00].
6.4 Functional roles of spontaneous oscillations
If the observed oscillations are ongoing and contain no stimulus-dependent modulation, the QPG model performs an operation similar to amplitude modulation (AM) in a radio broadcast signal: The stimulus-dependent rate corresponds to the modulation signal, the oscillations correspond to the high-frequency carrier in an AM signal. Analogous to broadcast transmission, the stimulus signal is modulated into the high-frequency band. However, unlike in a radio signal, the low frequency signal is still present in the spike train (because the multiplication is between two positive rate functions in the QPG model and therefore the resulting signal has no symmetric amplitude envelope). Thus, the spike train contains the stimulus signal twice, it can either be decoded by low pass filtering (usual method of rate decoding) or by band pass filtering. If the frequencies of the stimulus and the frequency of the ongoing oscillations are well separated, they can be transmitted and read out independently from each other. Furthermore, the low-pass and the band-pass signal are robust to different types of noise. Therefore, this redundant coding scheme could be used to achieve a more reliable readout of the stimulus signal downstream. For example, band pass filtering could be realized by tuned intrinsic subthreshold oscillations [Now97, HY00, FHM+01, TFS08].
In addition to robustness, oscillatory structure of the afferent input into cortex could subserve various other functions. First, it can support time-windowing in the readout for reducing crosstalk from all other neural activity (that does not share the oscillation). Second, common oscillations in different cells can produce synchrony between LGN spikes which has been shown to improve the success rate to activate cortical cells [UAR00, BS06], for a model, see [KTG+04]. Third, it can enable oscillatory top-down attentional mechanisms to select between specific input streams [FNS07].
6.5 Roles and coding mechanisms of stimulus-influenced oscillations
If the oscillations are stimulus-influenced, although not stimulus-locked, they carry information about the stimulus. If this information were overlapping or identical with the information in , this redundancy could serve similar functions as described for stimulus-independent ongoing oscillations. However, if the information carried in the oscillations would represent stimulus properties not conveyed by , the oscillations would enable a multiplexing in spike trains, that is, two different signals could be carried by one spike train as seen e.g. in the olfactory system [SJL03]. The multiplex scheme could employ a number of different encoding schemes. For example, the coherence of a spike train could be modulated or the phase of neural oscillations or of spikes relative to these oscillations could encode additional stimulus information [GKES89, NS96, SZBB06, MRM+08, MC08].
The QPG model does not explicitly model how additional stimulus properties are encoded in the oscillatory signal. Nevertheless, we can use the QPG model to estimate the information that can be submitted using the oscillations as an additional information channel. Using a simple back-of-an-envelope calculation we can estimate the information in a phase code that synchronizes the oscillations (and thus the spikes) of two cells [GKES89, NS96, SZBB06] in a population of neurons. Since the oscillations in the fitted model have a bandwidth of Hz, phase alignments cannot be instantaneous: The maximum relative phase adjustment necessary to synchronize two cells takes about 125 ms and is therefore within the behaviorally relevant range. Even with a conservative information estimate of 1 bit per cell in 125 ms (corresponding to two possible phases for say figure and ground), the encoded information would be about 8 bit/s and therefore comparable to the rate-encoded information of 9 bit/s (0.45 bit/spike at a typical rate of 20 spikes/s). Thus, the oscillation-based channel can encode stimulus information in the oscillation phase that is independent from the type of information conveyed by the rate.
If such an additional oscillation-based information channel exists in the early visual system, the most interesting question is, of course, what properties of the stimulus the channel conveys. So far, this question has not be answered for the early mammal visual system. However, a recent study of the impact of retinal oscillations on the behavior of frogs suggest the intriguing possibility that retinal oscillations could encode nonlocal information such as spatial or temporal stimulus context [IGHT05].
7 Summary
The paper presented new theoretical tools for studying the functional roles of oscillatory activity in the brain. To simulate oscillatory spike trains that are phase-locked to an oscillatory influence that is not stimulus-locked we described the quasi-periodic gamma (QPG) model. This model generates spikes using an inhomogeneous Gamma process modulated by the product of a stimulus-influenced rate and a quasi-periodic von Mises distribution. The QPG model can be fitted to oscillatory recordings in the LGN of the cat and reproduces the main characteristics of the data, such as ISI histogram, oscillation score and spike-phase histograms. To capture the information in the spike train about oscillations that are not locked to the stimulus, we propose the multiconditional direct method (16), a generalization of the direct method applied to single-spike events [RWvSB99, BSK+00]. We estimated information rates in oscillatory LGN cells and discussed the possible consequences from our finding that oscillations contribute significantly to the information carried in the spike train. However, the proposed computational methods are not confined to visual neurons, they are general tools for investigating the transmission of oscillatory structure in neural activity in the brain.
Acknowledgments: We thank J. Hirsch, X. Wang, and V. Vaingankar, University of Southern California, for numerous helpful discussions and for permitting the use of their experimental data. We also thank Tim Blanche and Charles Cadieu for valuable comments on the manuscript. The comments of two anonymous reviewers improved the manuscript substantially. This work has been supported by NSF grant IIS-0713657. The data analysis and simulations were computed using IPython [PG07] and NumPy/SciPy [Oli07], all figures were produced using Matplotlib [BHM+05].
References
- [Adr42] ED Adrian. Olfactory reactions in the brain of the hedgehog. The Journal of Physiology, 100(4):459–73, 1942.
- [AMG+05] Z.N. Aldworth, J.P. Miller, T. Gedeon, G.I. Cummins, and A.G. Dimitrov. Dejittered Spike-Conditioned Stimulus Waveforms Yield Improved Estimates of Neuronal Feature Selectivity and Spike-Timing Precision of Sensory Interneurons. Journal of Neuroscience, 25(22):5323–32, 2005.
- [AV90] E. Ahissar and E. Vaadia. Oscillatory activity of single units in a somatosensory cortex of an awake monkey and their possible role in texture analysis. Proceedings of the National Academy of Sciences of the United States of America, 87(22):8935–9, 1990.
- [BBV+02] E.N. Brown, R. Barbieri, V. Ventura, R.E. Kass, and L.M. Frank. The Time-Rescaling Theorem and Its Application to Neural Spike Train Data Analysis. Neural Computation, 14(2):325–346, 2002.
- [Ber81] M. Berman. Inhomogeneous and Modulated Gamma Processes. Biometrika, 68(1):143–52, 1981.
- [BFK57] HB Barlow, R. Fitzhugh, and SW Kuffler. Change of organization in the receptive fields of the cat’s retina during dark adaptation. The Journal of Physiology, 137(3):338–54, 1957.
- [BHM+05] P. Barrett, J. Hunter, JT Miller, J.C. Hsu, and P. Greenfield. matplotlib–A Portable Python Plotting Package. Astronomical Data Analysis Software and Systems XIV ASP Conference Series,, 347:91–95, 2005.
- [BQF+01] R. Barbieri, M.C. Quirk, L.M. Frank, M.A. Wilson, and E.N. Brown. Construction and analysis of non-Poisson stimulus-response models of neural spiking activity. Journal of Neuroscience Methods, 105(1):25–37, 2001.
- [BS06] R.M. Bruno and B. Sakmann. Cortex Is Driven by Weak but Synchronously Active Thalamocortical Synapses. Science, 312(5780):1622–1627, 2006.
- [BSK+00] N. Brenner, S.P. Strong, R. Koberle, W. Bialek, and R.R.R. Steveninck. Synergy in a Neural Code. Neural Computation, 12(7):1531–52, 2000.
- [BT99] A. Borst and F.E. Theunissen. Information theory and neural coding. Nature Neuroscience, 2:947–57, 1999.
- [CBNS98] M. Castelo-Branco, S. Neuenschwander, and W. Singer. Synchronization of Visual Responses between the Cortex, Lateral Geniculate Nucleus, and Retina in the Anesthetized Cat. Journal of Neuroscience, 18(16):6395–410, 1998.
- [EP75] R. Eckhorn and B. Popel. Rigorous and extended application of information theory to the afferent visual system of the cat. II. Experimental results. Biol Cybern, 17(1):71–7, 1975.
- [FHM+01] J.M. Fellous, AR Houweling, RH Modi, RPN Rao, PHE Tiesinga, and TJ Sejnowski. Frequency Dependence of Spike Timing Reliability in Cortical Pyramidal Cells and Interneurons. Journal of Neurophysiology, 85(4):1782–1787, 2001.
- [FNS07] P. Fries, D. Nikolić, and W. Singer. The gamma cycle. Trends in Neurosciences, 30(7):309–16, 2007.
- [Fre72] WJ Freeman. Measurement of oscillatory responses to electrical stimulation in olfactory bulb of cat. Journal of Neurophysiology, 35(6):762–779, 1972.
- [GKES89] C.M. Gray, P. Koenig, A.K. Engel, and W. Singer. Oscillatory responses in cat visual cortex exhibit inter-columnar synchronization which reflects global stimulus properties. Nature, 338(6213):334–337, 1989.
- [GT90] A. Gelperin and D.W. Tank. Odour-modulated collective network oscillations of olfactory interneurons in a terrestrial mollusc. Nature, 345(6274):437–440, 1990.
- [HB66] WD Heiss and H. Bornschein. Multimodal interval histograms of the continuous activity of retinal cat neurons. Kybernetik, 3(4):187–91, 1966.
- [HH52] A.L. Hodgkin and AF Huxley. Currents carried by sodium and potassium ions through the membrane of the giant axon of Loligo. J. Physiol, 116(4):449–472, 1952.
- [HY00] B. Hutcheon and Y. Yarom. Resonance, oscillation and the intrinsic frequency preferences of neurons. Trends in Neurosciences, 23(5):216–222, 2000.
- [IGHT05] H. Ishikane, M. Gangi, S. Honda, and M. Tachibana. Synchronized retinal oscillations encode essential information for escape behavior in frogs. Nat Neurosci, 8(8):1087–95, 2005.
- [JM01] MR Jarvis and PP Mitra. Sampling Properties of the Spectrum and Coherency of Sequences of Action Potentials. Neural Computation, 13(4):717–49, 2001.
- [KFB57] SW Kuffler, R. Fitzhugh, and HB Barlow. Maintained activity in the cat’s retina in light and darkness. J Gen Physiol, 40(5):683–702, 1957.
- [KS05] S. Koyama and S. Shinomoto. Empirical Bayes interpretations of random point events. Journal of Physics A: Mathematical and General, 38(29):L531–L537, 2005.
- [KTG+04] G.T. Kenyon, J. Theiler, J.S. George, B.J. Travis, and D.W. Marshak. Correlated firing improves stimulus discrimination in a retinal model. Neural Computation, 16(11):2261–91, 2004.
- [KWV+08] K. Koepsell, X. Wang, V. Vaingankar, Y. Wei, Q. Wang, D.L. Rathbun, W.M. Usrey, J.A. Hirsch, and F.T. Sommer. Retinal oscillations carry visual information to cortex. submitted, 2008.
- [LD94] G. Laurent and H. Davidowitz. Encoding of Olfactory Information with Oscillating Neural Assemblies. Science, 265(5180):1872–75, 1994.
- [LV67] M. Laufer and M. Verzeano. Periodic activity in the visual system of the cat. Vision Res, 7(3):215–29, 1967.
- [MC08] N.Y. Masse and E.P. Cook. The Effect of Middle Temporal Spike Phase on Sensory Encoding and Correlates with Behavior during a Motion-Detection Task. Journal of Neuroscience, 28(6):1343, 2008.
- [MHKS84] J. Munemori, K. Hara, M. Kimura, and R. Sato. Statistical features of impulse trains in cat’s lateral geniculate neurons. Biological Cybernetics, 50(3):167–172, 1984.
- [MJM+08] R.C. Muresan, O.F. Jurjut, V.V. Moca, W. Singer, and D. Nikolic. The Oscillation Score: An Efficient Method for Estimating Oscillation Strength in Neuronal Activity. Journal of Neurophysiology, 99(3):1333–53, 2008.
- [MRM+08] M.A. Montemurro, M.J. Rasch, Y. Murayama, N.K. Logothetis, and S. Panzeri. Phase-of-Firing Coding of Natural Visual Stimuli in Primary Visual Cortex. Current Biology, 8(5):375–80, 2008.
- [Now97] LG Nowak. Influence of low and high frequency inputs on spike timing in visual cortical neurons. Cerebral Cortex, 7(6):487–501, 1997.
- [NS96] S. Neuenschwander and W. Singer. Long-range synchronization of oscillatory light responses in the cat retina and lateral geniculate nucleus. Nature, 379(6567):728–33, 1996.
- [OBL66] T. Ogawa, P. O. Bishop, and W. R. Levick. Cortex Is Driven by Weak but Synchronously Active Thalamocortical Synapses. Journal of Neurophysiology, 29:1–30, 1966.
- [Oli07] T.E. Oliphant. Python for Scientific Computing. Computing in Science & Engineering, 9(3):10–20, 2007.
- [OR93] J. O Keefe and M.L. Recce. Phase relationship between hippocampal place units and the EEG theta rhythm. Hippocampus, 3(3):317–30, 1993.
- [PG07] F. Pérez and B.E. Granger. IPython: A System for Interactive Scientific Computing. Computing in Science & Engineering, 9(3):21–29, 2007.
- [PGM67] D.H. Perkel, G.L. Gerstein, and G.P. Moore. Neuronal Spike Trains and Stochastic Point Processes: I. The Single Spike Train. Biophysical Journal, 7(4):391–418, 1967.
- [Rod67] R.W. Rodieck. Maintained activity of cat retinal ganglion cells. Journal of Neurophysiology, 5:1043–1071, 1967.
- [ROS90] BJ Richmond, LM Optican, and H. Spitzer. Temporal encoding of two-dimensional patterns by single units in primate primary visual cortex. I. Stimulus-response relations. Journal of Neurophysiology, 64(2):351–69, 1990.
- [RWvSB99] F. Rieke, D. Warland, R.R. van Steveninck, and W. Bialek. Spikes: exploring the neural code. MIT Press, Cambridge, 1999.
- [SBA03] M. Szwed, K. Bagdasarian, and E. Ahissar. Encoding of Vibrissal Active Touch. Neuron, 40(3):621–630, 2003.
- [SJL03] M. Stopfer, V. Jayaraman, and G. Laurent. Intensity versus Identity Coding in an Olfactory System. Neuron, 39(6):991–1004, 2003.
- [SL03] M. Sahani and J.F. Linden. Evidence Optimization Techniques for Estimating Stimulus-Response Functions. In K. Obermayer S. Becker, S. Thrun, editor, Advances in Neural Information Processing Systems 15: Proceedings of the 2002 Conference, pages 109–16. MIT Press, 2003.
- [SZBB06] J.M. Samonds, Z. Zhou, M.R. Bernard, and AB Bonds. Synchronous Activity in Cat Visual Cortex Encodes Collinear and Cocircular Contours. Journal of Neurophysiology, 95(4):2602–2616, 2006.
- [TFS08] P. Tiesinga, J.M. Fellous, and T.J. Sejnowski. Regulation of spike timing in visual cortical circuits. Nature Reviews Neuroscience, 9(2):97–107, 2008.
- [Tuc88] H.C. Tuckwell. Introduction to Theoretical Neurobiology. Cambridge University Press, 1988.
- [UAR00] W.M. Usrey, J.M. Alonso, and R.C. Reid. Synaptic Interactions between Thalamic Inputs to Simple Cells in Cat Visual Cortex. Journal of Neuroscience, 20(14):5461, 2000.
- [WWV+07] X. Wang, Y. Wei, V. Vaingankar, Q. Wang, K. Koepsell, F.T. Sommer, and J.A. Hirsch. Feedforward Excitation and Inhibition Evoke Dual Modes of Firing in the Cat’s Visual Thalamus during Naturalistic Viewing. Neuron, 55(3):465–78, 2007.