Dust processing in photodissociation regions
Abstract
Context. Mid-infrared spectroscopy of dense illuminated ridges (or photodissociation regions, PDRs) suggests dust evolution. Such evolution must be reflected in the gas physical properties through processes like photo-electric heating or H2 formation.
Aims. With Spitzer Infrared Spectrograph (IRS) and ISOCAM data, we study the mid-IR emission of closeby, well known PDRs. Focusing on the band and continuum dust emissions, we follow their relative contributions and analyze their variations in terms of abundance of dust populations.
Methods. In order to disentangle dust evolution and excitation effects, we use a dust emission model that we couple to radiative transfer. Our dust model reproduces extinction and emission of the standard interstellar medium that we represent with diffuse high galactic latitude clouds called Cirrus. We take the properties of dust in Cirrus as a reference to which we compare the dust emission from more excited regions, namely the Horsehead and the reflection nebula NGC 2023 North.
Results. We show that in both regions, radiative transfer effects cannot account for the observed spectral variations. We interpret these variations in term of changes of the relative abundance between polycyclic aromatic hydrocarbons (PAHs, mid-IR band carriers) and very small grains (VSGs, mid-IR continuum carriers).
Conclusions. We conclude that the PAH/VSG abundance ratio is 2.4 times smaller at the peak emission of the Horsehead nebula than in the Cirrus case. For NGC2023 North where spectral evolution is observed across the northern PDR, we conclude that this ratio is 5 times lower in the dense, cold zones of the PDR than in its diffuse illuminated part where dust properties seem to be the same as in Cirrus. We conclude that dust in PDRs seems to evolve from ”dense” to ”diffuse” properties at the small spatial scale of the dense illuminated ridge.
Key Words.:
ISM:individual objects: Horsehead, NGC2023 - (ISM:) dust, extinction - Infrared: ISM1 Introduction
Evolution of interstellar dust was first inferred from measurements and modelling of the ultraviolet(UV)-visible extinction (Cardelli et al. 1989; Fitzpatrick & Massa 1986, 1988, 1990; Kim et al. 1994) and from the infrared (IR) colour variations in IRAS and COBE data (Boulanger et al. 1990; Abergel et al. 1994, 1996; Laureijs et al. 1991). The evolution of interstellar matter is powered by stars which have a profound influence on the chemical and energetic balance of the interstellar medium. Along this lifecycle, dust grains undergo efficient processing by shocks and stellar photons which is primarily reflected in the dust size distribution (see for instance Jones 1997, 2004). Such evolution is expected to be particularly significant between the dense and diffuse galactic environments. For instance, the presence of small dust particles in the diffuse galactic medium is necessary to account for the near-infrared (NIR) and mid-infrared (mid-IR) observed emission (e.g. Sellgren 1984; Draine & Anderson 1985) while in dense molecular environment these small particles must coagulate with the larger species (e.g. Stepnik et al. 2003). Dust has a strong impact on interstellar gas because of efficient coupling such as gas heating by the photoelectric effect or the formation of H2 on grain surfaces. In addition, these gas-grain processes are dominated by the contribution of small dust grains of radius nm (e.g. Habart et al. 2001; Weingartner & Draine 2001b; Habart et al. 2004).
Located at the illuminated edges of molecular clouds, photodissociation regions (hereafter PDRs; for a review see e.g. Hollenbach & Tielens 1997) are regions of transition between dense and diffuse media. In addition to the generally large density gradient observed in such regions, there is a gradient of the UV-visible radiation field intensity due to the proximity to a (some) young star(s) and to the absorption of the radiation field by the dust. Consequently, PDRs are the site of significant evolution of both the dust and gas properties which are closely interlinked. Dust evolution may be a key to the understanding of the unexpectedly large amount of warm H2 in PDRs (e.g. Allers et al. 2005; Habart et al. 2008). PDRs are responsible for the reprocessing of most of the UV-visible radiative energy output from stars which is re-emitted in infrared-millimeter wavelengths (e.g. Hollenbach & Tielens 1997) and consequently are important IR emitters of normal star forming galaxies. It is thus necessary to understand in detail the emission coming from PDRs in order to interpret IR galaxy spectra.
Infrared Space Observatory (ISO) observations showed a systematic diminution of the emission ratio between aromatic infrared bands (AIBs between 3 and 17 m) emitted by polycyclic aromatic hydrocarbons (PAHs) and the mid-IR continuum emission from dense illuminated ridges (e.g. Cesarsky et al. 2000; Abergel et al. 2002). Rapacioli et al. (2005) have interpreted this evolution in terms of the chemical evolution of small carbonaceous particle properties by decomposing ISOCAM/CVF spectral cubes (5-16 m) with the Single Value Decomposition method. Berné et al. (2007) have extended this study by using the Blind Signal Separation method on Spitzer IRS data. A limitation of these methods is that they do not take into account the radiative transfer of stellar photons which may affect the shape of the mid-IR spectrum just as dust properties and abundances do. The aim of this paper is to study the dust evolution in two well known PDRs as seen by Spitzer/IRS and ISOCAM through the modelling of the dust mid-IR emission including radiative transfer. Although other dust properties like the size distribution and/or composition can change, we will interpret observed mid-IR spectral variations in term of PAH/VSG relative abundance. In section 2 and 3, we present the studied PDRs and the Spitzer data. The section 4 is devoted to the observed mid-IR spectral shape in these PDRs. In section 5, we present our dust model (§ 5.1) and the radiative transfer (§ 5.2) used to model dust emission in PDRs. Sections 6 and 7 present results of the modelling of the Horsehead Nebula and NGC2023 respectively. We conclude in section 8.
2 The selected photodissociation regions
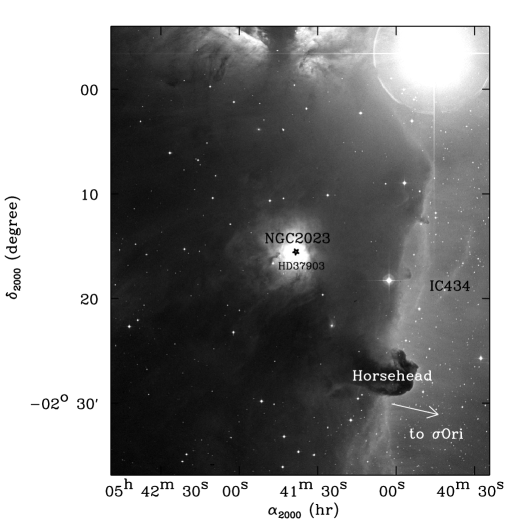
The Horsehead nebula and NGC2023 are located in the L1630 molecular cloud as seen in the left panel of Fig. 1. This molecular cloud is located at a distance of 400 pc (from the study of the distances to B stars in the Orion association by Anthony-Twarog 1982) in the southern part of the Orion B molecular complex.
2.1 The Horsehead nebula
In the visible, the Horsehead nebula, also known as B33 (Barnard 1919), emerges from the west edge of L1630 as a dark cloud hiding the H emission of the IC434 HII region (see left panel of Fig. 1). The Horsehead nebula is a familiar object in astronomy and has been observed many times at visible, IR and submm wavelengths (Abergel et al. 2003; Pound et al. 2003; Teyssier et al. 2004; Pety et al. 2005; Hily-Blant et al. 2005; Habart et al. 2005; Ward-Thompson et al. 2006; Philipp et al. 2006; Johnstone et al. 2006; Goicoechea et al. 2006; Pety et al. 2007b; Compiègne et al. 2007, for the 21st century only). Both the IC434 HII region and the Horsehead nebula PDR are mainly excited by Orionis which is an O9.5V binary system (Warren & Hesser 1977) with an effective temperature of 34 600 K (Schaerer & de Koter 1997) and whose direction is indicated by the arrow in Fig. 1. Assuming that Orionis and the Horsehead are in the same plane perpendicular to the line of sight, the distance between them is 3.5 pc ( 0.5 deg) which gives 100 (the energy density of the radiation field between 6 and 13.6 eV in units of the Habing field, Habing 1968) for the radiation field which illuminates the Horsehead nebula.
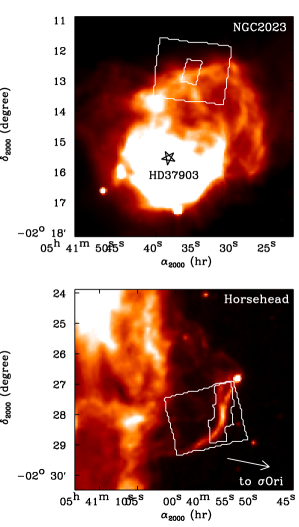
The edge of the Horsehead nebula is delineated by an IR emission filament as seen in the right panel of Fig. 1. Abergel et al. (2002) proposed that this filament is due to the simultaneous presence of dense material and a UV radiation field from Orionis. The ISOCAM 5-8.5 m data seen on the right panel of Fig. 1 shows the mid-IR band emission which is known to scale with the UV radiation field for ranging from 1 to 104 as expected for grains small enough (PAHs) to undergo temperature spikes (Boulanger et al. 1998). Thus, matter located deeper in the dense cloud is less excited, which explains this bright narrow IR filament. The Horsehead PDR is an almost plane-parallel slab seen edge-on and is thus commonly used as a benchmark for comparison between models and observations (e.g. Pety et al. 2007a).
2.2 NGC2023
NGC2023 is primarily known as a reflection nebula and thus appears as an extended source at visible wavelengths (left panel of Fig.1). The nebula is excited a B1.5V star (HD37903) which is embedded in the L1630 cloud (e.g. Gatley et al. 1987) and thus illuminates the foreground dust (e.g. Burgh et al. 2002) which efficiently scatters visible photons (e.g. Draine 2003). The position of this star, which has an effective temperature of 23700 K, is shown on Fig.1. Its distance has been estimated by Hipparcos (Perryman et al. 1997) to be 470290 pc. The right panel of Fig.1 shows NGC2023 as seen by the LW2 channel of ISOCAM at 5-8.5 m which traces mostly AIBs emitted by PAHs.
The bubble geometry of NGC2023 reflects the influence of the young star which blows up the surrounding matter and carves a cavity in the progenitor cloud (e.g. Castor et al. 1975; Freyer et al. 2003). This scenario is supported by the low extinction toward HD37903 ( 1.4, Burgh et al. 2002) while the total extinction through L1630 is 40 (Harvey et al. 1980). As seen in Fig.1, NGC2023 is thus basically a spherical cavity seen face-on.
In this work, we focus on NGC2023 North (hereafter NGC2023N) which exhibits a strong variation of its mid-IR spectrum as shown by Abergel et al. (2002).
3 Observations
3.1 Infrared spectrograph data
The Horsehead Nebula and NGC2023N were observed as part of the ”SPECPDR” program (Joblin et al. 2005), using the infrared spectrograph (IRS, Houck et al. 2004) which is a slit spectrograph on board Spitzer (Werner et al. 2004a). The present observations were performed with the spectral mapping mode and using the short-low (SL, 5.2-14.5 m, slit size: 57″ 3.6″, R=64-128) and long-low (LL, 14-38 m, slit size: 168″ 10.6″, R=64-128) modules of the instrument. The integration times were 14 and 60 s per pointing for the second (5.2-8.7 m) and the first (7.4-14.5 m) orders of SL, respectively, and 14 s per pointing for both orders of LL.
Starting from BCD products, we have developed a pipeline which builds spectral cubes (two spatial dimensions and one spectral dimension) in a homogeneous way from the data delivered by the Spitzer Science Center (SSC). This pipeline has been presented in Compiègne et al. (2007). The LL data between 35 and 38 m are not considered due to the strong decrease of sensitivity at these wavelengths. We therefore obtain 5 to 35 m spectral cubes for the observed area. The absolute photometric uncertainty is 10%.
The zodiacal emission Z() must be subtracted from these data. We assume that this contribution does not vary across the observed area of the sky for a given object. We estimate Z() using the SSC background estimator111See http://ssc.spitzer.caltech.edu/documents/background/ which is based on the COBE/DIRBE model (Kelsall et al. 1998). Following Compiègne et al. (2007), we take into account the zodiacal contribution in the dark observation (at position RA = 26896, DEC = 6543 in the sky) in the BCD level of the IRS data.


3.2 ISOCAM data
Both the Horsehead nebula and NGC2023 were observed with ISOCAM on board the Infrared Space Observatory (ISO) in the LW2 (5-8.5 m) and LW3 (12-18 m) broad band photometers (Abergel et al. 2002). The data shown in Fig. 1 and Fig. 3 has been reduced following Miville-Deschênes et al. (2000). For the two filters, the photometric accuracy for the extended emission is 10%. The zodiacal contribution subtracted from this data has also been estimated from the Kelsall et al. (1998) model.
NGC2023N has also been observed with ISOCAM-CVF (Abergel et al. 2002). The area observed with ISOCAM-CVF includes almost entirely that observed with IRS-LL and completely that observed with IRS-SL. We use this data to obtain the same spatial coverage for spectral mapping data for the 5-16 m range as for the 14-35m range (IRS-LL). The spectral resolution of ISOCAM-CVF is 40. The data reduction and zodiacal light subtraction is described in Boulanger et al. (2005) and the corresponding photometric accuracy is 20%.
4 Spectral variations
Mean mid-IR spectra of both objects are displayed in Fig. 2. They are typical of PDRs and present emission in the AIBs at 6.2, 7.7, 8.6, 11.3, 12.7 m, the mid-IR dust continuum as well as in H2 rotational lines within the first vibrational level. The NGC2023N spectrum, which is brighter, also clearly exhibits the 16.4 m band and the 17.1 and 19 m bands already reported in NGC7023 by Werner et al. (2004b). The spectrum of the Horsehead nebula also presents fine structure lines of ionised species (dotted lines in Fig. 2) which arise from the HII region surrounding the Horsehead nebula. In this paper, we limit our study to the neutral gas zone (i.e. the PDR, see Compiègne et al. 2007, for study of the HII region).
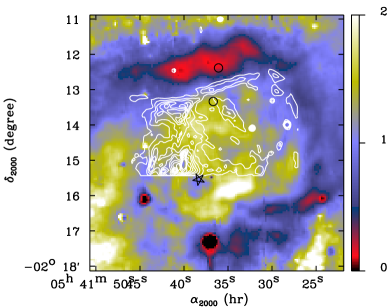
Fig. 3 shows the map of the band ratio LW2(5-8.5 m)/LW3(12-18 m) in NGC2023. As already noted by Abergel et al. (2002), this ratio varies across dense, photodissociated interfaces. The northern PDR is well delineated by the H2 = 1-0 S(1) emission along a nearly east-west ridge at 2°13′ (between the two circle positions in Fig. 3) which spatially correspond to a striking variation of LW2/LW3. This ratio indeed decreases by a factor of 2.6 between the two positions marked by circles in Fig. 3 for which spectra are displayed in the same figure. From their analysis of the ISOCAM-CVF (5-16 m) spectral maps, Abergel et al. (2002) concluded that this evolution of LW2/LW3 is related to a decrease of the AIBs relative to the mid-IR continuum emission while moving away from the star and into the molecular cloud. This conclusion is clearly confirmed by the present IRS spectra which also extend to longer wavelengths and better define the mid-IR dust emission.
The spectra of Fig. 3 also show a variation of the shape of the 20-35 m continuum between the two positions. While almost linear deep into the cloud, it shows a non-linear rise closer to the star. Note that bigger grains which are at thermal equilibrium could be hot enough to emit below 35 m for positions close to the star while they are colder deeper in the cloud.
Conversely, the Horsehead observations do not show significant spectral variations. This may be due to the sharpness of the photodissociated interface barely resolved by IR data and across which the variations occur. However, we note that while in NGC2023N the LW2/LW3 ratio goes from 1.7 close to the star to 0.6 deeper into the cloud, the value of this ratio for the unresolved filament of the Horsehead nebula is 1.1. This value is almost median between the extreme values across NGC2023N. In fact, the mean spectra of Fig. 2 have similar LW2/LW3 values (1) suggesting that we see ”average” properties in the Horsehead.
5 Dust emission model for PDRs
In order to analyze the IR spectra of PDRs and to trace dust abundance variations by taking into account excitation effects, we developed a dust emission model and also treat the radiative transfer problem inside a PDR. Our dust model is an updated version of that Désert et al. (1990) (hereafter DBP). We combine this model with a 1 dimension radiation transfer model which is fully consistent with the dust properties of the dust emissivity model. Modifications implemented to the DBP model are described in section 5.1 while the description of the transfer model is given in section 5.2.
5.1 The dust model
The interpretation of dust observables (extinction and IR emission) in the ISM requires at least three dust populations of increasing sizes (e.g. DBP, Li & Draine 2001; Zubko et al. 2004). In DBP, these are: (i) large (radius to 1 nm) polycyclic aromatic hydrocarbons (PAHs) which account for the AIBs and for the far-ultraviolet (FUV) non-linear rise in the extinction curve, (ii) carbonaceous nanoparticles ( to 10 nm) called very small grains (VSGs) which carry the mid-IR continuum emission and the extinction bump at 2175 Å and (iii) big grains (BGs, to 100 nm) which produce the far IR emission, the rise at visible near-IR wavelengths as well as the 10 and 20 m absorption bands in the extinction. In the diffuse interstellar medium, small grains (PAHs and VSGs) undergo temperature spikes triggered by the absorption of stellar photons and cool by emission in the near and mid-IR range. Conversely, BGs, which have a longer cooling time and a shorter timescale between absorption of two photons because of their size, stay at constant temperature and emit like grey bodies.
The dust properties that we describe below allow the reproduction of the extinction curve and emission spectrum of the diffuse high galactic latitude ISM (so called ”Cirrus”) as seen in Fig. 4. The exciting radiation is the Interstellar Standard Radiation Field (ISRF, Mathis et al. 1983). We call this dust population Cirrus dust as a reference to compare to dust emission in other interstellar environments.
The absorption cross-section of PAHs has been updated. We take the visible-UV cross-section from Verstraete & Léger (1992) and apply their size dependent cut-off for electronic transitions in the near-IR. The resulting cross-section provides a good match to the available laboratory measurements on species containing 20 to 30 C atoms (Joblin et al. 1992). The cross-sections of the AIBs (at 3.3, 6.2, 7.7, 8.6, 11.3, 12.7 and 16.4 m) are based on Verstraete et al. (2001) and Pech et al. (2002) and assumes singly ionized PAHs. ISO-SWS spectra also indicates the presence of a broad band at 6.9 m and a band at 12 m (Verstraete et al. 2001; Peeters et al. 2002). In addition, Spitzer data has shown the presence of another band at 17 m which behaves like the rest of the AIBs (Peeters et al. 2004; Smith et al. 2007). We therefore include these bands in our AIB list which is summarized in Table 1. The positions and widths of these bands were derived from ISO and Spitzer spectra. Peak values of cross sections of all AIBs are adjusted in order to match the Cirrus observed spectrum.
| (m) | () | () | (10) |
|---|---|---|---|
| 3.3 | 3040 | 39 | 2.4 |
| 6.2 | 1609 | 44 | 3.1 |
| 6.9 | 1450 | 300 | 0.4 |
| 7.7 | 1300 | 113 | 3.8 |
| 8.6 | 1162 | 47 | 4.9 |
| 11.3 | 890 | 18 | 11.0 |
| 12.0 | 830 | 30 | 3.2 |
| 12.7 | 785 | 16 | 7.5 |
| 16.4 | 609 | 6 | 1.0 |
| 17.1 | 585 | 17 | 0.6 |
| PAH | 3.5 | 0.4 | 1.2 |
| VSG | 3.5 | 1.0 | 4.0 |
| BG | 3.5 | 4.0 | 110 |


We assume planar and fully hydrogenated PAHs with hexagonal symmetry (). The molecular radius is related to the number of carbon atoms per molecule as and the number of hydrogen atoms is given by . Finally we take the far-IR cross section from Schutte et al. (1993).
VSGs are assumed to be graphitic and both the optical properties and heat capacity have been updated (e.g. Draine & Li 2001). Their optical properties have been calculated with Mie theory222Code retrieved from http://atol.ucsd.edu/scatlib/index.htm applied to small graphitic spheres in the 2/3 - 1/3 approximation (e.g. Draine & Lee 1984). The dielectric constant was taken from Laor & Draine (1993).
As in DBP, BGs are taken to be silicates with carbonaceous mantles or inclusions in order to provide the required absorption efficiency in the NIR compared to bare silicates. The near-IR absorption cross section of BGs now has a dependence which allows a better match of the observed extinction curve.
We assumed the size distributions of all the dust populations of our model to be a power-law type, with minimum and maximum radii and listed in Table 2. This simple form of size distribution originally introduced by Mathis et al. (1977) remains a good paradigm (Kim et al. 1994; Weingartner & Draine 2001a; Clayton et al. 2003). Note that abundances of the three populations remain unchanged from those of the DBP model.
One of the consequences of the update is that UV-visible cross sections (see Fig. 4) of the PAHs and VSGs are more similar than in the DBP model. In fact, these two species are assumed to contain mostly sp2 hybridization carbons which are responsible for the 2175 bump ( electronic transition) and for the non-linear rise in the far UV (bump at 800 due to a electronic transition). This similarity has consequences for the possible self shielding of the two species which will cause an evolution of the spectral shape depending the shape of the exciting radiation field spectrum.
5.2 Radiative transfer
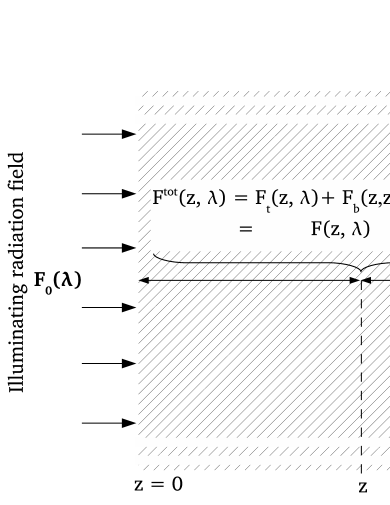
We describe here how the total exciting flux is estimated at each depth of the cloud. This total exciting flux results from the contribution of the illuminating radiation field transfered into the cloud and of the dust emission , as illustrated by Fig 5.
We first transfer the incident radiation field into the cloud which is represented by a semi-finite plane-parallel slab of proton density at each depth ( at the free interface). We use the dust properties described above. Note that the PAHs are assumed to have a zero albedo and that the albedo of VSGs is low due to their small size. The scattering cross section is thus dominated by the contribution of BGs.
The incident radiation field () is the sum of the mean interstellar radiation field (ISRF) of Mathis et al. (1983) and of a blackbody whose flux is diluted by ( with the current distance to the star and the stellar radius. Note that the flux of the ISRF is obtained by integrating the intensity over 2 steradians since the cloud is illuminated on one side. Moreover, we limit the radiation field to photon energies of less than since we consider neutral gas (PDR).
The plane-parallel approximation allows us to simplify the treatment of the scattering. We assume that each incident photon is either scattered forward deeper into the cloud (increasing ) or scattered back towards the cloud interface (decreasing ). Assuming that a photon can only be backscattered once, the flux of the radiation field at a given depth into the cloud can be written as
| (1) |
where is the transmitted flux from the illuminated surface of the cloud and the flux backscattered by the part of the cloud deeper than . We impose a finite depth for the cloud in order to estimate the backscattered flux.
With our assumptions, we only need absorption cross sections () and backscattering cross sections () to perform the transfer since photons that are scattered forward are simply treated as transmitted. Our dust model only computes the integrated scattering () cross section and not the differential one (). We thus use the Henyey & Greenstein (1941) phase function () to calculate the backscattering cross section as
| (2) |
Note that when taking which is the common value used, in accordance with the diffuse interstellar medium observations (e.g. Witt et al. 1997; Schiminovich et al. 2001), of scattered flux is backscattered.
The transmitted flux is given by
| (3) |
with the opacity defined as
| (4) |
The backscattered flux is given by
| (5) |
with
| (6) |
where is the backscattering optical depth of the layer at a depth .
From the exciting flux due the illuminating radiation field, we derive the dust emissivity which will be used to calculate the exciting flux due to the dust emission. In the plane-parallel approximation, we can estimate this contribution as
| (7) |
with the dust emissivity resulting from the illuminating radiation field , the density profile and the extinction opacity between the depth and as defined by eq. 4. The 1/2 factor is related to the fact that the dust emission is assumed to be isotropic and that consequently, half the power emitted at a depth does not reach the depth , since the dust scattering cross section is very low at the relevant wavelengths. Note that for the studied depth (), an iterative computation of the dust emission contribution to the dust heating is not required since the mid and near IR dust emission, which contributes significantly to the dust heating is mostly emitted by the dust at low depth, whose heating is completely dominated by the UV-visible photons of the illuminating radiation field.
We can finally derive the dust emissivity as a function of the depth in the cloud, as excited by .
6 Modelling the Horsehead nebula

Due to its almost edge-on geometry, the Horsehead nebula can be modelled using plane-parallel geometry.
The radiation field is characterized by and corresponding to an O9.5V star (Schaerer & de Koter 1997) located at a distance of 3.5 pc from the cloud. We use the density profile deduced by Habart et al. (2005) from a comparison of model gas emission profiles to observations of H2, CO and dust emission:
| (8) |
with , (10″) and =4. We integrate the output emissivity along the line of sight to obtain intensities in units of , those of our data. We further impose a length for the PDR along the line of sight, namely, . We neglect the absorption at these wavelengths since the visual extinction range between as function of in the line of sight along the Horsehead. As in Habart et al. (2005), we perform a 6° rotation of the PDR to the line of sight.
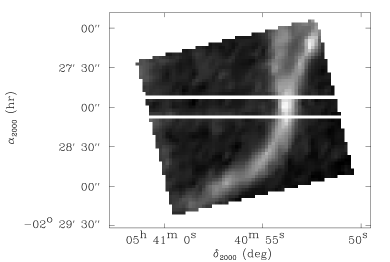
6.1 Emission profiles
Fig. 6 shows observed and modelled profiles at 7-9 m and 22-24 m normalized to the peak value. These spectral ranges are unambiguously related to the AIBs (7-9 m) and the mid-IR continuum (22-24 m) which was not the case for the ISOCAM-LW3 (12-18 m) broad band which contains both mid-IR continuum and certain AIBs (the 12.7 16.4, 17.1 m). Modelled profiles were convolved by a Gaussian whose width corresponds to the IRS spatial resolution at the corresponding wavelengths (1.9″at 7-9 m and 5.5″at 22-24 m). The observed profile is defined as the mean over the strip shown in Fig. 6. Both the observed and modelled angular offsets are defined with respect to the peak emission position at 7-9 m. We can then see that the mid-IR continuum (22-24 m) and AIB (7-9 m) emission peak at the same depth in the cloud and are well reproduced by the model.
Although we take into account the profile broadening caused by the point spread function and by the tilt of the illuminated ridge, we see that the modelled profiles are narrower than the observed one. This must be related to differences between our plane-parallel representation and the real geometry of the Horsehead nebula (e.g. multiple filaments superimposed). The absolute intensity of the mid-IR continuum (22-24 m) at the peak position can be reproduced if = 0.08 pc. This value is only 20% lower than that found by Habart et al. (2005). However, the modelled AIB intensity is then 2.4 times higher than the observed one (i.e would have required = 0.033 pc for the absolute intensity to be reproduced). We can then conclude that taking the radiative transfer effect into account, ”Cirrus dust” properties cannot explain the observed AIBs/mid-IR continuum ratio.


6.2 Spectral comparison
The AIBs excess with respect to the mid-IR continuum can also be seen in Fig. 7. In both model and observations, spectra of this figure are defined as the average over positions whose intensities at 7-9 m are at least 2/3 of the peak values. For the observed spectra, we must ensure that we are looking at the same position within the cloud (i.e. same depth) since we are looking at wavelengths ranging from 5 to 33 m whose spatial resolution are not the same. We therefore bring the resolution at all wavelengths to 7.9″, i.e., that of the 33 m by convolving the spectra with a Gaussian of appropriate width. For the modelled spectra, we simply smooth with a Gaussian of 7.9″width. As already seen above with the 7-9 m and 22-24 m profile comparison, the modelled spectrum shows an excess of AIB emission relatively to the mid-IR continuum. Furthermore, the model shows that the mid-IR continuum in the IRS range is dominated by VSG emission. We can therefore discuss the AIBs to mid-IR continuum ratio in terms of PAH/VSG relative abundance.
Fig. 7 also shows the case where the PAH abundance is reduced by a factor of 2.4 with respect to that of Cirrus: the match to the data then becomes very good. We thus conclude that the PAH abundance relative to VSGs is 2.4 times higher in the Cirrus medium than at the peak emission position of the Horsehead Nebula.
6.3 Effect of differential excitation

Here we discuss and quantify the effect on the mid-IR emission spectrum of differential excitation of PAHs and VSGs due to radiative transfer. As discussed in § 5.1, differences in the absorption cross sections can have an impact on the relative excitation of different dust populations depending on the spectral shape of the exciting radiation field.
Fig. 8 shows the modelled 7-9 m / 22-24 m (i.e AIBs / mid-IR continuum) ratio evolution as the function of the optical depth into the cloud for the Horsehead Nebula model as describe above. The dust properties used are those of Cirrus. The column density (output of the model) was converted to with the Bohlin et al. (1978) ratio, . We see that the ratio increases by 25% at and then decreases by a factor of 4.5 at 10. Fig. 8 also shows that the 7-9 m / 22-24 m ratio evolution is related to the evolution of the absorbed power by PAHs and VSGs (per C atom) as a function of depth. Note that differences between the two curves are related to the fact that variations of the temperature distribution of PAHs and VSGs (which involve stochastic heating) as a function of the optical depth also cause spectral shape evolution of the individual population emission spectra.


Qualitatively, this evolution of the absorbed power ratio can be understood by looking at the spectral evolution of the exciting radiation field (upper panel Fig. 9) and the cross sections of PAHs and VSGs per C atom (lower panel Fig. 9). The absorption cross section of PAHs is greater than those of VSGs for 1.5 m and lower for m. Hence, the reddening of the exciting radiation field caused by extinction successively favours PAH and VSG excitation.
We emphasize that the observed AIBs to mid-IR continuum ratio of the Horsehead nebula cannot be explained by such differential excitation. In fact, the 7-9 m / 22-24 m ratio is equal to 0.9 for the peak emission spectra (Fig. 7), compared to the Cirrus value of 2.1. In the model, the peak emission occurs at (where the profile at 7-9 m is equal to 2/3 of the peak value following the definition of the peak spectrum). For this depth, the ratio does not vary by more than 13% of the Cirrus value. To account for the observed variations with only the radiative transfer effect, the mid-IR spectrum at the peak position should be emitted by dust at a depth of 7, corresponding to a decrease of more than three orders of magnitude of the dust mid-IR emissivity compared to 0.
7 Modelling of NGC2023N
As already pointed out in section 4 (see also Abergel et al. 2002), unlike for the Horsehead nebula, we spatially resolve the spectral shape evolution in NGC2023N. For the two spectra of Fig. 3, the 7-9 m / 22-24 m ratio goes from 1.9 close to the star (lower spectrum of Fig. 3) to 0.4 for the northern position (upper spectrum of Fig. 3). The former must be emitted by a relatively diffuse medium around the star just at the external edge of the dense illuminated ridge traced by the H2 = 1-0 S(1) emission while the latter is emitted by denser gas at the ridge.
7.1 The cavity spectrum
It is interesting to note that the 7-9 m / 22-24 m ratio of the spectrum from the diffuse illuminated part of the PDR (1.9) is close to the Cirrus value (2.1). As shown in Fig. 10, the observed spectra can be reproduced by the model by using Cirrus dust properties. The modelled spectrum was obtained by considering a star of = 23700 K and = 6 (for B1.5V star) located at 0.3 pc which corresponds to the 150″ between the star and the location of the observed spectrum for a distance of 400 pc. The slope of the continuum emission is reproduced by applying an extinction of 1.25 between the star and the emitting dust. Less extinction would result in hotter BGs and in a too steep slope of the continuum while more extinction would result in colder BGs and a slope not steep enough. That extinction is consistent with the presence of matter in the cavity (Witt et al. 1984; Burgh et al. 2002). Moreover, this value of 1.25 caused by the cavity matter is of the same order as that reported between the Earth and the star by Burgh et al. (2002), which is 1.4. It is not solely the extinction that allows us to adjust the BG emission. Considering the error bars on the distance estimate of NGC2023, an underestimation of this distance would cause an underestimation of the applied dilution of the star radiation field in the model. The absolute intensity of the modelled spectrum matches that of the observed one for a column density of (in the line of sight).
As suggested in section 4, we see that the non-linear rise of the mid-IR continuum can be explained by a significant emission of BGs at m while according to the model the continuum emitted by the VSGs is mostly linear. Note that the intensity of the exciting radiation field after dilution and extinction is 120 (in unit of the Habing (1968) field between 6 and 13.6 eV) which is enough for the BGs to emit noticeably in the IRS spectral range.
BGs do not emit significantly in the 22-24 m range at this position and will be colder further from the star which make them emit at longer wavelengths. The decrease by a factor of 5 of the 7-9 m / 22-24 m ratio may then be related to the evolution of the PAH/VSG relative emission, as in the Horsehead case. This is coherent with the linear shape of the mid-IR continuum for the observed spectrum deep into the dense ridge (Upper spectrum of Fig. 3)
AIB spectrum is also well reproduced by the Cirrus PAH properties which suggest similar properties of these emitters in the diffuse medium around the star and in Cirrus.
7.2 The spectral shape evolution
As seen in Fig.3, the spectral shape evolves in the dense ridge traced by the H2 = 1-0 S(1) emission located just after the location of the studied cavity spectrum. As in the case of the Horsehead, we can model the evolution of the 7-9 m / 22-24 m emission ratio as a function of the optical depth into the dense illuminated ridge in order to quantify the radiative transfer effects. Unlike the Horsehead nebula, the density profile is not constrained. However, as reported by Field et al. (1998) (see references therein), the density must range between and in the dense illuminated ridge as shown through the use of steady-state PDR models to study the brighter part of NGC2023. The simplest model for the dense ridge is then a density wall illuminated by the B1.5V star located at 0.3 pc. The radiation field of the star that illuminates the ridge must be extinguished with 1.25 to be consistent with the value of the extinction at the location of the studied cavity spectrum, which is the position where the dense ridge arises. Note that this extinction corresponds to a constant density of for the cavity.


Fig.11 shows the result obtained for the 7-9 m / 22-24 m emission ratio as a function of the optical depth in the dense ridge for densities of and . We can see that results for the two different densities are similar and also are similar to the result obtained in the Horsehead case. Hence, radiative transfer effects cannot explain the spectral variation in NGC2023N since a depth of 12 is required to explain the value of 0.4 for the 7-9 m / 22-24 m ratio observed in the deep/dense part of the ridge. Such an extinction would cause a decrease of more than 3 orders of magnitude of the the 22-24 m dust emissivity compared to the edge of the ridge ( 1.25) while the observed intensity increases from 70 MJy sr-1 to 100 MJy sr-1 between the cavity spectrum and the deep/dense ridge spectrum. We can conclude that the PAH/VSG relative abundance increases by up to a factor of 5 from the deep/dense part to the diffuse/illuminated part of NGC2023N. Moreover, dust properties in the diffuse medium surrounding the star in NGC2023 must be the same as in the diffuse high galactic latitude medium (Cirrus).
8 Conclusion
We presented mid-IR spectral imaging observations of the Horsehead nebula and NGC2023N obtained with the infrared spectrograph on board the Spitzer Space Telescope. These observations allow us to confirm the AIBs / mid-IR continuum evolution at dense illuminated ridges already observed with the Infrared Space Observatory (e.g. Abergel et al. 2002; Rapacioli et al. 2005).
We developed a new dust emission model based on the Désert et al. (1990) model. This model successfully reproduces the emission and the extinction curve of the diffuse interstellar medium at high galactic latitude (i.e. the Cirrus). The Cirrus dust properties are then used as a reference to be compared to dust properties in the two studied PDRs. This dust emissivity model is coupled to a radiative transfer model in order to properly take into account excitation effects on the mid-IR spectral shape evolution.
For the PDRs studied here, we conclude that excitation effects cannot account for the observed AIBs / mid-IR continuum evolution. We interpret this evolution in term of PAH/VSG relative abundance variation since these two species dominate the 5-35 m spectrum of the two studied PDRs except at m for positions close to the star (in the cavity) in NGC2023 where the BG continuum is significant.
In the Horsehead Nebula case, we do not spatially resolve any spectral variation. We conclude from the study of 7-9 m (AIBs) and 22-24 m (mid-IR continuum) emission profiles and of the spectrum at the emission peak position that the PAH/VSG relative abundance is 2.4 times lower than in the Cirrus. In NGC2023N, we resolve the spectral variation. We modelled the spectrum of the diffuse medium around the star for a position at the external edge of the dense illuminated ridge traced by H2 = 1-0 S(1). This spectrum can be reproduced by using Cirrus dust properties. We attributed the decrease of a factor of 5 of the 7-9 m / 22-24 m (AIBs / mid-IR continuum) from the diffuse illuminated part to the deep/dense part of the PDR to a decrease of the PAH/VSG relative abundance to 1/5 of the Cirrus value. It then seems that dust properties evolve fully ”from dense to diffuse” properties within the small spatial scale of the dense illuminated ridge. Note that the obtained PAH / VSG relative abundance for the ”unresolved” Horsehead is almost the median between the diffuse and dense part of NGC2023N, indicating the mean properties of the observed very small particles in the Horsehead.
An increase of the PAH/VSG relative abundance from the dense/deep to the diffuse illuminated part of the PDR is fully consistent with a scenario of photoevaporation PAH clusters (i.e, of the VSGs) (e.g. Cesarsky et al. 2000; Rapacioli et al. 2005; Berné et al. 2007). Other physical processes could explain this variation, such as (i) the scenario evoked in Jones (2005) of the evolution of aliphatic hydrocarbons (which do not emit AIBs) which are present in the dense media (e.g. Jones et al. 1990; Jones 1990; Dartois et al. 2007) into aromatic hydrocarbons under the effect of the UV radiation field (e.g. Dartois et al. 2005; Jones et al. 1990), (ii) the release (”decoagulation”) of the VSGs and PAHs from the dust aggregates (present in dense clouds) at different depths into the PDRs or (iii) a size segregation effect due to the grain dynamics induced by the anisotropic radiation field, as already mentionned for NGC2023 by Abergel et al. (2002). All these processes could be at work with different efficiencies depending on the depth into the cloud and/or on the size and nature of dust.
This strong evolution of the PAH relative abundance between the dense and diffuse medium in PDRs could be a clue for the interpretation of the observed (PAH 8 m)/24 m and (PAH 8 m)/160 m variations in the SINGS galaxies (e.g. Bendo et al. 2008). Such a PAH relative abundance evolution in the bright IR emitters that are PDRs will have an impact on the estimation of the star formation activity of galaxies using PAH emission.
Acknowledgements.
The authors wish to acknowledge all the members of the SPECPDR team for their contribution to the success of the proposal. We would like to thank the referee for a constructive report. This work is based on Spitzer and ISO observations. ISO was an ESA project with instruments funded by ESA Member States and with the participation of ISAS and NASA. Spitzer is operated by the Jet Propulsion Laboratory, California Institute of Technology under a contract with NASA.References
- Abergel et al. (2002) Abergel, A., Bernard, J. P., Boulanger, F., et al. 2002, A&A, 389, 239
- Abergel et al. (1996) Abergel, A., Boulanger, F., Delouis, J. M., Dudziak, G., & Steindling, S. 1996, A&A, 309, 245
- Abergel et al. (1994) Abergel, A., Boulanger, F., Mizuno, A., & Fukui, Y. 1994, ApJ, 423, L59
- Abergel et al. (2003) Abergel, A., Teyssier, D., Bernard, J. P., et al. 2003, A&A, 410, 577
- Allers et al. (2005) Allers, K. N., Jaffe, D. T., Lacy, J. H., Draine, B. T., & Richter, M. J. 2005, ApJ, 630, 368
- Anthony-Twarog (1982) Anthony-Twarog, B. J. 1982, AJ, 87, 1213
- Arendt et al. (1998) Arendt, R. G., Odegard, N., Weiland, J. L., et al. 1998, ApJ, 508, 74
- Barnard (1919) Barnard, E. E. 1919, ApJ, 49, 1
- Bendo et al. (2008) Bendo, G. J., Draine, B. T., Engelbracht, C. W., et al. 2008, MNRAS, accepted, arXiv:0806.2758
- Berné et al. (2007) Berné, O., Joblin, C., Deville, Y., et al. 2007, A&A, 469, 575
- Bohlin et al. (1978) Bohlin, R. C., Savage, B. D., & Drake, J. F. 1978, ApJ, 224, 132
- Boulanger et al. (1996) Boulanger, F., Abergel, A., Bernard, J.-P., et al. 1996, A&A, 312, 256
- Boulanger et al. (1998) Boulanger, F., Abergel, A., Bernard, J. P., et al. 1998, in ASP Conf. Ser. 132: Star Formation with the Infrared Space Observatory, ed. J. Yun & L. Liseau, 15–+
- Boulanger et al. (1990) Boulanger, F., Falgarone, E., Puget, J. L., & Helou, G. 1990, ApJ, 364, 136
- Boulanger et al. (2005) Boulanger, F., Lorente, R., Miville Deschênes, M. A., et al. 2005, A&A, 436, 1151
- Burgh et al. (2002) Burgh, E. B., McCandliss, S. R., & Feldman, P. D. 2002, ApJ, 575, 240
- Cardelli et al. (1989) Cardelli, J. A., Clayton, G. C., & Mathis, J. S. 1989, ApJ, 345, 245
- Castor et al. (1975) Castor, J., McCray, R., & Weaver, R. 1975, ApJ, 200, L107
- Cesarsky et al. (2000) Cesarsky, D., Lequeux, J., Ryter, C., & Gérin, M. 2000, A&A, 354, L87
- Clayton et al. (2003) Clayton, G. C., Wolff, M. J., Sofia, U. J., Gordon, K. D., & Misselt, K. A. 2003, ApJ, 588, 871
- Compiègne et al. (2007) Compiègne, M., Abergel, A., Verstraete, L., et al. 2007, A&A, 471, 205
- Dartois et al. (2007) Dartois, E., Geballe, T. R., Pino, T., et al. 2007, A&A, 463, 635
- Dartois et al. (2005) Dartois, E., Muñoz Caro, G. M., Deboffle, D., Montagnac, G., & D’Hendecourt, L. 2005, A&A, 432, 895
- Désert et al. (1990) Désert, F.-X., Boulanger, F., & Puget, J. L. 1990, A&A, 237, 215
- Draine (2003) Draine, B. T. 2003, ApJ, 598, 1017
- Draine & Anderson (1985) Draine, B. T. & Anderson, N. 1985, ApJ, 292, 494
- Draine & Lee (1984) Draine, B. T. & Lee, H. M. 1984, ApJ, 285, 89
- Draine & Li (2001) Draine, B. T. & Li, A. 2001, ApJ, 551, 807
- Field et al. (1998) Field, D., Lemaire, J. L., Pineau des Forets, G., et al. 1998, A&A, 333, 280
- Fitzpatrick & Massa (1986) Fitzpatrick, E. L. & Massa, D. 1986, ApJ, 307, 286
- Fitzpatrick & Massa (1988) Fitzpatrick, E. L. & Massa, D. 1988, ApJ, 328, 734
- Fitzpatrick & Massa (1990) Fitzpatrick, E. L. & Massa, D. 1990, ApJS, 72, 163
- Flagey et al. (2006) Flagey, N., Boulanger, F., Verstraete, L., et al. 2006, A&A, 453, 969
- Freyer et al. (2003) Freyer, T., Hensler, G., & Yorke, H. W. 2003, ApJ, 594, 888
- Gatley et al. (1987) Gatley, I., Hasegawa, T., Suzuki, H., et al. 1987, ApJ, 318, L73
- Giard et al. (1994) Giard, M., Lamarre, J. M., Pajot, F., & Serra, G. 1994, A&A, 286, 203
- Goicoechea et al. (2006) Goicoechea, J. R., Pety, J., Gerin, M., et al. 2006, A&A, 456, 565
- Habart et al. (2008) Habart, E., Abergel, A., Boulanger, F., et al. 2008, A&A, submitted
- Habart et al. (2005) Habart, E., Abergel, A., Walmsley, C. M., Teyssier, D., & Pety, J. 2005, A&A, 437, 177
- Habart et al. (2004) Habart, E., Boulanger, F., Verstraete, L., Walmsley, C. M., & Pineau des Forêts, G. 2004, A&A, 414, 531
- Habart et al. (2001) Habart, E., Verstraete, L., Boulanger, F., et al. 2001, A&A, 373, 702
- Habing (1968) Habing, H. J. 1968, Bull. Astron. Inst. Netherlands, 19, 421
- Harvey et al. (1980) Harvey, P. M., Thronson, Jr., H. A., & Gatley, I. 1980, ApJ, 235, 894
- Henyey & Greenstein (1941) Henyey, L. G. & Greenstein, J. L. 1941, ApJ, 93, 70
- Hily-Blant et al. (2005) Hily-Blant, P., Teyssier, D., Philipp, S., & Gusten, R. 2005, A&A, 440, 909
- Hollenbach & Tielens (1997) Hollenbach, D. J. & Tielens, A. G. G. M. 1997, ARA&A, 35, 179
- Houck et al. (2004) Houck, J. R., Roellig, T. L., van Cleve, J., et al. 2004, ApJS, 154, 18
- Joblin et al. (2005) Joblin, C., Abergel, A., Bernard, J.-P., et al. 2005, in IAU Symposium, Vol. 235, IAU Symposium, 194P–+
- Joblin et al. (1992) Joblin, C., Leger, A., & Martin, P. 1992, ApJ, 393, L79
- Johnstone et al. (2006) Johnstone, D., Matthews, H., & Mitchell, G. F. 2006, ApJ, 639, 259
- Jones (1990) Jones, A. P. 1990, MNRAS, 247, 305
- Jones (1997) Jones, A. P. 1997, in ASP Conf. Ser. 122: From Stardust to Planetesimals, ed. Y. J. Pendleton, 97–+
- Jones (2004) Jones, A. P. 2004, in ASP Conf. Ser. 309: Astrophysics of Dust, ed. A. N. Witt, G. C. Clayton, & B. T. Draine, 347–+
- Jones (2005) Jones, A. P. 2005, in IAU Symposium, ed. D. C. Lis, G. A. Blake, & E. Herbst, 89–+
- Jones et al. (1990) Jones, A. P., Duley, W. W., & Williams, D. A. 1990, QJRAS, 31, 567
- Kelsall et al. (1998) Kelsall, T., Weiland, J. L., Franz, B. A., et al. 1998, ApJ, 508, 44
- Kim et al. (1994) Kim, S.-H., Martin, P. G., & Hendry, P. D. 1994, ApJ, 422, 164
- Laor & Draine (1993) Laor, A. & Draine, B. T. 1993, ApJ, 402, 441
- Laureijs et al. (1991) Laureijs, R. J., Clark, F. O., & Prusti, T. 1991, ApJ, 372, 185
- Li & Draine (2001) Li, A. & Draine, B. T. 2001, ApJ, 554, 778
- Mathis (1990) Mathis, J. S. 1990, ARA&A, 28, 37
- Mathis et al. (1983) Mathis, J. S., Mezger, P. G., & Panagia, N. 1983, A&A, 128, 212
- Mathis et al. (1977) Mathis, J. S., Rumpl, W., & Nordsieck, K. H. 1977, ApJ, 217, 425
- Miville-Deschênes et al. (2000) Miville-Deschênes, M.-A., Boulanger, F., Abergel, A., & Bernard, J.-P. 2000, A&AS, 146, 519
- Pech et al. (2002) Pech, C., Joblin, C., & Boissel, P. 2002, A&A, 388, 639
- Peeters et al. (2002) Peeters, E., Hony, S., Van Kerckhoven, C., et al. 2002, A&A, 390, 1089
- Peeters et al. (2004) Peeters, E., Mattioda, A. L., Hudgins, D. M., & Allamandola, L. J. 2004, ApJ, 617, L65
- Perryman et al. (1997) Perryman, M. A. C., Lindegren, L., Kovalevsky, J., et al. 1997, A&A, 323, L49
- Pety et al. (2007a) Pety, J., Goicoechea, J. R., Gerin, M., et al. 2007a, in SF2A-2007: Semaine de l’Astrophysique Francaise,, ed. Barret, D. and Casoli, F. and Lagache, G. and Lecavelier, A. and Pagani, L., 223–+
- Pety et al. (2007b) Pety, J., Goicoechea, J. R., Hily-Blant, P., Gerin, M., & Teyssier, D. 2007b, A&A, 464, L41
- Pety et al. (2005) Pety, J., Teyssier, D., Fossé, D., et al. 2005, A&A, 435, 885
- Philipp et al. (2006) Philipp, S. D., Lis, D. C., Güsten, R., et al. 2006, A&A, 454, 213
- Pound et al. (2003) Pound, M. W., Reipurth, B., & Bally, J. 2003, AJ, 125, 2108
- Rapacioli et al. (2005) Rapacioli, M., Joblin, C., & Boissel, P. 2005, A&A, 429, 193
- Savage & Mathis (1979) Savage, B. D. & Mathis, J. S. 1979, ARA&A, 17, 73
- Schaerer & de Koter (1997) Schaerer, D. & de Koter, A. 1997, A&A, 322, 598
- Schiminovich et al. (2001) Schiminovich, D., Friedman, P. G., Martin, C., & Morrissey, P. F. 2001, ApJ, 563, L161
- Schutte et al. (1993) Schutte, W. A., Tielens, A. G. G. M., & Allamandola, L. J. 1993, ApJ, 415, 397
- Sellgren (1984) Sellgren, K. 1984, ApJ, 277, 623
- Smith et al. (2007) Smith, J. D. T., Draine, B. T., Dale, D. A., et al. 2007, ApJ, 656, 770
- Stepnik et al. (2003) Stepnik, B., Abergel, A., Bernard, J.-P., et al. 2003, A&A, 398, 551
- Teyssier et al. (2004) Teyssier, D., Fossé, D., Gerin, M., et al. 2004, A&A, 417, 135
- Verstraete & Léger (1992) Verstraete, L. & Léger, A. 1992, A&A, 266, 513
- Verstraete et al. (2001) Verstraete, L., Pech, C., Moutou, C., et al. 2001, A&A, 372, 981
- Ward-Thompson et al. (2006) Ward-Thompson, D., Nutter, D., Bontemps, S., Whitworth, A., & Attwood, R. 2006, MNRAS, 369, 1201
- Warren & Hesser (1977) Warren, Jr., W. H. & Hesser, J. E. 1977, ApJS, 34, 115
- Weingartner & Draine (2001a) Weingartner, J. C. & Draine, B. T. 2001a, ApJ, 548, 296
- Weingartner & Draine (2001b) Weingartner, J. C. & Draine, B. T. 2001b, ApJS, 134, 263
- Werner et al. (2004a) Werner, M. W., Roellig, T. L., Low, F. J., et al. 2004a, ApJS, 154, 1
- Werner et al. (2004b) Werner, M. W., Uchida, K. I., Sellgren, K., et al. 2004b, ApJS, 154, 309
- Witt et al. (1997) Witt, A. N., Friedmann, B. C., & Sasseen, T. P. 1997, ApJ, 481, 809
- Witt et al. (1984) Witt, A. N., Schild, R. E., & Kraiman, J. B. 1984, ApJ, 281, 708
- Zubko et al. (2004) Zubko, V., Dwek, E., & Arendt, R. G. 2004, ApJS, 152, 211