Submillimeter water and ammonia absorption by the peculiar interstellar medium in the gravitational lens of the PKS 1830211 system
Using the Atacama Pathfinder Experiment (APEX) telescope we have detected the rotational ground-state transitions of ortho-ammonia and ortho-water toward the redshift absorbing galaxy in the PKS 1830211 gravitational lens system. We discuss our observations in the context of recent space-borne data obtained for these lines with the SWAS and Odin satellites toward Galactic sources. We find commonalities, but also significant differences between the interstellar media in a galaxy at intermediate redshift and in the Milky Way. Future high-quality observations of the ground-state ammonia transition in PKS 1830211, together with inversion line data, will lead to strong constraints on the variation of the proton to electron mass ratio over the past 7.2 Gyr.
Key Words.:
Cosmology: observations — Gravitational Lensing — Astrochemistry — ISM: abundances — ISM – molecules1 Introduction
The gravitational lens system involving the bright compact radio and millimeter source PKS 1830211 is remarkable for several reasons: A distant quasi-stellar object (QSO) at a redshift, , of 2.507 (Lidman et al., 1999) is imaged into two strong, milliarcsecond (mas) size sources separated by mas, corresponding to 7.3 kpc at 111Throughout this paper we are using a cosmology with km s-1 Mpc-1, , and (Spergel et al., 2007). 1 arcsecond corresponds to 7.54 kpc. (Jin et al., 2003). These components appear embedded in extended emission, part of which, at high resolution, presents an Einstein ring (Subrahmanyan et al., 1990; Jauncey et al., 1991).
Through an act of “cosmic conspiracy”, the line of sight to the background QSO passes through or near several galaxies (Meylan et al., 2005) and, placed at Galactic longitude and latitude , the bulge of the Milky Way, causing local neutral hydrogen (HI) absorption (Subrahmanyan et al., 1992). Courbin et al. (2002) give a historical summary of this complex picture. Most importantly, the line of sight passes through a spiral galaxy at a redshift of (Winn et al., 2002), in which continuum emission from the QSO is absorbed in lines of atomic hydrogen and hydroxyl (OH) (Chengalur et al., 1999; Koopmans & de Bruyn, 2005) and transitions from a variety of molecules in the interstellar media of two different spiral arms (Wiklind & Combes, 1996, 1998). The much deeper absorption has its centroid at (zero velocity in the heliocentric frame) and is toward the south-western (SW) image (Frye et al., 1997; Muller et al., 2006), which is rendered undetectable at optical wavelengths by the dust mixed with the molecular material (Winn et al., 2002). The absorption appears to be caused by material in a spiral arm of the lensing galaxy at projected distance of ′′ from the galaxy’s center (3 kpc), clearly defined in the -image presented by these authors. We note that in the Milky Way the bulk of the molecular gas is distributed between Galactocentric radii of 4 and 7 kpc (Bronfman et al., 1988).
Wiklind & Combes (1998) detected a second, weaker absorption cloud shifted by km s-1 () relative to the primary absorption and toward the NE image (Muller et al., 2006), whose location is displaced by ′′ (4.4 kpc) from galaxy’s center.
For completeness, we mention that there is another HI absorber at that absorbs the NE and, weaker, the SW image as well as part of PKS 1830211’s extended emission (Lovell et al., 1996). The nature of this low opacity () system’s host is uncertain but possibly we are dealing with another intervening spiral galaxy of low surface brightness. No molecular absorption has been detected toward it (Wiklind & Combes, 1998).
T. Wiklind and F. Combes detected absorption in CO and in a number of molecules with (much) higher dipole moments, namely HCN, HCO+, CS, and N2H+ (Wiklind & Combes, 1996, 1998). Menten et al. (1999) added C2H, HC3N, and C3H2 to this list. A number of rare isotopologues of C-, N-, O-, and S-bearing species were imaged by Muller et al. (2006), who found isotopic ratios differing from Milky Way values. Menten et al. (1999) compared PKS 1830211’s molecular make-up with Galactic dark clouds and found many similarities. Recently, Henkel et al. (2008) observed a total of ten metastable inversion transitions of ammonia (NH3) and found the observations to be consistent with 80–90% of the ammonia-bearing gas being warm ( K). Amazingly, to explain the intensities of the lines at high energy levels (up to 1000 K above the ground-state) they have to invoke a hot K medium for which in the Milky Way the only known counterpart would be the Sgr B2 region near the Galactic center (Huettemeister et al., 1995; Wilson et al., 2006).
Redshifted absorbers provide the possibility to detect spectral lines that are unobservable from the ground due to attenuation by the Earth’s atmosphere, namely low excitation water (H2O) lines that cause the bulk of the terrestrial absorption. This was exploited by Combes & Wiklind (1997), who discovered absorption in the ground-state transition of ortho-water (o-H2O) toward the “other” rich molecular intermediate-redshift () system B0218+357. The terrestrial, pressure-broadened H2O line near 557 GHz causes the broadest range of absorption in the Earth’s atmosphere below 1 THz, rendering the GHz around it practically impossible to observe from the ground, even from the excellent 5100 m high site of the APEX telescope. Considerable effort was put in the investigation of this line in the Milky Way; it was a main motivation for two space missions, the Submillimeter Wave Astronomy Satellite (SWAS Melnick et al., 2000) and Odin (Nordh et al., 2003; Hjalmarson et al., 2003). Among many other things, Odin also delivered the first astronomical detection of the ground-state transition of ammonia, NH3, which near 572 GHz is also unobservable from the ground due to absorption from the 557 GHz H2O line’s broad line wings.
Here we report the detection of the H2O and the NH3 ortho-ground-state rotational lines toward PKS 1830211 with the APEX telescope222APEX observations of the H2O line toward PKS 1830211 have been announced previously by Wiklind & Combes (2005). In §2 we describe the observations and data reduction. Our results are presented in §3 and their analysis in §4. Astrochemical implications of our study are discussed in 5.
2 Observations and data reduction
Our observations were made in 2007 July 2–5 under generally good weather conditions with APEX, the 12-m Atacama Pathfinder Experiment telescope (Güsten et al., 2006). Opacities at the observing frequencies ( GHz) were between 0.02 and 0.12 throughout the observations and (single sideband) system temperature between 240 and 390 K. We observed the ortho-ground state lines of water (H2O) and ammonia (NH3) , namely the H2O and the NH3 transitions. These were redshifted from their rest frequencies of and MHz to observing frequencies, , of 295328.3 and 303580.4 and MHz, respectively. We assumed the redshift accurately determined from mm-/cm-wavelength absorption measurements, namely . All spectra are presented with velocities in the heliocentric frame; add 12.1 km s-1 for LSR velocities.
Both lines were measured in the lower sideband (LSB) with the APEX 2a facility receiver (Risacher et al., 2006). Calibration was obtained using the chopper wheel technique, considering the different atmospheric opacities in the signal and image sidebands of the employed double sideband receivers. To ensure flat spectral baselines, the newly available wobbling secondary was chopped with a frequency of 1.5 Hz and a throw of about the cross elevation axis. The wobbler was operated in symmetric mode, which means that source and off position are interchanged between subsequent subscans, which cancels any asymmetries in the optical paths. Such observations deliver a reliable estimate of the continuum level. The radiation was analyzed with the MPIfR Fast Fourier Transform spectrometer, which provides 16384 frequency channels over the 1 GHz intermediate frequency bandwidth (Klein et al., 2006). To increase the signal to noise ratio, the spectra were smoothed to effective velocity resolutions appropriate for the measured linewidths, i.e., 4.0 and 3.9 km s-1 for the H2O and NH3 lines, respectively. To check the telescope pointing, drift scans were made across the strong continuum sources Sgr B2 N, G10.47+0.03, Jupiter, and Mars. Pointing corrections were derived from these measurements. The pointing was found to be accurate to within , acceptable given the FWHM beam size, , which is FWHM at 300 GHz.
We have converted our line intensities, measured with the chopper wheel technique, into a flux density, , scale (i.e., in Jansky units), assuming the aperture efficiency observationally determined by Güsten et al. (2006) at 352 GHz and higher frequencies extrapolated to 300 GHz; 1 K of antenna temperature corrected for above the atmosphere corresponds to 37.7 Jy. We present our observed spectra in Fig. 1 with the continuum levels indicated (see 3.1). No baselines were subtracted from these spectra.
3 Results
3.1 Continuum intensities
In the double-sideband APEX 2a receiver, the two sidebands are 12 GHz apart and continuum emission from both sidebands is detected. The effective center frequencies for the determination of the continuum levels are 301.3 and 309.6 GHz, respectively, for the two sidebands. We determine continuum levels, , of 1.73 Jy at the former and 1.65 Jy at the latter frequency, respectively. Given the absolute calibration uncertainties, which we estimate at 10%, the difference between the two measurements is not significant. Keeping in mind that PKS 1830211 is highly variable, we note that our flux densities are higher than the 1.3 Jy measured with the Large APEX Bolometer Camera (LABOCA) shortly before our observations, i.e., in 2007 May (A. Weiss and F. Schuller, personal communication). The LABOCA’s effective (filter-averaged) frequency is 345 GHz, 49 GHz higher than the H2O line frequency. If PKS 1830211’s submillimeter flux did not vary between then and the time of our measurements, comparison of our and the LABOCA data shows that the trend of dropping flux with increasing frequency continues at least up to 345 GHz.
We estimate the uncertainties of our absolute flux density calibration and the systematic uncertainties in the optical depth determinations (see §3.3) to be %. This means that the uncertainties in the optical depth determinations are dominated by the limited signal-to-noise ratio of the line measurements.
3.2 The magnification ratio and covering factor
With our FWHM beam we are detecting the sum of the continuum flux densities from the NE and the SW images. However, from interferometric imaging it is clear that observed absorption at zero velocity (relative to ) only arises toward the weaker SW image (Frye et al., 1997; Menten et al., 1999; Muller et al., 2006). Thus, we must correct the observed apparent optical depths to true optical depths taking this into account. We here define the “magnification ratio”, , for PKS 1830211 as the ratio of the radio or (sub)millimeter flux densities of the stronger NE to the weaker SW image. Due to time delay between the two ray paths, this ratio is temporally variable, but if one accounts for that, has been estimated in the radio regime (Lovell et al., 1998). Observations with the IRAM Plateau de Bure Interferometr (PdBI) taken between 1995 and 2003 in the 3 mm wavelength range show – 1.75 (Muller et al., 2006), with a best value of 1.66. The flux density of the SW image is . Note that here the “covering factor” , which accounts for the fact that only the SW image is absorbed, ranges from 0.36 to 0.40, corresponding to the range in given above. What fraction of that image’s few mas/few pc size area is absorbed is not considered and is assumed to be near unity as suggested by Very Long Baseline Array (VLBA) observations (Carilli et al., 1998).
3.3 Observed and corrected optical depths
A Gaussian fit to the H2O line yields a peak line signal, , of Jy, and an integrated line signal, dv, of Jy km s-1, an FWHM linewidth, v, of 44 (5) km s-1 and velocity offset, v, of km s-1 relative to . Using this line and the continuum flux density derived in §3.1 (10% uncertainty for the latter), we calculate an apparent optical depth,
| (1) |
of and a velocity-integrated apparent optical depth, of 15.0 km s-1.
For the NH3 line we find Jy, dv = Jy km s-1, v = 34 (7) km s-1, and v km s-1, yielding and km s-1.
Replacing with in the above equation and considering that , we obtain a true optical depth of and 61 km s-1 for its velocity-integrated value. This means that from our data we cannot give an upper bound for the line’s opacity.
For the NH3 line we calculate and 22 km s-1 for the true optical depth and its velocity-integrated value, respectively.
For a spectral line from an upper level , with energy , to a lower level , with energy , the column density in the upper level is
| (2) |
where is the excitation temperature, the Einstein A coefficient; and are the Planck and Boltzmann constants, respectively, and is the speed of light. is the line’s rest frequency. In convenient units,
| (3) |
The total column density is given by
| (4) |
where is the line’s upper level degeneracy and is the partition function for the rotation temperature, . We assume Local Thermodynamic Equilibrium (LTE), which means .
4 Analysis
4.1 Water vapor absorption
For the H2O transition, and s-1, where and denote the and energy levels, respectively. To consider the state of thermalization of this line, we examine the rates for collisional deexcitation from the level, which are accessible at the website of the Leiden Atomic and Molecular Database (LAMDA)333http://www.strw.leidenuniv.nl/ moldata/ (Schöier et al., 2005). The calculations of Grosjean et al. (2003) for collisions between ortho-H2 and ortho-H2O at low temperatures (5–20 K), extended to higher temperatures (140 K) by Phillips et al. (1996), yield rate coefficients for transitions from the upper to the lower level, , between and cm3s-1 for kinetic temperatures between 5 and 80 K, where the latter number applies for the bulk of the gas from which absorption in the ammonia inversion transitions is also observed (Henkel et al., 2008). This implies a critical density, , of several times cm3, which is very much higher than any plausible value of the hydrogen density of the absorbing material. It is therefore straightforward to assume that the H2O level populations are thermalized at the temperature of the cosmic microwave background, . In other words, in Eqn. 3 is equal to K = 5.145 K. Using these values and the lower limit to integrated optical depth discussed in §3.3, i.e. 0.7 km s, with , Eqn. 3 gives an upper level column density of cm-2.
Noting that the ortho-H2O partition function for this temperature, , is , we can use Eqn. 4 to find that the total ortho-H2O column density, o-H2O), is cm-2, 182.14 times larger than and, from detailed balance, that almost all ortho-H2O molecules (99.45%) are in the ground-state level! To verify this, we used the non-LTE radiative transfer program RADEX444http://www.strw.leidenuniv.nl/ moldata/radex.html created and made available to the community by van der Tak et al. (2007) to perform statistical equilibrium calculations. For a set of input excitation conditions, namely background temperature (5.145 K), kinetic temperature, and H2 density, RADEX calculates level populations with column density and line width as radiative transfer input parameters and returns the excitation temperatures and optical depths of user-selected spectral lines.
Running RADEX, we find that for densities up to cm-3 the excitation temperature does not become significantly larger than . For the line width derived in §3 RADEX returns the optical depth value discussed above () for an ortho-H2O column density of cm-2, close to above estimate. This result is independent of all plausible values of the kinetic temperature and densities up to cm-3.
We emphasize that the above estimate is calculated for the lower limit of the true integrated optical depth derived in §3.3 and a strict lower limit. The upper uncertainty bound of the optical depth is not determinable from our noisy data.
4.2 Ammonia absorption
For the NH3 transition, and for the transition . These values include factors for nuclear spin degeneracies. The very different Einstein A coefficients for these lines are s-1 and s-1, respectively.
Deexcitation rates for collisions of H2 with ortho-NH3 have been calculated by Danby et al. (1988) and are also accessible at the LAMDA website. We find that the rate for collisional deexcitation, , from the to the level for temperatures between 15 and 300 K varies little and is between and cm3s-1. The critical density of the transition, , is, thus, cm-3, which is, as in the case of the H2O line discussed above, many orders of magnitude higher than the densities (of order a few times cm-1) of the absorbing interstellar medium (ISM) in PKS 1830211. It is therefore also clear that the population of the NH3 relative to the level is controlled by the cosmic microwave background temperature. Using Eqn. 3, we calculate cm-2 for the column density of the level. We can calculate the ortho-NH3 partition function by direct summation with parameters from LAMDA and get, assuming K, . Using Eqn. 4 we find that the total ortho-NH3 column density, o-NH, is cm-2, 70 times larger than .
Again using RADEX, we find that to reproduce our observed opacity (0.62 at a line width of 34 km s-1) requires an ortho-ammonia column density, (o-NH, of cm-2. For K, a quarter of all ortho-NH3 molecules are in the ground-state level while, in contrast to o-H2O, the majority of molecules are in other energy levels. We used a kinetic temperature of 80 K (see §1 and Henkel et al., 2008) but note that lower temperatures would only imply a 20% lower column density at the most.
5 Discussion - Abundances and astrochemical implications
To calculate molecular abundances relative to molecular hydrogen, we assume an H2 column density of cm-1 for the absorbing material toward PKS 1830211-SW. This value was estimated by Wiklind & Combes (1996) assuming a CO to H2 ratio of . It is somewhat larger than the cm-2 derived from X-ray observations with the ROSAT satellite (Mathur & Nair, 1997).
With the lower limit to o-H2O) determined above, cm-2 determined above, we find that the ortho-H2O to H2 abundance ratio, (o-H2O), is greater than . To put this value into context, SWAS observed the same H2O line in a wide variety of Galactic sources (for an overview see Melnick et al., 2000). Snell et al. (2000a) were able to determine H2O abundances, with values similar to our PKS 1830211 number, toward dense quiescent regions of molecular clouds (between and ), with values near the higher number found in the core regions of Giant Molecular Clouds (GMCs; see also Bergin et al., 2000).
Several observational effects have to be considered concerning the SWAS results: The regions toward which SWAS detected the H2O line at low abundance are core regions of molecular clouds, some of them GMCs, i.e., regions of enhanced density and thus, enhanced column density, producing high enough optical depths to make the line detectable. They are quiescent in the sense they don’t harbor outflows. Whereas toward the spatially confined regions harboring outflows, as evidenced by broad line wings and other tracers, SWAS finds several orders of magnitude higher H2O abundances (Bergin et al., 2000, 2003). Similarly, higher H2O abundances are found near the warmer interfaces to HII regions (Snell et al., 2000b). SWAS gives little information, just rough upper limits, on water in the lower density extended gas of giant molecular clouds, simply because the expected line intensities are prohibitively low. Similarly, only coarse upper limits (around – relative to H2) can be derived toward cold dark clouds such as TMC-1, L134N, or B335, which also have lower average densities ( cm-4) than warm GMC cores. Moreover, their low temperatures (K) are not conducive for producing emission in the line, whose upper energy level is 34 K above ground.
The size of the FWHM beam of SWAS at the H2O line rest frequency (557 GHz) for a region at distance (measured in kpc) corresponds to an area of size . This means that for sources at a few kpc distance, similar size scales are sampled as for PKS 1830211 with the VLBA beam of Carilli et al. (1998), which has a FWHM of 1 mas (7.5 pc at ). Indeed, the SWAS H2O spectrum of the W 33 region which, at a (near-kinematic) distance of 4 kpc, has a width of km s-1 full width at zero power (FWZP)555Intriguingly, the W33 spectrum shows absorption against the source’s strong submillimeter continuum emission in its central velocity range.. This is very wide for a quiescent cloud core which, as the low H2O abundance suggests, does not contain outflows. The width could be determined by a combination of the presence of velocity gradients in the region unresolved by the beam and the existence of emission from several spiral arms caused by the line of sight crossing the plane of the Galaxy. Alternately, an outflow could be present, which actually is suggested by emission from the outflow tracer SiO from which lines of width comparable to the H2O line’s are observed toward W33 (Miettinen et al., 2006). In that case, the apparent low H2O abundance could result from the superposition of a compact (i.e. beam diluted) higher-abundance outflow component and a more extended component of much lower abundance.
Even in comparison to the relatively broad H2O emission toward W33, the 55–60 km s-1 FWZP width of the PKS 1830211-SW absorption appears extraordinarily broad, especially since we are viewing the lensing galaxy close to face-on and the 2 milliarcsecond size absorption “pencil beam” afforded by the size of the background source corresponds to a scale of 15 pc, smaller than a single GMC. Interferometric observations of the local face-on spiral M51 with a resolution corresponding to a much larger pc reveal linewidths only between 10 and 20 km s-1 in the galaxy’s spiral arms (Aalto et al., 1999).
The probability of a random line of sight passing through a cloud core certainly is lower than passing through a lower density, more “normal”, region of a GMC. The H2O abundance in the bulk volume of molecular clouds is essentially unknown and, for the above reasons, SWAS or ODIN cannot deliver very meaningful limits. As the multi-molecule studies of galactic absorption against extragalactic radio sources conducted by H. Liszt and R. Lucas have persuasively demonstrated, all the other molecules found toward PKS 1830211 can be detected in general molecular ISM gas (Lucas & Liszt, 2000; Liszt & Lucas, 2001; Liszt et al., 2004; Liszt & Lucas, 2004; Liszt et al., 2006). However, as explained in the following, the gas absorbing PKS 1830211 appears to have a much higher temperature.
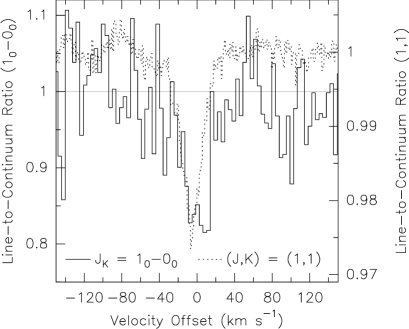
Using the NRAO Green Bank Telescope, Henkel et al. (2008) detected absorption in the NH3 inversion lines toward PKS 1830211 for up to 10, which arise from levels with energies between 23 and 1036 K above ground. Fig. 2 compares our spectrum of the line with their spectrum. There appears to be excess absorption in the former at velocities km s-1, although the signal-to-noise ratio is rather limited. If real, this would be difficult to explain since, given that the absorbed region is larger at the redshifted (1,1) frequency (12.56 GHz) than at the frequency, one would expect the opposite. Higher signal to noise data obtainable with the Submillimeter Array seem highly desirable!
Henkel et al. (2008) find that to explain the observed inversion line optical depths, 80–90% of the NH3 must be in warm (80 K) gas with a total ortho- plus para-NH3 column density of cm-2, if the excitation temperature (assumed to be the same for all lines) equals . When modeling the clouds in their SWAS sample, Snell et al. (2000b) assumed temperatures between 25 and 40 K for the GMC cores, as determined from observations of other tracers, which is significantly lower than the 80 K quoted above. Moreover, the kinetic temperatures of 25–30 K derived by Liszt et al. (2006) from the NH3 (1,1) and (2,2) lines are substantially lower. This poses an interesting question: Is the absorbing cloud much hotter than Galactic clouds or could a dilute warm molecular component in the Milky Way (and other galaxies) so far have escaped observational attention?
The ortho-NH3 column density determined by us is a factor of 2 lower than the value derived from inversion lines (Henkel et al., 2008). Interestingly, a much larger discrepancy seems to exist between the NH3 column density derived from the Odin spectrum (Liseau et al., 2003) and the much higher value implied by the (1,1) and (2,2) inversion lines mapped by Zeng et al. (1984) toward the dark cloud Oph A.
6 Outlook – constraints on variation of fundamental constants
Comparing the redshifts of various spectral lines measured toward the same high- object can in principle yield constraints on possible temporal variations of fundamental constants over significant parts of the age of the Universe (see, e.g. Curran et al., 2004). A precondition is that the lines in question have different dependencies on the constants, e.g., the fine structure constant, , and/or the ratio of the mass of the proton to that of the electron, . Traditionally exploited with optical/UV quasar absorption lines, the method has recently been applied to radio and millimeter absorption lines toward, amongst others, the gravitational lens systems PMN J01340931 (Kanekar et al., 2005) and B0218+357 (Murphy et al., 2008).
The ammonia molecule is especially interesting with respect to this, as its inversion transitions are strongly dependent on : Flambaum & Kozlov (2007) find that the fractional change in frequency of these transitions is given by or, in other words, . For fractional variations of rotational line frequencies, , in contrast, the proportionality factor is unity, i.e., . Comparing NH3 inversion line redshifts with redshifts of rotational lines should thus provide sensitive limits on the variation of .
Murphy et al. (2008) compare the measured redshifts of the NH3 and lines observed toward B0218+357 by Henkel et al. (2005) with rotational lines from HCO+ and HCN and obtain over a look-back time of 6.2 Gyr, corresponding to the absorber’s redshift of 0.68466. One fundamental limitation of this measurement is the uncertainty over the two species’ possibly different distributions leading to different covering factors. Different covering factors might also result from source size variations between 14 GHz (NH3) and 105 GHz (HCO+ and HCN). In addition, lines from different species might also cover different velocity ranges.
The ortho-ground-state rotational transition of NH3 we have detected toward PKS 1830211 can in principle deliver a more accurate and meaningful comparison between the redshifts of a rotational line redshift and of the inversion lines, which have been determined by Henkel et al. (2008); see §1). The velocity accuracy of our APEX measurement (2.5 km s-1) translates into a redshift uncertainty, , of and a value of of , which is three times larger than the value derived by Murphy et al. (2008) for B0218+357.
Our NH3 spectrum is of very limited quality and even looks quite different from the (1,1) spectrum (see Fig. 2), although that can be attributed to the former line’s poor signal-to-noise ratio. A few hour long observation with the Submillimeter Array (Ho et al., 2004) will result in a much improved spectrum, which, together with the (1,1) spectrum could lead to a significant advancement in investigating the variation of over the past 7.2 Gyr.
Acknowledgements.
We would like to thank Gary Melnick for useful comments on this paper.References
- Aalto et al. (1999) Aalto, S., Hüttemeister, S., Scoville, N. Z., & Thaddeus, P. 1999, ApJ, 522, 165
- Bergin et al. (2003) Bergin, E. A., Kaufman, M. J., Melnick, G. J., Snell, R. L., & Howe, J. E. 2003, ApJ, 582, 830
- Bergin et al. (2000) Bergin, E. A., Melnick, G. J., Stauffer, J. R., et al. 2000, ApJ, 539, L129
- Bronfman et al. (1988) Bronfman, L., Cohen, R. S., Alvarez, H., May, J., & Thaddeus, P. 1988, ApJ, 324, 248
- Carilli et al. (1998) Carilli, C. L., Menten, K. M., Reid, M. J., Rupen, M., & Claussen, M. 1998, in Astronomical Society of the Pacific Conference Series, Vol. 144, IAU Colloq. 164: Radio Emission from Galactic and Extragalactic Compact Sources, ed. J. A. Zensus, G. B. Taylor, & J. M. Wrobel, 317
- Chengalur et al. (1999) Chengalur, J. N., de Bruyn, A. G., & Narasimha, D. 1999, A&A, 343, L79
- Combes & Wiklind (1997) Combes, F. & Wiklind, T. 1997, ApJ, 486, L79
- Courbin et al. (2002) Courbin, F., Meylan, G., Kneib, J.-P., & Lidman, C. 2002, ApJ, 575, 95
- Curran et al. (2004) Curran, S. J., Kanekar, N., & Darling, J. K. 2004, New Astronomy Review, 48, 1095
- Danby et al. (1988) Danby, G., Flower, D. R., Valiron, P., Schilke, P., & Walmsley, C. M. 1988, MNRAS, 235, 229
- Flambaum & Kozlov (2007) Flambaum, V. V. & Kozlov, M. G. 2007, Physical Review Letters, 98, 240801
- Frye et al. (1997) Frye, B., Welch, W. J., & Broadhurst, T. 1997, ApJ, 478, L25
- Grosjean et al. (2003) Grosjean, A., Dubernet, M.-L., & Ceccarelli, C. 2003, A&A, 408, 1197
- Güsten et al. (2006) Güsten, R., Nyman, L. Å., Schilke, P., et al. 2006, A&A, 454, L13
- Henkel et al. (2008) Henkel, C., Braatz, J. A., Menten, K. M., & Ott, J. 2008, A&A, 485, 451
- Henkel et al. (2005) Henkel, C., Jethava, N., Kraus, A., et al. 2005, A&A, 440, 893
- Hjalmarson et al. (2003) Hjalmarson, Å., Frisk, U., Olberg, M., et al. 2003, A&A, 402, L39
- Ho et al. (2004) Ho, P. T. P., Moran, J. M., & Lo, K. Y. 2004, ApJ, 616, L1
- Huettemeister et al. (1995) Huettemeister, S., Wilson, T. L., Mauersberger, R., et al. 1995, A&A, 294, 667
- Jauncey et al. (1991) Jauncey, D. L., Reynolds, J. E., Tzioumis, A. K., et al. 1991, Nature, 352, 132
- Jin et al. (2003) Jin, C., Garrett, M. A., Nair, S., et al. 2003, MNRAS, 340, 1309
- Kanekar et al. (2005) Kanekar, N., Carilli, C. L., Langston, G. I., et al. 2005, Physical Review Letters, 95, 261301
- Klein et al. (2006) Klein, B., Philipp, S. D., Krämer, I., et al. 2006, A&A, 454, L29
- Koopmans & de Bruyn (2005) Koopmans, L. V. E. & de Bruyn, A. G. 2005, MNRAS, 360, L6
- Lidman et al. (1999) Lidman, C., Courbin, F., Meylan, G., et al. 1999, ApJ, 514, L57
- Liseau et al. (2003) Liseau, R., Larsson, B., Brandeker, A., et al. 2003, A&A, 402, L73
- Liszt & Lucas (2001) Liszt, H. & Lucas, R. 2001, A&A, 370, 576
- Liszt & Lucas (2004) Liszt, H. & Lucas, R. 2004, A&A, 428, 445
- Liszt et al. (2004) Liszt, H., Lucas, R., & Black, J. H. 2004, A&A, 428, 117
- Liszt et al. (2006) Liszt, H. S., Lucas, R., & Pety, J. 2006, A&A, 448, 253
- Lovell et al. (1998) Lovell, J. E. J., Jauncey, D. L., Reynolds, J. E., et al. 1998, ApJ, 508, L51
- Lovell et al. (1996) Lovell, J. E. J., Reynolds, J. E., Jauncey, D. L., et al. 1996, ApJ, 472, L5
- Lucas & Liszt (2000) Lucas, R. & Liszt, H. S. 2000, A&A, 358, 1069
- Mathur & Nair (1997) Mathur, S. & Nair, S. 1997, ApJ, 484, 140
- Melnick et al. (2000) Melnick, G. J., Stauffer, J. R., Ashby, M. L. N., et al. 2000, ApJ, 539, L77
- Menten et al. (1999) Menten, K. M., Carilli, C. L., & Reid, M. J. 1999, in Astronomical Society of the Pacific Conference Series, Vol. 156, Highly Redshifted Radio Lines, ed. C. L. Carilli, S. J. E. Radford, K. M. Menten, & G. I. Langston, 218
- Meylan et al. (2005) Meylan, G., Courbin, F., Lidman, C., Kneib, J.-P., & Tacconi-Garman, L. E. 2005, A&A, 438, L37
- Miettinen et al. (2006) Miettinen, O., Harju, J., Haikala, L. K., & Pomrén, C. 2006, A&A, 460, 721
- Muller et al. (2006) Muller, S., Guélin, M., Dumke, M., Lucas, R., & Combes, F. 2006, A&A, 458, 417
- Murphy et al. (2008) Murphy, M. T., Flambaum, V. V., Muller, S., & Henkel, C. 2008, Science, 320, 1611
- Nordh et al. (2003) Nordh, H. L., von Schéele, F., Frisk, U., et al. 2003, A&A, 402, L21
- Phillips et al. (1996) Phillips, T. R., Maluendes, S., & Green, S. 1996, ApJS, 107, 467
- Risacher et al. (2006) Risacher, C., Vassilev, V., Monje, R., et al. 2006, A&A, 454, L17
- Schöier et al. (2005) Schöier, F. L., van der Tak, F. F. S., van Dishoeck, E. F., & Black, J. H. 2005, A&A, 432, 369
- Snell et al. (2000a) Snell, R. L., Howe, J. E., Ashby, M. L. N., et al. 2000a, ApJ, 539, L97
- Snell et al. (2000b) Snell, R. L., Howe, J. E., Ashby, M. L. N., et al. 2000b, ApJ, 539, L101
- Spergel et al. (2007) Spergel, D. N., Bean, R., Doré, O., et al. 2007, ApJS, 170, 377
- Subrahmanyan et al. (1992) Subrahmanyan, R., Kesteven, M. J., & Te Lintel Hekkert, P. 1992, MNRAS, 259, 63
- Subrahmanyan et al. (1990) Subrahmanyan, R., Narasimha, D., Pramesh-Rao, A., & Swarup, G. 1990, MNRAS, 246, 263
- van der Tak et al. (2007) van der Tak, F. F. S., Black, J. H., Schöier, F. L., Jansen, D. J., & van Dishoeck, E. F. 2007, A&A, 468, 627
- Wiklind & Combes (1996) Wiklind, T. & Combes, F. 1996, Nature, 379, 139
- Wiklind & Combes (1998) Wiklind, T. & Combes, F. 1998, ApJ, 500, 129
- Wiklind & Combes (2005) Wiklind, T. & Combes, F. 2005, in Bulletin of the American Astronomical Society, Vol. 37, Bulletin of the American Astronomical Society, 1424
- Wilson et al. (2006) Wilson, T. L., Henkel, C., & Hüttemeister, S. 2006, A&A, 460, 533
- Winn et al. (2002) Winn, J. N., Kochanek, C. S., McLeod, B. A., et al. 2002, ApJ, 575, 103
- Zeng et al. (1984) Zeng, Q., Batrla, W., & Wilson, T. L. 1984, A&A, 141, 127