Simulating the formation of a proto–cluster at
Abstract
We present results from two high–resolution hydrodynamical simulations of proto–cluster regions at . The simulations have been compared to observational results for the so-called Spiderweb galaxy system, the core of a putative proto–cluster region at , found around a radio galaxy. The simulated regions have been chosen so as to form a poor cluster with (C1) and a rich cluster with (C2) at . The simulated proto-clusters show evidence of ongoing assembly of a dominating central galaxy. The stellar mass of the brightest cluster galaxy (BCG) of the C2 system is in excess with respect to observational estimates for the Spiderweb galaxy, with a total star formation rate which is also larger than indicated by observations. We find that the projected velocities of galaxies in the C2 cluster are consistent with observations, while those measured for the poorer cluster C1 are too low compared to the observed velocities. We argue that the Spiderweb complex resemble the high–redshift progenitor of a rich galaxy cluster. Our results indicate that the included supernovae feedback is not enough to suppress star formation in these systems, supporting the need of introducing AGN feedback. According to our simulations, a diffuse atmosphere of hot gas in hydrostatic equilibrium should already be present at this redshift, and enriched at a level comparable to that of nearby galaxy clusters. The presence of this gas should be detectable with future deep X–ray observations.
keywords:
Cosmology – Methods: N–body simulations – hydrodynamics – galaxies: clusters1 Introduction
Within the standard cosmological model of structure formation, galaxy clusters trace regions where the hierarchical build up of galaxies and their interaction with the inter-galactic medium (IGM) proceed at a somewhat faster rate compared to regions of the Universe with ‘average’ density. Finding and observing high–redshift progenitors of galaxy clusters can provide invaluable information on the processes which led to their formation and evolution. The most distant clusters to date have been identified out to from deep X–ray and infra-red observations (e.g. Mullis et al., 2005; Eisenhardt et al., 2008; Stanford et al., 2005, and references therein). A powerful technique, that extends these studies to higher redshift, is to search for overdensities of emission line galaxies in the neighbourhood of luminous high-redshift radio galaxies (e.g. Pentericci et al., 1998). Although these regions are expected not to trace virialized clusters, they likely identify the progenitors of present day clusters, offering an unique opportunity to study the evolutionary processes which determine their observational properties. Recently, a number of observations of distant putative proto-clusters, like the one associated with the so–called “Spiderweb Galaxy” at (Miley et al. 2006, M06 hereafter), have demonstrated that these regions are characterised by intense dynamical and star formation activity (e.g. Pentericci et al. 2000, M06, Venemans et al. 2007; Overzier et al. 2008, and references therein).
On the theoretical side, modern cosmological hydrodynamical simulations are now reaching good enough resolution, and include detailed treatments of a number of astrophysical processes, to provide an accurate description of the assembly of galaxy clusters. These simulations are now able to reproduce the basic properties observed for the bulk of the cluster galaxy population at low redshift, while generally predicting too massive and too blue BGCs, due to the absence on an efficient feedback mechanism that suppresses the star formation activity in these galaxies at late times (e.g., Saro et al., 2006; Romeo et al., 2008).
In this Letter we present results from high–resolution simulations of two proto–cluster regions at that we compare to observational results of the Spiderweb galaxy. The aim of this analysis is to verify to what extent simulations of proto–cluster regions in a standard cosmological scenario resemble the observed properties of the Spiderweb complex. Furthermore, we provide predictions for the properties of the proto intra-cluster medium (ICM), in view of future deep X–ray observations of high–redshift proto-cluster regions.
2 The simulated proto–clusters
We analyse simulations of two proto–cluster regions, both selected at redshift , which by will form a relatively poor cluster (C1) and a rich cluster (C2). These two regions have been extracted from two different lower resolution parent cosmological boxes, and resimulated at higher force and mass resolution using the Zoomed Initial Condition (ZIC) technique by Tormen et al. (1997). The parent simulations correspond to two renditions of the CDM cosmological model, with the same values for the parameters , and , and different values for the normalisation of the power spectrum ( for C1 - Borgani et al. 2004, and for C2 - Yoshida et al. 2001, see also cluster g8 high resolution from Dolag et al. 2008).
The Lagrangian regions where mass and force resolutions were increased extend out to virial radii of the clusters at . The total number of high resolution DM particles in these regions is about for C1 and for C2, with an initially similar number of gas particles. The basic characteristics of the simulated clusters at are summarised in Table 1. At , the masses of these clusters are and for C1 and C2 respectively111We define the mass as the mass contained within the radius, , which encompasses an average density of 200 times the critical density.. The mass of each gas particle is for C1, and for C2. The Plummer–equivalent softening scale for the gravitational force is kpc for C1 and kpc for C2, in physical units (e.g. Borgani et al., 2006). We verified that, by suitably rescaling particle velocities in the initial conditions of the C2 cluster so as to decrease to 0.8, the virial mass of this system decreases by about 30 per cent, both at and at .
The simulations were carried out using the TreePM–SPH GADGET-2 code (Springel, 2005), including the effective star formation model by Springel & Hernquist (2003) and the chemical enrichment model by Tornatore et al. (2007). The effective model of star formation assumes that dense star–forming gas particles have a cold neutral and a hot ionised component, in pressure equilibrium. The cold component represents the reservoir for star forming material.
Within the adopted stochastic scheme of star formation, each gas particle can spawn three star particles, with mass for C1, and for C2. The chemical enrichment model assumes a Salpeter shape (Salpeter, 1955) for the stellar initial mass function (IMF), and uses the same yields and stellar lifetimes adopted in Fabjan et al. (2008). The simulations also include the kinetic feedback from galactic outflows introduced by Springel & Hernquist (2003). We assume for the wind velocity, and a mass upload rate equal to two times the local star formation rate. With these choices, the kinetic energy of the outflows is roughly equal to all the energy available from SNII for the adopted IMF.
| Cluster | |||||||
|---|---|---|---|---|---|---|---|
| C1 | 2.9 | 234.7 | 1.2 | 491 | 3.6 | 1.7 | 0.37 |
| C2 | 21.9 | 452.6 | 6.6 | 1571 | 41.3 | 4.7 | 0.46 |
Galaxies are identified by applying the SKID algorithm222http://www-hpcc.astro.washington.edu/tools/skid.html (Stadel, 2001) to the distribution of star particles, using the procedure described in Murante et al. (2007). We identify as “bona fide” galaxies only those SKID–groups containing at least 32 star particles after the removal of unbound stars. Each star particle is treated as a single stellar population (SSP), with formation redshift , metallicity , and appropriate IMF. Luminosities in different bands are computed using the spectro-photometric code GALAXEV (Bruzual & Charlot, 2003), as explained in Saro et al. (2006). We have computed luminosities of galaxies in the two HST ACS camera (observer frame) filters F475W () and F814W (). All magnitudes given in the following are AB magnitudes. The effect of dust attenuation is included by adopting the two-component model by Charlot & Fall (2000), in a similiar way as described in De Lucia & Blaizot (2007) (see also Fontanot et al. 2008). We have divided our analysed box into a grid of cubic cells of linear size . We have then computed the optical depth , contributed by each cell, as
| (1) |
where , is the mass of cold gas within the cell, is the mean metallicity of this gas, and is the proton mass. The resulting optical depth is much less than unity for the majority of the lines of sight, while it is in the regions of most intense star formation, where reaches values of about a thousand.
The dust–attenuated luminosity contributed by a star particle, having age and coordinates at the position can be computed as:
| (2) |
where is the optical depth at the wavelength and is related to by the relation
| (3) |
where is drawn randomly from a Gaussian distribution with mean 0.3 and width 0.2, truncated at 0.1 and 1 (De Lucia & Blaizot 2007, see also Kong et al. 2004).
3 Results
Mass and luminosity of proto-cluster galaxies. Fig. 1 shows the projected stellar mass density maps for C1 (left panel) and C2 (right panel). Simulated maps extends in projection along the whole high-resolution region and are kpc on a side, covering an area which roughly corresponds to the physical size of the ACS images for the assumed cosmology. The maps in Fig. 1 are qualitatively similar to observations of the Spiderweb complex (M06), in particular for the C1 cluster, where the most massive galaxy is surrounded by several galaxies of comparable mass in the process of merging to form a dominant central object. The C2 cluster shows evidence of ongoing merging processes onto the BCG, which exhibits a double peaked stellar mass density. In both clusters, a dominant central galaxy is already in place.
Both clusters have a conspicuous population of inter–galactic stars. The presence of a massive BCG and the visual impression of a significant ongoing merging activity suggest that the merging processes associated to the BCG assembly might be responsible (at least in part) for the generation of the intra–cluster light (e.g. Zibetti et al., 2005; Murante et al., 2007; Pierini et al., 2008). Within the region shown, the diffuse stellar component contributes 16 and 30 per cent of the total stellar mass for C1 and C2 respectively. We also note the presence of several elongated galaxies, similar to the tadpole galaxies observed in the Spiderweb complex (M06).
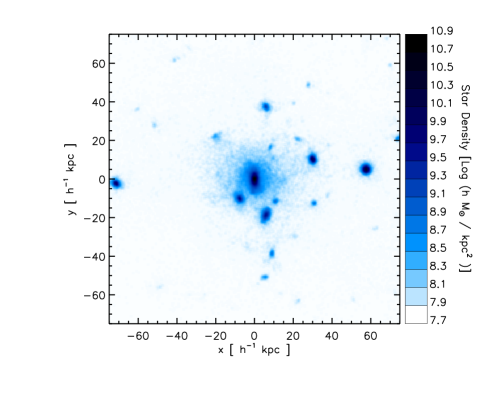
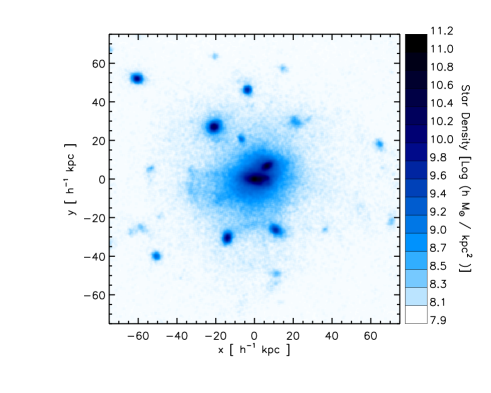
The BCG of the C2 cluster has a stellar mass of , about 6 times more massive that the BCG of C1, which is . The second most massive galaxy in the cluster C1 is about a factor four less massive than the BCG, while the second most massive galaxy in the cluster C2 is about a factor ten less massive than the corresponding BCG. Pentericci et al. (1998) estimated the stellar mass of the radio-galaxy in the Spiderweb complex from its -band luminosity. They found a value of , comparable to the mass of the C1 BCG, but much less massive than the C2 BCG.
Fig. 2 shows the luminosity functions (LFs) of the galaxies identified in the two regions shown in Fig. 1, in the F814W() ACS filter band, including the dust correction described in the previous section. Observational determination by H08333The luminosity function published by H08 did not include the correction factor (R.A. Overzier, private communication). We have included this correction in the observed luminosity function plotted in Fig. 2 are also shown as a dotted histogram. With the adopted dust correction, the luminosity of the C1 BCG is comparable to the observed one, while that of the C2 BCG is about one magnitude brighter than observed. Interestingly, the brightest galaxy in the C2 cluster is not the central galaxy, but a massive galaxy at the edge of the analyzed box (it corresponds to the galaxy at the position and in the right panel of Fig. 1). This particular galaxy appears to be quite massive but not star forming (see Fig. 3). It does not have a significant cold gas reservoir and therefore is only weakly attenuated. The BCGs are indicated by shaded regions in Fig. 2, and appear to be in reasonable agreement with observational measurements. This is in apparent contradiction with the above mentioned evidence for a too large mass of the C2 BCG. This can be explained by the very large star formation rates that are associated to the C2 BCG (see below), which can turn into an excessively large dust extinction. Therefore, having reproduced the UV luminosity does not guarantee that we have correctly described the star formation history of the BCG.
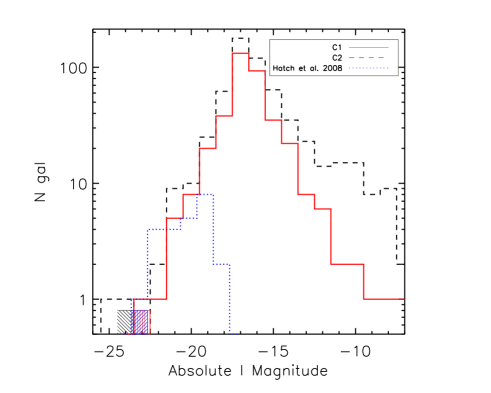
We note that the luminosity functions in our simulations rise steadily at
magnitudes fainter than the completeness limit of the observational data. These
fainter galaxies are expected to contribute to the budget of diffuse light by
an amount which depends of their surface brightness. Summing up the stellar
masses of galaxies fainter than , our simulations predict that
the fraction of diffuse stellar component increases by 8 and 5 per
cent for the C1 and C2 cluster respectively.
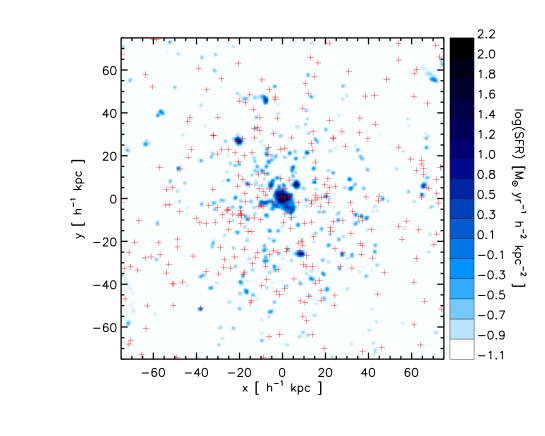
Star formation: Using the observed UV continuum, H08 traced the star formation pattern in the Spiderweb complex, finding evidence of diffuse star formation, not associated to any detected galaxy. We show in Fig. 3 the star formation rate (SFR hereafter) density map for C2 (results are qualitatively similar for C1). Red crosses mark the positions of the half most massive galaxies identified within the analysed region. The star formation in the simulations is computed for each star–forming gas particle (Springel & Hernquist, 2003), so Fig. 3 gives a snapshot of the instantaneous SFR. The total SFR in the region considered is M⊙/yrs for C1 and M⊙/yrs for C2. H08 suggest a total SFR for the Spiderweb system of M⊙/yrs within an area of 65 kpc2 without any dust correction. Assuming a minimum dust correction of , they estimate a lower limit of M⊙/yrs, which is reasonably close to the SFR measured for C1, but quite far from our predictions for C2. We note that this excess of star formation for the C2 BCG arises already at and despite a rather strong SN feedback (see Sec. 2).
Comparing the positions of the galaxies with the distribution of the
star formation, it is apparent that they do not always coincide. With
the exclusion of the BCGs, which dominate the total SFR in both
clusters contributing from (C1) to (C2) per cent of the
total SFR, most of the massive galaxies are not strongly star
forming. The total SFR of identified galaxies accounts for 90 per cent
and 81 per cent of the total SFR for the clusters C1 and C2
respectively. The remaining diffuse star formation appears to take
place in clumps, which mainly correspond to halos falling below the
SKID galaxy identification threshold, and only in a few cases are
associated to cold stripped gas. Therefore, as long as the barely
resolved halos are identified with galaxies, our simulations do not
predict any significant diffuse star formation.
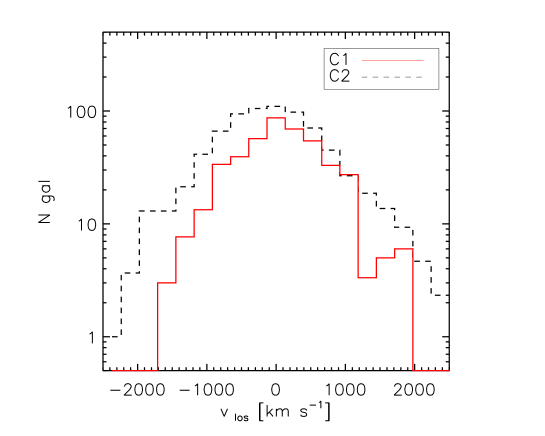
Are the proto-clusters in virial equilibrium? M06 measured line-of-sight velocities for a small number of galaxies and found fairly large values relative to the Spiderweb galaxy, up to almost 2000 for one galaxy. Although the rather limited statistics prevent an accurate virial analysis of the system, these values hint at a rather large virialized mass. By computing the one-dimensional velocity dispersion () for the fifty most massive galaxies contained within (i.e. those which more likely will have a redshift measurement in the Spiderweb complex), we find for C1 and for C2. These velocities are found to be only 6–8 per cent lower than those estimated from the DM particles, suggesting the presence of a small velocity bias. Using the best–fit – relation obtained by Evrard et al. (2008) from a variety of N–body simulations, we obtain for C1, and for C2. These values are similar to the true values (see Table 1), thus demonstrating that virial equilibrium holds within in these proto–cluster regions. We plot in Fig. 4 the velocity distribution of all galaxies found in projection within the same area shown in Fig. 1. The effect of line-of-sight contamination from fore/background galaxies is evident for C1, whose distribution shows an excess of galaxies with velocities . For the C2 cluster, we have a non-negligible probability of measuring a relative velocity as large as 2000 , while this represents a very unlike event for the C1 cluster. Therefore, even within the limited statistics of available observations, the measured velocities for the flies of the Spiderweb system are preferentially expected in a proto-cluster as massive as C2.
Pentericci et al. (2000) measured redshifts for 15 Ly- emitters in the Spiderweb region and found a velocity dispersion (see also Venemans et al. 2007). However, the region sampled by these Ly- observations has a physical size of about , much larger than the expected virialized region. In order to compare with these observational data, we have computed for the 50 most massive galaxies within from the BCGs of our simulated clusters. We find for C1 and for C2. This result indicates again that a proto-cluster as massive as C2 is preferred with respect to the poorer C1 cluster.
The too intense (with respect to observational estimates) star formation that takes place in the C2 BCG suggests that AGN feedback may have already partially quenched star formation in the Spiderweb galaxy. Indeed, the Spiderweb galaxy has been originally identified as a radio–galaxy with extended and distorted radio lobes (Pentericci et al., 1998), consistent with the presence of a “radio–mode” AGN. Furthermore, Nesvadba et al. (2006) carried out an integral-field spectroscopic study of the Spiderweb complex and found evidences for massive outflows of gas which are interpreted as due to the action of AGN feedback.
Predicted X–ray properties: Deep follow-up observations in the X–ray band of a handful of clusters at are now pushing the study of the thermo– and chemo–dynamical properties of the ICM to large look-back times. Although we have probably to wait for the next generation of X–ray satellites to push these studies to , it is interesting to make predictions for the X–ray luminosity, temperature and level of metal enrichment of proto–cluster regions, like the one traced by the Spiderweb galaxy.
Our simulations unambiguously predict that already at , the gravitational potential of proto–cluster regions are permeated by a hot ICM. Indeed, for the C1 and C2 clusters we measure a temperature of about 2 and 5 keV, respectively (see Table 1). The X–ray luminosity of C1 is typical of a nearby group, while that of C2 is comparable to the luminosity of a typical bright nearby cluster. At the redshift of the Spiderweb galaxy, these luminosities correspond to fluxes in the [0.5–2] keV (observer frame) band of about for C1 and for C2, for the cosmological model assumed in our simulations. A fairly high level of enrichment is predicted already at , extending to higher redshift the results obtained out to with Chandra and XMM observations (Balestra et al., 2007; Maughan et al., 2008).
A relatively shallow Chandra observation, with an exposure of 40 ks, has been used by Carilli et al. (2002) to look for an extended X–ray emission around the Spiderweb galaxy. These authors measured a luminosity of (rescaled to our cosmology) in the [2–10] keV band. They also placed an upper limit of for a relaxed cluster athmosphere. For C2, we find a luminosity in the same band of about . A luminosity of the hot gas surrounding the Spiderweb galaxy lower than predicted for C2 can be interpreted as due to a significant heating from the radio galaxy. Clearly, the relatively short exposure time of this observation makes a precise determination of the X-ray from a diffuse hot gas rather uncertain.
The flux predicted for C1 can in principle be reached with a sufficient long exposure with the Chandra and XMM satellites. However, surface brightness dimming and the limited extension of the emission likely prevents it from being detectable as an extended source using available X–ray telescopes. For C2, the predicted flux is comparable to (or brighter than) that of clusters at observed with Chandra and XMM to study the thermal and chemical properties of the ICM. A potential complication for the detection of an extended thermal free–free emission from the hot gas permeating the Spiderweb complex could come from non–thermal X–ray emission associated to star formation and/or generated by the inverse–Compton scattering of a population of relativistic electrons, associated to the radio galaxy, off the CMB photons (Fabian et al., 2003).
Although making a quantitative assessment of the observability of the hot ICM surrounding the Spiderweb galaxy goes beyond the aims of this Letter, we point out that such a target can be well suited to push the capabilities of the present generation of X–ray satellites, while being optimal for large collecting area telescopes of the next generation.
We note that our analysis is based on only two simulations. Clearly, for a better assessment of the capability of current numerical models in reproducing observations of proto–cluster structures it would be ideal to carry out a statistical comparison by enlarging both the set of simulated clusters and the number of observed proto–cluster regions.
4 Conclusions
We have carried out an analysis of high–resolution hydrodynamical simulations of two proto–cluster regions at , with the main purpose of comparing them with the observed properties of the Spiderweb galaxy complex (M06, H08). These proto-clusters will form at a relatively poor and a rich cluster of galaxies (C1 and C2 respectively; see Table 1). The comparison is aimed at demonstrating to what extent predictions from simulations of proto–cluster regions within a CDM framework are able to reproduce the observational properties of the Spiderweb complex, and to shed light on the processes regulating star formation within the deepest potential wells at . The main results of our analysis can be summarised as follows.
-
•
Both simulated proto–clusters are characterised by the presence of a dominant massive central galaxy, surrounded by less massive galaxies in the process of merging, qualitatively resembling the observed Spiderweb galaxy.
-
•
The star formation rate within the C1 proto–cluster () is consistent with the observed one, while the corresponding value for C2 () is in excess with respect to observational measurements.
-
•
The BCG of C1 has an UV luminosity comparable to that of the Spiderweb galaxy, while the BCG of the C2 cluster is about one magnitude brighter.
-
•
The velocity dispersions of our simulated clusters within are consistent with virial equilibrium expectations. In addition, the velocities measured for the galaxies surrounding the Spiderweb system (M06, Venemans et al. 2007) are generally consistent with those of the C2 cluster, while being much larger than those measured for C1.
-
•
The inter-galactic medium permeating the C1 and C2 proto–cluster regions has temperatures of about 2 keV and 5 keV respectively, and both clusters exhibit an enrichment level comparable to that observed in nearby clusters. The predicted X–ray fluxes from thermal bremsstrahlung make these objects potentially detectable as extended sources, and make them ideal targets to study the enrichment of the intra–cluster medium at unprecedented redshift, with X–ray telescopes of the next generation.
The emerging scenario is that the Spiderweb complex likely traces the formation of a rich galaxy cluster, whose virial mass at is . The excess of star formation found in our simulations suggests that an AGN feedback might be necessary already at to quench star formation and regulate the structure of the “cool core” (see also Nesvadba et al., 2006). The search for proto-cluster regions at and their follow–up observations with X–ray telescopes of the next generation will contribute to fill the gap between studies of the thermo- and chemo-dynamics of the ICM and the study of the IGM at .
Acknowledgements
We thank the referee, Brant Robertson, for insightful comments which helped us to improve the presentation of the results. We are indebted to Volker Springel for having provided us with the non–public version of GADGET-2. We thank F. Fontanot, P. Monaco, R. Overzier, P. Rosati, L. Silva, and P. Tozzi for useful discussions and comments on the paper. The simulations used in this study have been carried out at the “Centro Interuniversitario del Nord-Est per il Calcolo Elettronico” (CINECA, Bologna), with CPU time assigned through an INAF–CINECA grant. This work has been partially supported by the INFN PD-51 grant, by the INAF-PRIN06 Grant and by the ASI-COFIS Theory grant.
References
- Balestra et al. (2007) Balestra I., Tozzi P., Ettori S., Rosati P., Borgani S., Norman V. M. C., Viola M., 2007, A&A, 462, 429
- Borgani et al. (2006) Borgani S., Dolag K., Murante G., Cheng L.-M., Springel V., Diaferio A., Moscardini L., Tormen G., Tornatore L., Tozzi P., 2006, MNRAS, 367, 1641
- Borgani et al. (2004) Borgani S., Murante G., Springel V., Diaferio A., Dolag K., Moscardini L., Tormen G., Tornatore L., Tozzi P., 2004, MNRAS, 348, 1078
- Bruzual & Charlot (2003) Bruzual G., Charlot S., 2003, MNRAS, 344, 1000
- Carilli et al. (2002) Carilli C. L., Harris D. E., Pentericci L., Röttgering H. J. A., Miley G. K., Kurk J. D., van Breugel W., 2002, ApJ, 567, 781
- Charlot & Fall (2000) Charlot S., Fall S. M., 2000, ApJ, 539, 718
- De Lucia & Blaizot (2007) De Lucia G., Blaizot J., 2007, MNRAS, 375, 2
- Dolag et al. (2008) Dolag K., Borgani S., Murante G., Springel V., 2008, ArXiv e-prints
- Eisenhardt et al. (2008) Eisenhardt P. R. M., Brodwin M., Gonzalez A. H., Stanford S. A., Stern D., Barmby P., Brown M. J. I., Dawson K., Dey A., Doi M., Galametz A., Jannuzi B. T., Kochanek C. S., Meyers J., Morokuma T., Moustakas L. A., 2008, ArXiv e-prints, 804
- Evrard et al. (2008) Evrard A. E., Bialek J., Busha M., White M., Habib S., Heitmann K., Warren M., Rasia E., Tormen G., Moscardini L., Power C., Jenkins A. R., Gao L., Frenk C. S., Springel V., White S. D. M., Diemand J., 2008, ApJ, 672, 122
- Fabian et al. (2003) Fabian A. C., Sanders J. S., Crawford C. S., Ettori S., 2003, MNRAS, 341, 729
- Fabjan et al. (2008) Fabjan D., Tornatore L., Borgani S., Saro A., Dolag K., 2008, MNRAS, 386, 1265
- Fontanot et al. (2008) Fontanot F., Somerville R.S., Silva L., Monaco P., Skibba R., 2008, MNRAS, submitted
- Kong et al. (2004) Kong X., Charlot S., Brinchmann J., Fall S. M., 2004, MNRAS, 349, 769
- Maughan et al. (2008) Maughan B. J., Jones C., Forman W., Van Speybroeck L., 2008, ApJS, 174, 117
- Miley et al. (2006) Miley G. K., Overzier R. A., Zirm A. W., Ford H. C., Kurk J., Pentericci L., Blakeslee J. P., Franx M., Illingworth G. D., Postman M., Rosati P., Röttgering H. J. A., Venemans B. P., Helder E., 2006, ApJ, 650, L29 (M06)
- Mullis et al. (2005) Mullis C. R., Rosati P., Lamer G., Böhringer H., Schwope A., Schuecker P., Fassbender R., 2005, ApJ, 623, L85
- Murante et al. (2007) Murante G., Giovalli M., Gerhard O., Arnaboldi M., Borgani S., Dolag K., 2007, MNRAS, 377, 2
- Nesvadba et al. (2006) Nesvadba N. P. H., Lehnert M. D., Eisenhauer F., Gilbert A., Tecza M., Abuter R., 2006, ApJ, 650, 693
- Overzier et al. (2008) Overzier R. A., Bouwens R. J., Cross N. J. G., Venemans B. P., Miley G. K., Zirm A. W., Benítez N., Blakeslee J. P., Coe D., Demarco R., Ford 2008, ApJ, 673, 143
- Pentericci et al. (2000) Pentericci L., Kurk J. D., Röttgering H. J. A., Miley G. K., van Breugel W., Carilli C. L., Ford H., Heckman T., McCarthy P., Moorwood A., 2000, A&A, 361, L25
- Pentericci et al. (1998) Pentericci L., Roettgering H. J. A., Miley G. K., Spinrad H., McCarthy P. J., van Breugel W. J. M., Macchetto F., 1998, ApJ, 504, 139
- Pierini et al. (2008) Pierini D., Zibetti S., Braglia F., Böhringer H., Finoguenov A., Lynam P. D., Zhang Y.-Y., 2008, A&A, 483, 727
- Romeo et al. (2008) Romeo A. D., Napolitano N. R., Covone G., Sommer-Larsen J., Antonuccio-Delogu V., Capaccioli M., 2008, MNRAS, pp 793–+
- Salpeter (1955) Salpeter E. E., 1955, ApJ, 121, 161
- Saro et al. (2006) Saro A., Borgani S., Tornatore L., Dolag K., Murante G., Biviano A., Calura F., Charlot S., 2006, MNRAS, 373, 397
- Springel (2005) Springel V., 2005, MNRAS, 364, 1105
- Springel & Hernquist (2003) Springel V., Hernquist L., 2003, MNRAS, 339, 289
- Stadel (2001) Stadel J. G., 2001, Ph.D. Thesis
- Stanford et al. (2005) Stanford S. A., Eisenhardt P. R., Brodwin M., Gonzalez A. H., Stern D., Jannuzi B. T., Dey A., Brown M. J. I., McKenzie E., Elston R., 2005, ApJ, 634, L129
- Tormen et al. (1997) Tormen G., Bouchet F. R., White S. D. M., 1997, MNRAS, 286, 865
- Tornatore et al. (2007) Tornatore L., Borgani S., Dolag K., Matteucci F., 2007, MNRAS, 382, 1050
- Venemans et al. (2007) Venemans B. P., Röttgering H. J. A., Miley G. K., van Breugel W. J. M., de Breuck C., Kurk J. D., Pentericci L., Stanford S. A., Overzier R. A., Croft S., Ford H., 2007, A&A, 461, 823
- Yoshida et al. (2001) Yoshida N., Sheth R. K., Diaferio A., 2001, MNRAS, 328, 669
- Zibetti et al. (2005) Zibetti S., White S. D. M., Schneider D. P., Brinkmann J., 2005, MNRAS, 358, 949