Magneto-transmission of multi-layer epitaxial graphene and bulk graphite:
A comparison
Abstract
Magneto-transmission of a thin layer of bulk graphite is compared with spectra taken on multi-layer epitaxial graphene prepared by thermal decomposition of a SiC crystal. We focus on the spectral features evolving as , which are evidence for the presence of Dirac fermions in both materials. Whereas the results on multi-layer epitaxial graphene can be interpreted within the model of 2D Dirac fermions, the data obtained on bulk graphite can only be explained taking into account the 3D nature of graphite, e.g. by using the standard Slonczewski-Weiss-McClure model.
pacs:
71.70.Di, 76.40.+b, 78.30.-j, 81.05.UwI Introduction
Within the last few years, the properties of massless and massive “relativistic” particles have been probed in magneto-optical experiments carried out on several carbon-based systems: graphene monolayerJiang et al. (2007); Deacon et al. (2007) and bilayer,Henriksen et al. (2008) multi-layer epitaxial graphene,Sadowski et al. (2006, 2007); Plochocka et al. (2008); Orlita et al. (2008a) as well as bulk graphite.Li et al. (2006); Orlita et al. (2008b, c); Garcia-Flores et al. (2008) These experiments offer an important insight into the electronic structure of these materials, in particular, they directly demonstrate the unusual -scaling of Landau levels (LLs) of Dirac fermions. Naturally, these experiments stimulated intensive theoretical work in this area.Iyengar et al. (2007); Gusynin et al. (2007); Abergel and Fal’ko (2007); Koshino and Ando (2008); Bychkov and Martinez (2008)
Recently, remarkable experiments have been performed on the same systems without applied magnetic field. A universal value of optical conductivity was demonstrated in grapheneNair et al. (2008) as well as in bulk graphite.Kuzmenko et al. (2008a) The optical response of graphene monolayer and bilayer samples as a function of the gate voltage was reported in several experimental works, see Refs. Wang et al., 2008; Li et al., 2008a; Kuzmenko et al., 2008b; Zhang et al., 2008, and this topic was addressed also theoretically.McCann et al. (2007); Stauber et al. (2008); Nicol and Carbotte (2008) First results of time-resolved optical experiments on multi-layer graphene are also available.Dawlaty et al. (2008); Sun et al. (2008)
In this paper, we present a direct comparison of the magneto-transmission spectra taken on a thin layer of bulk graphite and multi-layer epitaxial graphene. We focus on spectral features exhibiting a -dependence, which corresponds to the optical response of Dirac fermions, and show that there are essential differences in the spectra of both materials.
II Experimental details
The investigated multi-layer graphene sample was prepared by thermal decomposition on the carbon face of a 4H-SiC substrateBerger et al. (2004, 2006) and contains around 100 graphene layers. The thin layer of bulk graphite was prepared by simple exfoliation as described in Ref. Orlita et al., 2008b. As no significant difference in FIR optical response of natural graphite and HOPG was found,Orlita et al. (2008c) we present only results taken on natural graphite due to its higher crystalline quality. Both samples were characterized using micro-Raman. In the case of multi-layer epitaxial graphene, the Raman signature of decoupled layers, equivalent to a single flake of exfoliated graphene,Ferrari et al. (2006) as well as of additional graphite residuals were found, see Ref. Faugeras et al., 2008. The Raman spectra taken on a thin graphite layer dominantly showed a multi-component 2D band typical of many Bernal-stacked sheets, but some minor traces of decoupled layers were found, see the discussion in Ref. Orlita et al., 2008c.
To measure the FIR transmittance of the sample, the radiation of globar, delivered via light-pipe optics to the sample and detected by a Si bolometer placed directly below the sample, was analyzed by a Fourier transform spectrometer. All measurements were performed in the Faraday configuration with the magnetic field applied normal to graphene/graphite layers. All the spectra were taken with non-polarized light in the spectral range of 5-350 meV, limited further by several regions of low tape transmissivity or the SiC opacity, see grey areas in Fig. 1.
III Results and Discussion
A comparison of the transmission spectra taken on multi-layer epitaxial graphene and a thin layer of bulk graphite is presented in Fig. 1. Starting with results taken on multi-layer layer graphene in Fig. 1a, a series of absorption lines is observed and denoted by Roman letters, following the notation introduced in Ref. Sadowski et al., 2006. Assuming the LL spectrum of graphene, , together with the corresponding selection rules for dipole-allowed transitions , the observed absorption lines B,C,D,E and F can be clearly identified as inter-LL transitions LLm+1 and LLm with and 4, respectively. The Fermi velocity is found to be m.s-1. Hence, these results are fully consistent with a model of 2D Dirac fermions and individual sheets in multi-layer epitaxial graphene indeed behave as if they are electronically decoupled. This was recently explained by a random mutual rotation of adjacent sheets in this material.Hass et al. (2008) Similar spectra were also measured on a single sheet of exfoliated graphene,Jiang et al. (2007) however, the Fermi velocity seems to be enhanced by amount of 10% and these data also suggest some influence of electron-electron interaction, not observed in transmission spectra of multi-layer epitaxial graphene.
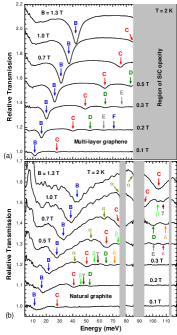
The results obtained on a thin layer of bulk graphite, see Fig. 1b, are more complex. Basically, all the absorption lines observed in multi-layer graphene are also found in spectra of bulk graphite with practically the same Fermi velocity m.s-1. This justifies the same notation using the Roman letters. In addition to these lines, another series of transitions, denoted by Greek letters and clearly exhibiting the -dependence, is present in transmission spectra. These lines cannot be assigned to any dipole-allowed transitions between LLs in graphene. Nevertheless, the energies of the additional lines and exactly match to transitions symmetric around the Dirac point, LLm, with indices and 4, respectively. The line can be identified as transitions LL3(1).
To explain the absorption lines denoted by the Greek letters we have to abandon the simplified model of 2D Dirac fermions and consider the full band structure of bulk graphite. According to the standard SWM model,Slonczewski and Weiss (1958); McClure (1957) Dirac fermions are located in the vicinity of the point, where the bands , and the doubly degenerate are close to the Fermi level. If the magnetic field is applied along the -axis of the crystal, Landau levels or more accurately, Landau bands are created, see Fig. 2, having at the point () an analytical formMcClure (1960); Toy et al. (1977) ():
| (1) |
where denotes the pseudogap, i.e. the distance of (and also ) and bands at and . The parameter is related to the Fermi velocity as .
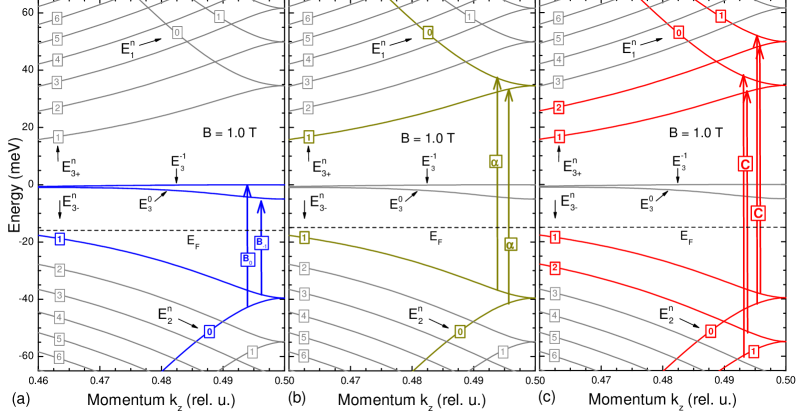
The form of LLs (III) implies several important point-related optical properties of graphite. It suggests that the LL energy spectrum typical of graphene is present also at the point in graphite, when the pseudogap is small in comparison to the energies of the LLs. Experimentally, is found to be significantly below 10 meV, see Refs. Toy et al., 1977; Orlita et al., 2008b; Grüneis et al., 2008, and therefore, the magnetic fields above 100 mT are sufficient to insure this condition. On the other hand, each LL in Eq. (III) is (with the exception of and ) doubly degenerate, and , see Fig. 2. This double degeneracy is in addition to the spin and valley degeneracies present in graphene. Obviously, taking account of the same selection rules , we obtain a considerably richer set of possible dipole-allowed transitions for graphite in comparison to graphene. For instance, the transition LL1 is strictly forbidden in graphene, nevertheless the absorption line at this energy ( transition) is observed in bulk graphite at the point due to the dipole-allowed transitions and , see Fig. 2b. Similarly, the lines and are detected due to transitions and for and 3, respectively. The remaining line can be identified as and . Hence, the presence of absorption lines denoted by Greek letters is qualitatively consistent with the standard SWM model of graphite. Nevertheless, we are aware of inconsistency of our results with predictions of Koshino and Ando.Koshino and Ando (2008) They expect that for graphite layer with several tens or more Bernal-stacked sheets, the intensities of -dependent absorption lines should be negligible in comparison with spectral features arising in massive electrons around the point, which evolve nearly linearly with .
Another difference of spectra Figs. 1a and b is an apparent asymmetry of the B line in bulk graphite at low magnetic fields, whereas the equivalent line in the spectra of multi-layer graphene remains perfectly symmetric. To explain this difference, we must extend our considerations to the near vicinity of the point and take into account the -dependence of LLs. Such LL structure calculated within the standard SWM model is shown in Fig. 2a, where the two components, B0 and B-1 of which the B line consists, are denoted by arrows. Note that the relatively low value of the pseudogap does not allow to directly resolve the splitting of the B line into these components. At low magnetic field, when the Landau band is nearly parallel with and/or when it is partially or completely located above the Fermi level, we can expect rather asymmetrical shape of the B line with a well-pronounced high energy tail due to the transition . With increasing magnetic field, this asymmetry should gradually disappear, as indeed observed experimentally, see Fig. 1b. From the lineshape, we roughly estimate the position of the Fermi level slightly below -20 meV, but the situation is here complicated by the fact that also decoupled graphene layers in graphite, revealed by the Raman spectroscopy or detected in scanning tunneling spectroscopy experiments,Li et al. (2008b) can contribute to the final shape of the B line.
Note, that for the sample of multi-layer graphene investigated here, the fully symmetrical B line survives in transmission spectrum down to magnetic fields of 40 mT, when the Fermi level is located at 7 meV from the Dirac point.Orlita et al. (2008a) The presented transmission experiment thus probes mainly undoped graphene sheets ( cm-2), which are located further from the SiC substrate. The layer(s) in the immediate vicinity of the substrate are highly conductive (above cm-2) and can be probed in transport experiments.Berger et al. (2004, 2006)
Analogous considerations based on the shapes of Landau bands in the vicinity of the H point, can also qualitatively explain the significant differences in widths of individual absorption lines. For instance, the C line is roughly three times broader in comparison to the line, see Fig. 1b, in spite of the fact that they both originate in the same LLs. For a simple explanation of this fact, we just need to realize that the line is composed of transitions and . If we take account of the near vicinity of , we find out that both pairs of these LLs are nearly parallel, see Fig. 2b, and give thus a rather sharp line in comparison to the C line. This line is composed of transitions and , see Fig. 2c, which occur between pairs of LLs having their derivatives of opposite signs, which causes the broadening of the C line. This explanation can be straightforwardly generalized for all transitions, giving qualitative explanation of the differences in linewidths simply using the standard SWM model.
In principle, another and even more appealing interpretation of our data could assume that we actually see the response of decoupled graphene layers instead of the point of bulk graphite. The presence of additional “Greek” lines in spectra could be then a consequence of some perturbation of the graphene system leading to a relaxation of the selection rules . Even though the appearance of some decoupled graphene sheets in our sample is very likely, we have the following arguments to support our “bulk” interpretation: i) Our experimentsOrlita et al. (2008b, c) were performed on several samples prepared from two different types of bulk graphite and the almost identical results, concerning the presence, position, lineshape and mainly mutual intensities of all the -scaled absorption lines were obtained. ii) The “Greek” transitions show significantly smaller linewidth in comparison to “Roman” ones, e.g. compare lines and C, which is unlikely to be caused by any perturbation relaxing the selection rules in graphene.
In both materials, spectral features evolving nearly linearly with are also observed, see low energy part of spectra in Figs. 1a and b, and represent thus an evidence for massive particles. In bulk graphite, can we relate these transitions to the point, i.e. to massive electrons, as discussed already in Ref. Orlita et al., 2008b. The optical response of massive electrons in the magnetic field was thoroughly analyzed e.g. in Refs. Toy et al., 1977; Li et al., 2006. In case of multi-layer graphene, the spectral features linear in cannot be explained unless some part of the sample is created from bulk graphite or at least from few-layer graphene stacks. Indeed, the traces of Bernal-stacked layers were found in micro-Raman experiment, as mentioned above.
IV Conclusions
We have compared the optical response of Dirac fermions in bulk graphite and multi-layer epitaxial graphene in low magnetic fields. Whereas the results obtained on multi-layer graphene fully correspond to expectations for dipole-allowed transitions in a 2D gas of Dirac particles, the transmission spectra taken on bulk graphite appear to be more complex. The standard Slonczewski-Weiss-McClure model is found, in the latter case to be sufficient to explain the existence of all absorption lines scaling as as well as their individual lineshapes.
Acknowledgements.
The present work was supported by the European Commission through Grant No. RITA-CT-2003-505474, by contract ANR-06-NANO-019 and projects MSM0021620834 and KAN400100652.References
- Jiang et al. (2007) Z. Jiang, E. A. Henriksen, L. C. Tung, Y.-J. Wang, M. E. Schwartz, M. Y. Han, P. Kim, and H. L. Stormer, Phys. Rev. Lett. 98, 197403 (2007).
- Deacon et al. (2007) R. S. Deacon, K.-C. Chuang, R. J. Nicholas, K. S. Novoselov, and A. K. Geim, Phys. Rev. B 76, 081406R (2007).
- Henriksen et al. (2008) E. A. Henriksen, Z. Jiang, L.-C. Tung, M. E. Schwartz, M. Takita, Y.-J. Wang, P. Kim, and H. L. Stormer, Phys. Rev. Lett. 100, 087403 (2008).
- Sadowski et al. (2006) M. L. Sadowski, G. Martinez, M. Potemski, C. Berger, and W. A. de Heer, Phys. Rev. Lett. 97, 266405 (2006).
- Sadowski et al. (2007) M. L. Sadowski, G. Martinez, M. Potemski, C. Berger, and W. A. de Heer, Solid State Com. 143, 123 (2007).
- Plochocka et al. (2008) P. Plochocka, C. Faugeras, M. Orlita, M. L. Sadowski, G. Martinez, M. Potemski, M. O. Goerbig, J.-N. Fuchs, C. Berger, and W. A. de Heer, Phys. Rev. Lett. 100, 087401 (2008).
- Orlita et al. (2008a) M. Orlita, C. Faugeras, P. Plochocka, P. Neugebauer, G. Martinez, D. K. Maude, A.-L. Barra, M. Sprinkle, C. Berger, W. A. de Heer, et al., arxiv:0808.3662 (2008a).
- Li et al. (2006) Z. Q. Li, S.-W. Tsai, W. J. Padilla, S. V. Dordevic, K. S. Burch, Y. J. Wang, and D. N. Basov, Phys. Rev. B 74, 195404 (2006).
- Orlita et al. (2008b) M. Orlita, C. Faugeras, G. Martinez, D. K. Maude, M. L. Sadowski, and M. Potemski, Phys. Rev. Lett. 100, 136403 (2008b).
- Orlita et al. (2008c) M. Orlita, C. Faugeras, G. Martinez, D. K. Maude, M. L. Sadowski, J. M. Schneider, and M. Potemski, Journal of Physics: Condensed Matter 20, 454223 (2008c).
- Garcia-Flores et al. (2008) A. F. Garcia-Flores, H. Terashita, E. Granado, and Y. Kopelevich, arxiv:0807.1343 (2008).
- Iyengar et al. (2007) A. Iyengar, J. Wang, H. A. Fertig, and L. Brey, Phys. Rev. B 75, 125430 (2007).
- Gusynin et al. (2007) V. P. Gusynin, S. G. Sharapov, and J. P. Carbotte, Phys. Rev. Lett. 98, 157402 (2007).
- Abergel and Fal’ko (2007) D. S. L. Abergel and V. I. Fal’ko, Phys. Rev. B 75, 155430 (2007).
- Koshino and Ando (2008) M. Koshino and T. Ando, Phys. Rev. B 77, 115313 (2008).
- Bychkov and Martinez (2008) Y. A. Bychkov and G. Martinez, Phys. Rev. B 77, 125417 (2008).
- Nair et al. (2008) R. R. Nair, P. Blake, A. N. Grigorenko, K. S. Novoselov, T. J. Booth, T. Stauber, N. M. R. Peres, and A. K. Geim, Science 320, 1308 (2008).
- Kuzmenko et al. (2008a) A. B. Kuzmenko, E. van Heumen, F. Carbone, and D. van der Marel, Phys. Rev. Lett. 100, 117401 (2008a).
- Wang et al. (2008) F. Wang, Y. Zhang, C. Tian, C. Girit, A. Zettl, M. Crommie, and Y. R. Shen, Science 320, 206 (2008).
- Li et al. (2008a) Z. Q. Li, E. A. Henriksen, Z. Jiang, Z. Hao, M. C. Martin, P. Kim, H. L. Stormer, and D. N. Basov, Nature Physics 4, 532 (2008a).
- Kuzmenko et al. (2008b) A. B. Kuzmenko, E. van Heumen, D. van der Marel, P. Lerch, P. Blake, K. S. Novoselov, and A. K. Geim, arxiv:0810.2400 (2008b).
- Zhang et al. (2008) L. M. Zhang, Z. Q. Li, D. N. Basov, M. M. Fogler, Z. Hao, and M. C. Martin, arxiv:0809.1898 (2008).
- McCann et al. (2007) E. McCann, D. S. L. Abergel, and V. I. Fal’ko, Solid state communicatins 143, 110 (2007).
- Stauber et al. (2008) T. Stauber, N. M. R. Peres, and A. K. Geim, Phys. Rev. B 78, 085432 (2008).
- Nicol and Carbotte (2008) E. J. Nicol and J. P. Carbotte, Phys. Rev. B 77, 155409 (2008).
- Dawlaty et al. (2008) J. M. Dawlaty, S. Shivaraman, M. Chandrashekhar, F. Rana, and M. G. Spencer, Appl. Phys. Lett. 92, 042116 (2008).
- Sun et al. (2008) D. Sun, Z.-K. Wu, C. Divin, X. Li, C. Berger, W. A. de Heer, P. N. First, and T. B. Norris, Phys. Rev. Lett. 101, 157402 (2008).
- Berger et al. (2004) C. Berger, Z. Song, T. Li, X. Li, A. Y. Ogbazghi, R. Feng, Z. Dai, A. N. Marchenkov, E. H. Conrad, P. N. First, et al., J. Phys. Chem. B 108, 19912 (2004).
- Berger et al. (2006) C. Berger, Z. Song, X. Li, X. Wu, N. Brown, C. Naud, D. Mayou, T. Li, J. Hass, A. N. Marchenkov, et al., Science 312, 1191 (2006).
- Ferrari et al. (2006) A. C. Ferrari, J. C. Meyer, V. Scardaci, C. Casiraghi, M. Lazzeri, F. Mauri, S. Piscanec, D. Jiang, K. S. Novoselov, S. Roth, et al., Phys. Rev. Lett. 97, 187401 (2006).
- Faugeras et al. (2008) C. Faugeras, A. Nerrière, M. Potemski, A. Mahmood, E. Dujardin, C. Berger, and W. A. de Heer, Appl. Phys. Lett. 92, 011914 (2008).
- Hass et al. (2008) J. Hass, F. Varchon, J. E. Millán-Otoya, M. Sprinkle, N. Sharma, W. A. de Heer, C. Berger, P. N. First, L. Magaud, and E. H. Conrad, Phys. Rev. Lett. 100, 125504 (2008).
- Slonczewski and Weiss (1958) J. C. Slonczewski and P. R. Weiss, Phys. Rev. 109, 272 (1958).
- McClure (1957) J. W. McClure, Phys. Rev. 108, 606 (1957).
- McClure (1960) J. W. McClure, Phys. Rev. 119, 612 (1960).
- Toy et al. (1977) W. W. Toy, M. S. Dresselhaus, and G. Dresselhaus, Phys. Rev. B 15, 4077 (1977).
- Grüneis et al. (2008) A. Grüneis, C. Attaccalite, L. Wirtz, H. Shiozawa, R. Saito, T. Pichler, and A. Rubio, 0808.1467 (2008).
- Li et al. (2008b) G. Li, A. Luican, and E. Y. Andrei, arxiv:0803.4016 (2008b).