Spin Dynamics in the Magnetoelectric Effect LiCoPO4 Compound
Abstract
Inelastic neutron scattering (INS) experiments were performed to investigate the spin dynamics in magnetoelectric effect (ME) LiCoPO4 single crystals. Weak dispersion was detected in the magnetic excitation spectra along the three principal crystallographic axes measured around the (0 1 0) magnetic reflection. Analysis of the data using linear spin-wave theory indicate that single-ion anisotropy in LiCoPO4 is as important as the strongest nearest-neighbor exchange coupling. Our results suggest that Co2+ single-ion anisotropy plays an important role in the spin dynamics of LiCoPO4 and must be taken into account in understanding its physical properties. High resolution INS measurements reveal an anomalous low energy excitation that we hypothesize may be related to the magnetoelectric effect of LiCoPO4.
pacs:
75.10.Jm, 75.40.Gb, 75.30.EtI Introduction
LiCoPO4 is an antiferromagnetic (AFM) insulator belonging to the olivine family of lithium orthophosphates that share the general chemical formula LiMPO4 (M = Mn2+, Fe2+, Co2+, Ni2+) with four formula units per unit cell Megaw-1973 ; Santoro-1966-1967 . These materials continue to attract much attention due to their exceptionally large magnetoelectric (ME) effect and the anomalies exhibited in the ME coefficients as a function of temperature and magnetic fieldMercier-1967 ; Mercier-1971 ; Rivera-1994 . To date, it remained an open question whether the anomalies observed in the ME effect of LiMPO4 are intrinsic due to the particular local environment surrounding the transition metal ions in LiMPO4 or due to domain formation structure. The local environment can be slightly distorted in a magnetic (electric) field by virtue of the spin-orbit coupling, giving rise to a collective ferroelectric response (magneto-ferro-elastic effect)Rado ; Jensen2007 . The recent domain structure observed by second harmonic generation (SHG) in LiCoPO4 was attributed to coexisting AFM and ferrotoroidic domains which may play a role in giving rise to the ME effectFiebig2007 . In addition to the strong ME effect, this family of materials also exhibits intriguing magnetic properties. At low temperatures, LiMPO4 systems undergo transitions to AFM long-range-order (LRO), adopting similar magnetic structures, differing only in spin orientation. For example, with increasing temperature, LiNiPO4 first undergoes a first-order commensurate-incommensurate (C-IC) phase transition at K changing from a co-linear AFM state to a long-range IC order state, followed by a second-order phase transition from long-range IC to short-range IC order at 21.7 K Vaknin-PRL-2004 . On the other hand, LiMnPO4 undergoes an AFM LRO transition at 34 K as well as a field induced spin-flop transition Jiying-Mntobepublish . Weak ferromagnetism Kharcheno , an ME “butterfly loop” anomaly Kornev-2000 , and strong magnetic anisotropy have been observed in LiCoPO4 Rivera-1998 which also exhibits the largest ME coefficient Rivera-1994 among its counterpart compounds, making it of particular interest to study.
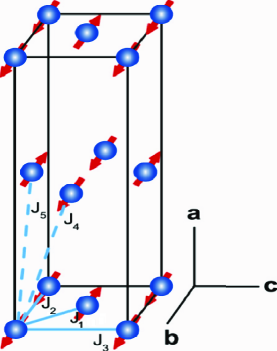
LiCoPO4 crystallizes in an orthorhombic symmetry, space group Pnma (no. 62) at room temperature, with lattice parameters = 10.093, = 5.89, and = 4.705 . The structure consists of buckled CoO layers stacked along the crystallographic a-axis and the magnetic Co2+ ( = 3/2) ions are surrounded by oxygen ions in a strongly distorted CoO6 octahedral coordination. LiCoPO4 develops AFM LRO at K Kornev-2000 ; Vaknin-PRB-2002 . Earlier studies have indicated a simple two-sublattice AFM state below with spins aligned along the -axis (whereas LiFePO4, LiMnPO4, and LiNiPO4 have spins oriented along the , , and -axis respectively)Santoro-1966-1967 ; Vaknin1999 . Fig. 1 illustrates the magnetic structure of LiCoPO4. For simplicity, only the Co2+ magnetic ions are shown. As depicted in Fig. 1, different magnetic exchange pathways are at play in this compound. Within the buckled CoO layer, nearest-neighbor Co2+ ions are strongly coupled () through Co-O-Co super-exchange interactions, while additional inplane magnetic interactions between next-nearest-neighbors (, ) are mediated through the group. Between adjacent layers, the magnetic couplings of nearest-neighbor ions (, ) are also mediated via the groups. The coupling are found to be rather strong and cannot be neglected Zarestky-2001 ; Vaknin-PRL-2004 . Due to its layered structure, LiCoPO4 exhibits properties between two- and three-dimensional ( and ) magnetic systems.
Although the physical properties of LiCoPO4 have been studied extensively in the past, there remain a number of puzzles in this compound Wiegelmann-thesis . Recent magnetoelectric Rivera-1994 ; Kornev-2000 , magneto-optic Kharchenko-2000 , and magnetic property Kharchenko-2001 studies do not agree with the originally proposed co-linear AFM structure and suggest a more complex magnetic structure for LiCoPO4. Neutron diffraction studies suggest the moments in LiCoPO4 in the AFM phase are not strictly aligned along the b-axis but are uniformly rotated from this axis by a small angle ( 4.6∘) Vaknin-PRB-2002 . The observation of weak ferromagnetism and an ME “butterfly loop” anomaly further motivated studies of LiCoPO4 both experimentally and theoretically Gufan-1987 ; Kornev-1999 ; Kornev2-1999 . In this paper, we report single crystal inelastic neutron scattering (INS) studies that yield the microscopic magnetic interactions in LiCoPO4. The data were analyzed within the linear spin wave approximation using a spin Hamiltonian explicitly including the intra-, inter-plane nearest neighbor, next-nearest-neighbor exchange interactions and single-ion anisotropy, which are determined in this study.
II EXPERIMENTAL TECHNIQUES
All measurements reported here were carried out on LiCoPO4 single crystals. Large crystals were grown for INS experiments by a LiCl flux method similar to that reported in Ref. Fomin-2002, . High purity starting materials of CoCl2 (99.999, MV laboratory), Li3PO4 (99.999 Aldrich) and LiCl (99.999) were thoroughly ground together at a molar ratio of Li3PO4:CoCl2:LiCl = 1:1:1 and sealed in a Pt crucible under Ar atmosphere. Note that the reaction of Li3PO4 + CoCl2 + LiCl LiCoPO4 + 3LiCl yields a molar ratio of 1:3 between LiCoPO4 and the flux material LiCl which we found crucial in growing large LiCoPO4 single crystals. The mixed powder is pre-melted at 800∘C and slowly heated to 900∘C. The crucible was maintained at 900∘C for 10 hours and then slowly cooled to 640∘C at a cooling rate of 0.7∘C/hr and then furnace-cooled to room temperature. Large purple color LiCoPO4 single crystals were obtained and extracted by dissolving LiCl in water. The crystals were characterized by X-ray diffraction measurements and found to be of pure single phase. The lattice parameters determined from our neutron diffraction measurements = 10.159, = 5.9, and = 4.70 at 8 K are in good agreement with prior resultsVaknin-PRB-2002 .
Two LiCoPO4 single crystals grown from the same batch were used for the INS experiments. Sample 1, g, and sample 2, g, were oriented in the ( 0) and (0 ) scattering plane, respectively. INS experiments were performed using the HB1A triple-axis spectrometer (TAS) at the High Flux Isotope Reactor (HFIR) neutron scattering facility at Oak Ridge National Laboratory, the BT7 thermal TAS, and the SPINS cold TAS at the NIST Center for Neutron Research at the National Institute of Standards Technology (NCNR). The magnetic excitations along the ( 1 0) and (0 0) directions were measured using the HB1A TAS on sample 1 which was mounted on a thin aluminum disk, sealed in an aluminum sample can and kept under helium atmosphere and cooled using a closed-cycle He refrigerator. Collimations of ---- downstream from reactor to detector were used throughout the experiment. Constant wave-vector scans were performed at = 8 K (fully ordered state) and = 35 K (well above TN). Spin excitations along the (0 1 ) direction were measured using the BT7 TAS at NIST on sample 2. A fixed final energy of = 14.7 meV and a ---- collimation were used with pyrolytic graphite (PG(0 0 2)) analyzer crystals in flat mode. High resolution INS measurements were carried out on sample 1 using the SPINS TAS with a fixed final energy, = 5 meV. A collimation of ---- was used with a cold Be filter in the scattering beam. Polarized neutron scattering experiments were also performed using the BT7 TAS with a fixed final energy of = 13.7 meV to clarify the nature of the 1.2 meV low energy excitation. The polarization analysis technique as applied to this study is discussed in Ref. polarize-technique1, ; polarize-technique2, ; polarize-technique3, . 3 spin filters (polarizer) are mounted before and after the sample with a spin flipper in the incident beam. The sample is maintained in a horizontal or vertical magnetic guide field of 5 Oe such that the neutron polarization is parallel to the momentum transfer , when a horizontal field is applied at the sample position, or when a vertical magnetic field is applied. With the spin flipper off, we measure the (++) non-spin-flip scattering. On the other hand, with the spin flipper on, the (-+) spin-flip scattering is measured. Sample 2 oriented in the (0 ) scattering plane and a ---- collimation were used throughout the polarization measurements. Constant wave-vector scans were carried out with both (++) and (-+) configurations. All measurement results have been normalized to a beam monitor count.
III EXPERIMENTAL RESULTS and MODELING
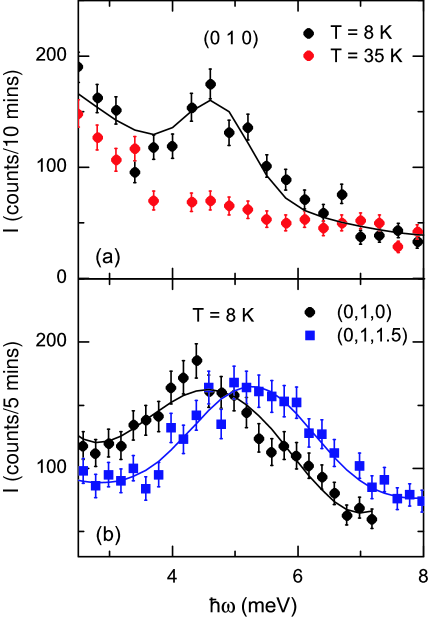
Representative constant wave-vector scans with energy transfer between = 2.5 meV and 8 meV measured using the HB1A and BT7 TAS are shown in Fig. 2. Note that error bars in this paper are statistical in origin and represent one standard deviation. Fig. 2 (a) shows the temperature dependence of the magnetic excitation measured at (0 1 0). At = 8 K in the fully ordered phase, a single excitation with energy transfer of 4.7 meV is detected. At a temperature well above ( = 35 K) the peak disappears demonstrating the excitation is magnetic in origin. Below , further detailed measurements at (0 1 0) as a function of temperature indicate no significant temperature dependence of this excitation. Fig. 2 (b) shows the = 8 K constant wave-vector scans measured at (0 1 0) and (0 1 1.5), which typically correspond to the minimum and maximum spin wave excitations. The data clearly show that the excitation observed at 4.7 meV at (0 1 0) shifts to higher energy transfer 5.3 meV at (0 1 1.5), yielding a maximum energy shift of 0.6 meV. This indicates that the overall dispersion along the (0 1 ) direction is modest compared to an exchange energy of N 2 meV. Similar behaviors were observed for the dispersions along the (0 0) and ( 1 0) directions. Note that data in Fig. 2 (a) shows strong scattering at 2.5 meV, the lowest data point plotted. We will show later that it is from scattering of a low energy excitation at 1.2 meV which has been observed in recent SPINS high resolution measurements.
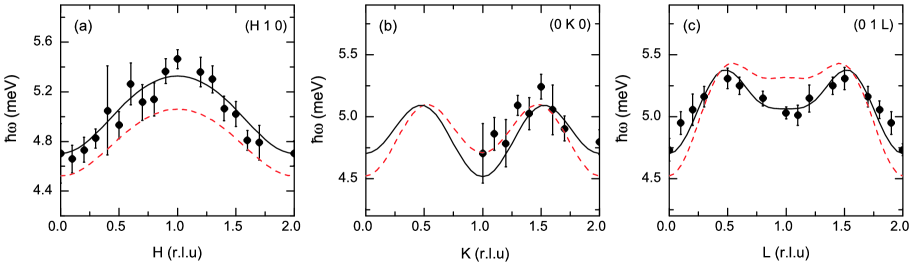
To determine the magnetic excitation spectra along all three principal axes directions, a series of constant wave-vector scans were carried out in the ( 0) and (0 ) scattering planes at = 8 K around the (0 1 0) magnetic reflection. Fig. 3 depicts the ground state magnetic dispersion relations along the ( 1 0), (0 0), and (0 1 ) directions constructed from energy scans at constant wave-vector. We determined the peak positions assuming Gaussian peak-shapes that were fit to each of the constant wave-vector scans measured. For both the HB1A and BT7 triple-axis-spectrometers, the energy resolution at the elastic position was 1 meV. The experimental uncertainties had a significant effect in the theoretical modeling as described in the text below. The measured spectra indicate a spin wave excitation of 4.7 meV at (0 1 0) which vanishes abruptly above , while modest dispersion was observed along all three principal symmetry directions, with the scale in Fig. 3 being chosen to best exhibit the dispersion that falls within a band of 0.8 meV. This relatively weak dispersion suggests an Ising-like model in LiCoPO4; in a pure Ising model the magnetic excitations are completely dispersionless.
To analyze the measured spin wave dispersion curves of LiCoPO4 using linear spin wave theory, we consider the different magnetic exchange interactions as illustrated in Fig. 1 and assume an AFM ground state with spins pointing strictly along the -axis. Taking into account the intra-plane and inter-plane nearest-neighbor, next-nearest-neighbor interactions, and the single-ion anisotropy, the Spin Hamiltonian can be expressed in the following form:
| (1) |
where () represents the single-ion anisotropy along the , , and -directions. In order to have the spins pointing along the -axis in the model calculation, the Cartesian coordinate , , and directions are defined to be along the crystallographic , , and directions respectively. The zero point of the energy spectrum is chosen such that =0. Within a linear spin wave approximation, the derived spin wave dispersion from Eq. 1 is given by:
| (2) |
where
A = ,
B = ,
C = .
and ri denotes the vectors directed between two Co2+ ions
, ,
, ,
, ,
, .
Non-linear-least-squares fits of the spin-wave dispersion expressed by Eq. 2 to the observed magnetic spectra yields: meV, 0.159 meV, 0.131 meV, 0.08 meV, 0.125 meV, 0.192 meV, 0.208 meV. The obtained microscopic interaction parameter is significantly larger than and consistent with previous observations that the magnetic behavior of LiCoPO4 is intermediate between a and system. Moreover, the obtained positive value of indicates in-plane AFM nearest-neighbor coupling, whereas negative and values suggest inter-plane FM coupling along the -axis consistent with the magnetic structure, where the magnetic unit cell is doubled along the - and -axes, but not along the -axis. and have the same sign as indicating that they compete with and may cause frustration, however, they are relatively weak compared to (, ). Both and are positive favoring a ground state with the magnetic moment along the -axis consistent with the elastic magnetic neutron scattering results. An important result in our study is the large values of the single-ion anisotropy compared to the nearest-neighbor coupling . Although strong single-ion anisotropy in LiCoPO4 has been suggested by several models Rado ; Bichurin , this study provides experimental evidence that the single-ion anisotropy is as important as the strongest magnetic exchange interaction in LiCoPO4. Such relatively strong anisotropy may split the quartet of the Co2+ ion into two doublets rendering the suggested Ising-like character to LiCoPO4 Vaknin-PRB-2002 .
The “” sign in Eq. (2) () indicates that there are two non-degenerate spin wave branches which come directly from the different values of and . Using the obtained best-fit parameters, the calculated dispersion curves of the two branches are plotted as solid lines (“” branch) and dash lines (“” branch ) in Fig. 3. The two calculated spin wave branches predict a maximum separation of 0.3 meV at (0 1 0), (1 1 0), and (0 1 1). In the thermal neutron TAS measurements using HB1A and BT7 with a resolution of 1 meV, only one excitation was observed at these wave vectors. We have two high resolution measurements using SPINS TAS, fixed Ef = 5 meV with a resolution of 0.28 meV, at (1 1 0) and (0 1 0) with energy transfer up to 8 meV. The constant wave vector scan at (0 1 0) at = 9 K is shown in Fig. 4 (a). At (0 1 0), where the model predicts the maximum separation between these two branches, only one excitation around 4.7 meV is observed. The additional low energy excitation observed at 1.2 meV does not agree with the model and is discussed below. Our results could not resolve the two branches for two possible reasons. First, the second excitation may be very weak in intensity, and our model does not predict intensities. Second, the intrinsic linewidth of the observed excitations are broader than the resolution ( 1 meV) suggestive of contributions from both branches overlap and cause the broadening.
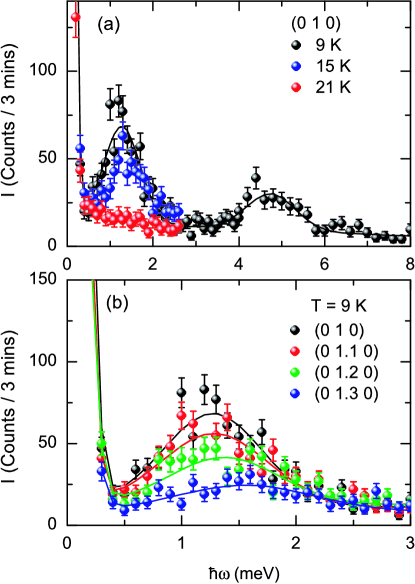
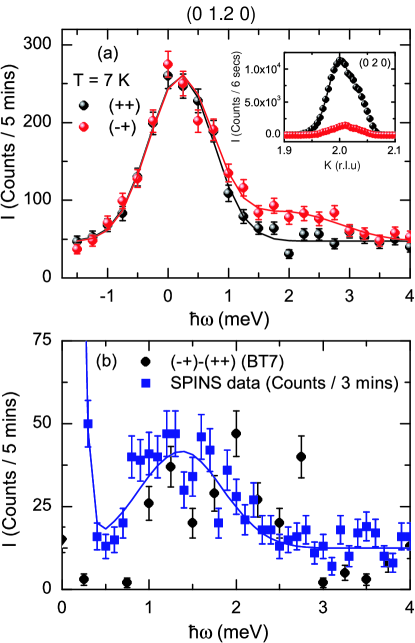
High resolution measurements on SPINS show an anomalous low energy excitation below that does not fit in the linear spin wave model. Fig. 4 (a) depicts the = 9 K, 15 K, and 21 K data measured at (0 1 0). In addition to the 4.7 meV excitation, the = 9 K SPINS data clearly show a low energy excitation at 1.2 meV. The peak position of this excitation is practically temperature independent but the peak intensity decreases with increasing temperature and eventually the peak vanishes above . It also shows weak dispersion along all three reciprocal directions. Fig. 4 (b) shows constant wave-vector scans measured along the (0 0) direction at 9 K. Very weak dispersion was observed along this direction and the data show that this excitation weakens in intensity (significantly) with increasing and could not be detected at large . Similar results were obtained along the ( 1 0) and (0 1 ) directions. In order to clarify the origin of this excitation, polarized neutron scattering experiments were carried out using the BT7 TAS. As discussed in Ref. polarize-technique1, ; polarize-technique2, ; polarize-technique3, , coherent nuclear scattering is always non-spin-flip scattering (++) because it never causes a reversal, or spin flip, of the neutron spin direction upon scattering. On the other hand, magnetic scattering depends on the relative orientation of the neutron polarization and the scattering vector . Only those spin components which are perpendicular to the scattering vector are effective. Thus for a fully polarized neutron beam, with the horizontal field configuration, , all magnetic scattering is spin-flip scattering (-+), and ideally no non-spin-flip scattering will be observed. Our polarized measurements were carried out by performing constant wave-vector scans at (0 1.2 0) at = 7 K with (++) and (-+) configurations and a horizontal magnetic guide field at the sample position (). Inset in Fig. 5 (a) first compares the (0 2 0) nuclear Bragg scattering measured in non-spin-flip (++) and spin-flip (-+) configurations. Strong intensity was observed in (++) channel as expected. The observed weak (-+) intensity can be attributed to the finite instrumental flipping ratio which we estimate to be 1/9 by comparing the integrated intensity of the (-+) and (++) scans of the (0 2 0). The spin-flip (-+) and non-spin-flip (++) scans at (0 1.2 0) were plotted in Fig. 5 (a) between = -1.75 meV and 4 meV. Additional magnetic scattering was detected in the (-+) spin-flip channel. In order to show the peak clearly, the subtracted data, the non-spin-flip (++) data was subtracted from the spin-flip (-+) data, is plotted together with the SPINS data in Fig. 5 (b). At (0 1.2 0), the SPINS data (resolution of 0.28 meV) shows an excitation centered at 1.37 0.05 meV. The subtracted BT7 polarized data (resolution of 1 meV) shows a rather broad peak consistent with the SPINS data within experimental error. The polarized measurements indicate that this low energy excitation is magnetic in origin, which agrees with the temperature dependence measurements. However, as shown in Fig. 3, it does not fit in the current spin wave model. Attempting to analyze the combined dispersions with gaps at 1.2 meV and 4.7 meV simultaneously using Eq. 2 failed, in particular in accounting for the 1.2 meV excitation. At this time, the nature of the 1.2 meV excitation is not clear, and based on it being nearly dispersionless we can only hypothesize that it may be due to a local magnetic excitation. Further studies are necessary in order to unravel the nature of this excitation.
IV Summary
The spin dynamics of the ME compound LiCoPO4 were determined by inelastic neutron scattering experiments. Similar to LiNiPO4 Jensen2007 , LiMnPO4 Jiying-Mntobepublish , and LiFePO4 Jiying-PRB-2006 , the overall observed magnetic excitation spectra in LiCoPO4 can be adequately described by a linear spin wave theory. Our results indicate that single-ion anisotropy is as important as the strong nearest-neighbor magnetic coupling and plays an essential role in understanding the spin structure and dynamics of LiCoPO4. However, the observation of the second low energy dispersionless 1.2 meV magnetic excitation is unusual and is not contained in the spin wave Hamiltonian, suggesting that it may be closely related to the strong ME effect in LiCoPO4. The nature of this excitation is not understood yet and requires further detailed studies.
V Acknowledgments
We acknowledge discussions with T. Barnes. Ames Laboratory is supported by the U. S. Department of Energy Office of Basic Energy Science under Contract No. DE-AC02-07CH11358. The HFIR is a national user facility funded by the United States Department of Energy, Office of Basic Energy Sciences, Materials Science, under Contract No. DE-AC05-00OR22725 with UT-Battelle, LLC. SPINS is supported in part by the National Science Foundation through DMR-0454672. The work has benefited from the use of the NIST Center of Neutron Research at the National Institute of Standards Technology.
References
- (1) H. D. Megaw, Crystal Structure - A working Approach (Saunders Philadelphia, 1973) p. 249.
- (2) R. P. Santoro, R. E. Newnham, and S. Nomura, J. Phys. Chem. Solids 27, 655 (1966); P. Santoro, D. J. Segal, and R. E. Newnham, J. Phys. Chem. Solids 27, 1192 (1966); R. P. Santoro and R.E. Newnham, Acta Crystallogr. 22, 344 (1967).
- (3) M. Mercier, J. Gareyte, and E. F. Bertaut, C. R. Acad. Sci. Paris B 264, 979 (1967).
- (4) M. Mercier, Rev. Gen. Electr. 80, 143 (1971).
- (5) J.-P. Rivera, Ferroelectrics 161, 147 (1994).
- (6) G.T. Rado, Phys. Rev. Lett. 6 609 (1961). G.T. Rado, Phys. Rev. 128 2546 (1965). G.T. Rado, Int. J. Magn. 6 121 (1974).
- (7) T. B. S. Jensen, Ph. D. Thesis, Risø DTU and University of Copenhagen (2007), http://www.bricksite.com/tstibius.
- (8) B. B. van Aken, J.-P. Rivera, H. Schmid, and M. Fiebig, Nature 449, 702 (2007).
- (9) D. Vaknin, J. L. Zarestky, J.-P. Rivera, and H. Schmid, Phys. Rev. Lett. 92, 207201 (2004).
- (10) J. Li, et al., to be published.
- (11) Yu. Kharchenko, N. Kharchenko, M. Baran, and R. Szymczak, cond-mat: 0310156.
- (12) I. Kornev, M. Bichurin, J.-P. Rivera, S. Gentil, H. Schmid, A. G. M. Jansen, and P. Wyder, Phys. Rev. B 62, 12247(2000).
- (13) J.-P. Rivera, J. Korean Phys. Soc. 32 1839 (1998).
- (14) D. Vaknin, J. L. Zarestky, L. L. Miller, J-p. Rivera, and H. Schmid, Phys. Rev. B 65 224414 (2002).
- (15) D. Vaknin, J. L. Zarestky, J. E. Ostenson, B. C. Chakoumakos, A. Goñi, P. J. Pagliuso, T. Rojo, and G. E. Barberis, Phys. Rev. B 60, 1100 (1999).
- (16) J. L. Zarestky, D. Vaknin, B. C. Chakoumakos, T. Rojo, A. Go i, and G. E. Barberis, J. Mag. Mag. Matt. 234, 401 (2001).
- (17) H. Wiegelmann, Magnetoelectric Effects in Strong Magnetic Fields, Ph.D Thesis, University of Konstanz, Konstanzer Dissertationen, Bd. 461, Hartung-Gorre, Konstanz (1995).
- (18) M.F. Kharchenko, O.V. Miloslavska, Yu. M. Kharchenko, H. Schmid, and J.-P. Rivera, Ukr. J. Phys. Opt. 1, 16 (2000).
- (19) N.F. Kharchenko, Yu.N. Kharchenko, R. Szymczak, M. Baran, and H. Schmid, Low Temp. Phys. 27, 895 (2001) (Fiz.Niz.Temp. 27, 1208 (2001)).
- (20) Yu. M. Gufan and V. M. Kalita, Fiz. Tverd. Tela (Leningrad) 29, 3302 (1987) [Sov. Phys. Solid State 29, 1893 (1987)].
- (21) I. Kornev, J.-P. Rivera, S. Gentil, A. G. M. Jansen, M. Bichurin, H. Schmid, and P. Wyder, Physica B 270, 82 (1999).
- (22) I. Kornev, J.-P. Rivera, S. Gentil, A.G.M. Jansen, M. Bichurin, H. Schmid, and P. Wyder, Physica B 271, 304 (1999)
- (23) V. I. Fomin, V. P. Genezdilov, V. S. Kurnosov, A. V. Peschanskii, A. V. Yeremenko, H. Schmid, J.-P. Rivera, and S. Gentil, Low Temp. Phys. 28, 203 (2002).
- (24) R. M. Moon, T. Kiste, and W. C. Koehler, Phys. Rev. 181, 920 ( 1969).
- (25) Q. Huang, P. Karen, V L. Karen, A. Kjekshus, J. W. Lynn, A. D. Mighell, N. Rosov, and A. Santoro. Phvs. Rev. B 45, 9611 (1992).
- (26) J. W. Lynn, N. Rosov, and G. Fish, J. Appl. Phys. 73(10), 5369(1993).
- (27) M.I. Bichurin, D.A. Filippov, Ferroelectrics 204, 225 (1997).
- (28) J. Li, V. O. Garlea, J. L. Zarestky, and D. Vaknin, Phys. Rev. B 73, 024410 (2006).