Superconducting electronic state in optimally doped YBa2Cu3O7-δ observed with laser-excited angle-resolved photoemission spectroscopy
Abstract
Low energy electronic structure of optimally doped YBa2Cu3O7-δ is investigated using laser-excited angle-resolved photoemission spectroscopy. The surface state and the CuO chain band that usually overlap the CuO2 plane derived bands are not detected, thus enabling a clear observation of the bulk superconducting state. The observed bilayer splitting of the Fermi surface is 0.08 Å-1 along the – direction, significantly larger than Bi2Sr2CaCu2O8+δ. The kink structure of the band dispersion reflecting the renormalization effect at 60 meV shows up similarly as in other hole-doped cuprates. The momentum-dependence of the superconducting gap shows -wave like amplitude, but exhibits a nonzero minimum of 12 meV along the – direction. Possible origins of such an unexpected “nodeless” gap behavior are discussed.
pacs:
74.72.Bk, 74.25.Jb, 79.60.-iI Introduction
The high- superconductivity in cuprates is still attracting strong attention after extensive studies over twenty years. In particular, the concomitant technical progress of angle-resolved photoemission spectroscopy (ARPES) has significantly contributed to the investigation of high- cuprates since its discovery, e.g., Fermi surface determination and confirmation of the -wave superconducting gap symmetry. Damascelli et al. (2003) More recently, the “kink” like structure in band dispersions was observed in a number of hole-doped cuprates, thus shedding light on the details of the electron-boson coupling and the renormalization effect. Damascelli et al. (2003); Lanzara et al. (2001); Sato et al. (2003); Cuk et al. (2004); Sato et al. (2007); Wei et al. (2008) Moreover, very recent arguments on the pseudogap and so-called the “Fermi arc” in relation to the mechanism of superconductivity have further enhanced the significance and effectiveness of ARPES studies on cuprates. Takana et al. (2006); Kondo et al. (2007); Lee et al. (2007); Kanigel et al. (2006, 2007) The ARPES results reported thus far, however, are mostly dominated by the data from a bismuth-based cuprate Bi2Sr2CaCu2O8+δ (BSCCO) and its related compounds, because of the easiness of getting a clean surface by cleaving. For deeper understanding of the high- superconductivity, systematic elucidation of the superconducting electronic structure across various compounds is still highly desired.
YBa2Cu3O7-δ (YBCO) is one such typical cuprate system with relatively high- of 93 K, whose orthorhombic crystal structure is characterized by the existence of one-dimensional CuO chains besides bilayered CuO2 planes. Jorgensen et al. (1987) Since samples of good quality are available in YBCO, the electric, magnetic, and phononic properties has been extensively studied by various kinds of probes, thus providing a number of important findings such as pseudo-(spin) gap, magnetic resonance mode, etc., at a very early stage. Timusk and Statt (1999) Recently, owing to the progress of detwinning technique aligning the CuO chains perfectly in a single domain, in-plane anisotropic electronic properties are being revealed. Particularly, indication of the superconducting order parameter showing two-fold -wave symmetry has been concluded by many probes including optical, Basov et al. (1995); Limonov et al. (1998); Nemetschek et al. (1998) phase-sensitive, Kirtley et al. (2006) and tunneling current Smilde et al. (2005) measurements. A precise investigation of the superconducting state in YBCO by high-resolution ARPES will be very valuable in order to give a comparative study across the various probes as well as compounds. A considerable amount of ARPES results have been reported so far. Veal and Gu (1994); Schabel et al. (1998a); Lu et al. (2001); Borisenko et al. (2006); Nakayama et al. (2007); Zabolotnyy et al. (2007); Hossain et al. (2008) However, a critical difficulty called the “surface state” is known to hinder the bulk electronic structure study of YBCO. Damascelli et al. (2003); Schabel et al. (1998a); Lu et al. (2001) It had been long argued that this problem should arise from two kinds of the easy cleavage, CuO chain and BaO terminations, as observed by scanning tunneling microscope (STM). Edwards et al. (1992); Maki et al. (2001) Recent effortful ARPES studies have successfully attributed the origin of the surface state to the first CuO2 bilayer being excessively overdoped due to the termination. Nakayama et al. (2007); Zabolotnyy et al. (2007); Hossain et al. (2008) Nakayama et al.Nakayama et al. (2007) and Zabolotnyy et al.Zabolotnyy et al. (2007) also attained the partial observation of the bulk superconducting state beside the surface state, but unfortunately, not clearly around the momentum region where the superconducting gap takes the minimum (nodal region). To discuss the total low energy electronic structure, more precise data without the influence of the surface state is necessary over a wide region of the Brillouin zone.
In this article, we report the direct observation of the superconducting electronic state in optimally doped YBCO using laser-ARPES. By using a vacuum ultraviolet (VUV) laser as the light source, the ARPES measurement with sub-meV resolution and bulk sensitivity is available. Kiss et al. (2008) We found clear band dispersions from the bulk state, showing the evolution of like superconducting gap. The surface state as well as the CuO chain band was not observed throughout the momentum region of measurements, thus making the analysis of the superconducting CuO2 band much easier. The observed bilayer splitting is larger than BSCCO, but as expected by band calculations, Andersen et al. (1994, 1995) while the kink structure at 60 meV appears similarly as in other hole-doped cuprates. The momentum-dependence of the gap in detail takes a minimum of 12 meV along – direction, thus showing “nodeless” behavior. We discuss the possible origins of such an unusual superconducting state.
II Experimental Details
High quality single crystals of optimally doped YBa2Cu3O7-δ ( K) were grown by the crystal pulling method Yamada and Shiohara (1993) and detwinned by annealing under uniaxial pressure. The sample orientation was determined by x-ray Laue diffraction and Raman scattering measurements.
Photoemission experiments were performed by using a linearly polarized laser-ARPES system Kiss et al. (2008) equipped with a Scienta R4000 hemispherical electron analyzer and a quasi-continuous-wave VUV laser ( eV) as a light source. Owing to its low kinetic energy, the escape depth of a photoelectron attains a value of 100 Å, Seah and Dench (1979) thus enabling us a bulk sensitive measurement. The pressure was better than Torr throughout the measurements. The spot size of the incident light was around 200 m. We obtained clean (001) surfaces of YBCO by cleaving in situ at 5–10 K. Sample degradation due to aging was not observed during the continuous measurement over 24 h. We set the total energy resolution of the measurement system to 2–3 meV in order to gain in photoemission intensity. The Fermi level () was determined in accuracy of better than 0.5 meV by the Fermi edge of an evaporated Au film connected electrically to the sample. Unless specifically noted, the temperature of data acquisition is 5 K. For the transformation of angle to momentum, we used the value of 4.9 eV as the work function of YBCO. Rietveld et al. (1992) For simplicity, we use “nodal direction” to represent the –S direction, following the custom of a normal superconductivity.
III Results and Discussions
III.1 Band dispersions and Fermi surface
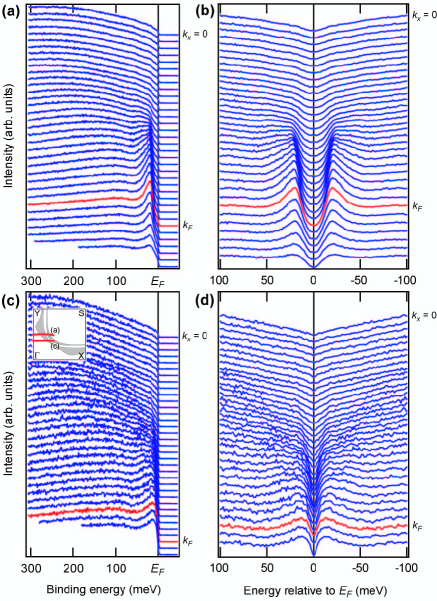
Figures 1(a)–1(f) show the obtained ARPES intensity images as a function of binding energy () and momentum () along momentum cuts as indicated in Fig. 1(g).
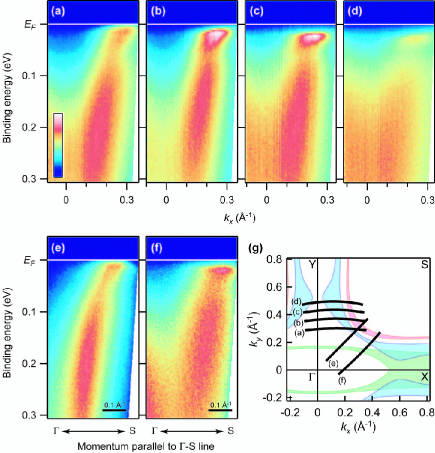
Here, we can observe clear band dispersions accompanying peaks near . According to the band calculations for slightly overdoped YBCO (), Andersen et al. (1994, 1995) there are three Fermi surfaces expected; the bonding and antibonding two-dimensional Fermi sheets arising from the bilayer coupling of CuO2 planes and the one-dimensional surface from a CuO chain. These Fermi surfaces, whose -projections are shown by the shaded areas in Fig. 1(g), are expected to show large three-dimensionality (-dependence) compared to BSCCO. The observed band dispersions in Fig. 1(a)–1(f) thus correspond to two-dimensional CuO2 plane bands. With approaching Y-point, the ARPES intensity becomes weak and the band dispersion becomes difficult to be distinguished from the background, as shown in Fig. 1(d). This is possibly because of the transition matrix element effect in the photoemission process, concerning a significant - and -dependence in spectral weight. Nakayama et al. (2007) On moving away from the nodal direction [(a, e) (d, f) in Fig. 1], we can easily see that the top of the band dispersion tends to sink beneath , indicative of a gap opening. This gapped feature clearly reveals the -wave like magnitude, i.e., the gap size increases with approaching the antinodal (X- or Y-point) side. This ensures that the present observation of band dispersions indeed reflects the superconducting bulk CuO2 electronic structure, possibly owing to the bulk sensitivity and/or the matrix element effect at eV. The details of the superconducting gap and the coherence peak shape will be discussed later (section III-B).
In addition to the superconducting gap, we can also recognize a clear band renormalization at 60 meV, similarly as in other high- cuprates. To elucidate the band renormalization character, band dispersions along several momentum cuts including the nodal direction are represented in Fig. 2(a).
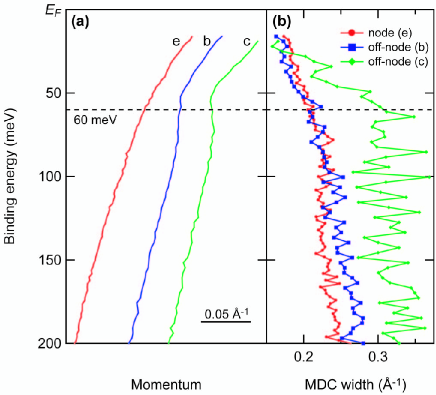
These dispersions are obtained by plotting the peak positions of momentum distribution curves (MDCs), the momentum profiles of the ARPES intensity image at each energy. We estimated the peak position by fitting a Lorentzian curve to each MDC. We can easily find the band renormalization behavior in this dispersion at around 60 meV, both at nodal and off-nodal regions. The energy of this kink feature is quite similar to those reported previously in YBCO. Borisenko et al. (2006); Nakayama et al. (2007) The kink also appears as the decrease of the peak width of MDCs below 60 meV, as shown in Fig. 2. The width of MDC peak is considered to be proportional to the imaginary part of the self-energy . Damascelli et al. (2003) Thus, the above result indicates the suppression of the scattering rate below the kink energy. These data show stronger renormalization at the antinodal side than near the nodal direction, which is similar to the momentum-dependence as observed in bismuth-based cuprates. Sato et al. (2003); Cuk et al. (2004) Thus we confirmed that the kink structure in hole-doped high- cuprates shows a universal character, also in the superconducting electronic state in YBCO.
Since the band calculations Andersen et al. (1994, 1995) predicted a large bilayer splitting of the CuO2 bands, we look into the details of the band dispersions to see whether they are composed of two components, bonding and antibonding bands. Figures 3(a) and 3(b) show the band dispersion near at the off-nodal region and its energy distribution curves (EDCs) which are the energy profiles of an ARPES intensity image.
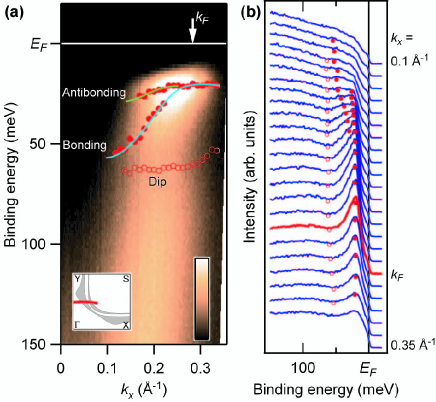
At meV, which is sufficiently below the kink energy, the band dispersion shows fairly sharp peaks (20 meV) with an indication of the superconducting gap opening as seen in the EDCs. To elucidate the fine details of the band structure, we plotted the peak positions of EDCs shown as closed circles in Fig. 3. Here, we found that there are two EDC peaks at around Å-1, indicating the existence of antibonding and bonding bands, as shown in Fig. 3(a). The Fermi wavevector () for the outer Fermi surface composed of bonding band can be determined as the -point where the peak position of the EDC most nearly approaches , considering the manifestation of the superconducting Bogoliubov quasiparticle dispersion. Norman et al. (1998) The of the inner antibonding band, on the other hand, is very difficult to be precisely assigned, since it merges with bonding band on approaching . Note that the dip structure of EDCs indicated by open circles in Fig. 3 shows up at around 60 meV beside the quasiparticle peak, reflecting the band renormalization effect in the superconducting state. Regarding the renormalization energy at this off-nodal region, the above value is slightly lower compared to the 70-meV kink observed in BSCCO, Cuk et al. (2004) and similar that in YBCO reported by Nakayama et al. Nakayama et al. (2007)
To separately estimate for respective bands, we show the ARPES spectrum obtained along the –S direction in Fig. 4(a). Its MDCs are also shown in Fig. 4(b).
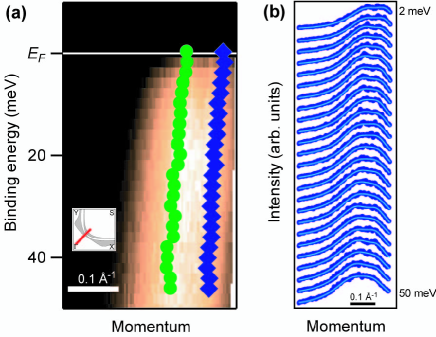
We can see that each MDC contains two broad peaks. Each MDC was well fitted by a sum of two Lorentzians with a constant background at the energy region of meV, as shown in Fig. 4(b). The peak positions obtained by the MDC fitting ( and ) as observed in Fig. 4(a) suggest the bilayer splitting of about Å-1, which agrees well with band calculations. Andersen et al. (1994, 1995) The values of the half width at half maximum (HWHM) for respective peaks ( and ), on the other hand, are about 0.1 and 0.2 Å-1 for bonding and antibonding bands at near , which are considerably broader than those in BSCCO (e.g., 0.0031 Å-1 for an optimally doped sample in Ref. Ishizaka et al., 2008). This broadening makes it difficult to clearly distinguish the bilayer splitting in YBCO despite its large value compared to BSCCO (shown later). It may be partly due to the greater dispersion expected in YBCO, giving rise to broadening effect. Bansil et al. (2005); Markiewicz et al. (2005); Sahrakorpi et al. (2005) To more clearly separate the bilayer split dispersion, investigations of more heavily-doped samples may be useful as reported in BSCCO system, which remains to be elucidated in future.
By plotting positions on the Brillouin zone, we can obtain the Fermi surface as shown in Fig. 5.
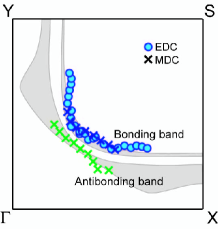
Circles indicate the which were obtained by tracing the EDC peak positions as previously described, while the cross markers represent the MDC peak positions at . We could not observe any spectra corresponding to the CuO chain band as shown in Figs. 1(e) and 1(f), which may be due to the matrix element effect. foo Apparently, obtained from EDC is in a good correspondence with the outer bonding band Fermi surface we derived from MDC peaks. Here, we can confirm that the bilayer splitting occurs in a wide momentum region in YBCO, including the – direction, where in BSCCO a very small splitting (–0.015 Å-1 in Ref. Kordyuk et al., 2004 and Å-1 in Ref. Yamasaki et al., 2007) is observed. Both of the bonding and antibonding band Fermi surfaces agree quite well with the LDA band calculation Andersen et al. (1994, 1995) and a previous report of the nodal bilayer splitting in YBCO. Borisenko et al. (2006) A past ARPES study reporting the bulk electronic state of YBCO using 46-eV photon, Nakayama et al. (2007) nevertheless, exhibited very small bilayer splitting of –0.03 Å-1 at the off-nodal region, while our data show Å-1 at a similar momentum region. This difference indicates that the bulk electronic state of YBCO may have significant three-dimensionality compared to BSCCO, thus causing a strong -dependence in ARPES result. foo
III.2 Superconducting gap anisotropy
Here we focus on the evaluation of the superconducting gap and its anisotropy. In order to estimate the gap magnitude carefully, we show EDCs along the off-nodal direction and those symmetrized at in Figs. 6(a) and 6(b), respectively.
The symmetrized EDC spectrum can be expressed by , where is the intensity of EDC as a function of , energy relative to . As we described in section III-A, of the outer bonding band can be determined as the -position where EDC peak most nearly approaches , i.e., the peaks forming a pair in get closest to each other. In Fig. 7(a), we show the close up of the EDCs at and extracted from Fig. 6(a).
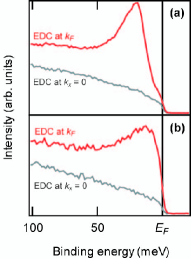
The EDC at clearly indicates a sharp peak at 20 meV and reduced intensity around . Such spectral features represent the opening of the superconducting gap and the evolution of the Bogoliubov quasiparticle peak. The small edge-like component at partly arises from the (angle-integrated type) background, as also observed at where no band dispersion exists near . The remaining may be due to the tail-like states of the coherence peak with finite lifetime, while we cannot completely rule out the subtle inclusion of the surface state. Nevertheless, the dominant spectral shape is very close to what is observed in BSCCO, indicating that the superconducting gap can be precisely investigated similarly in YBCO.
To discuss the momentum-dependence of the superconducting gap, we show in Figs. 8(a)–8(c) EDCs at and those symmetrized at , for respective positions along the Fermi surface contour as shown in Fig. 8(d).
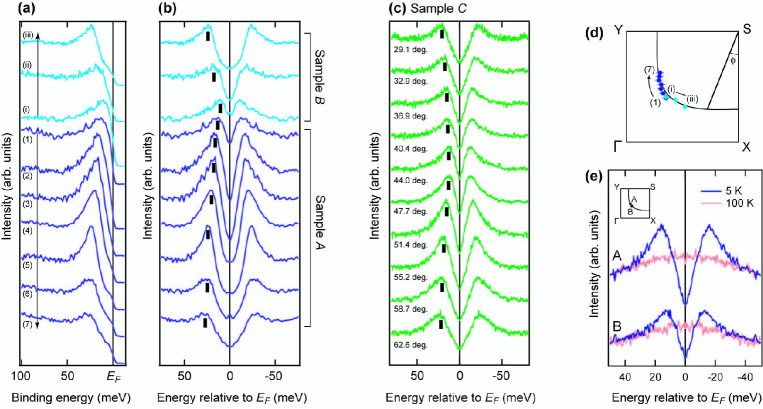
We can see a systematic behavior that the gap size increases on approaching the antinodal X- and Y-points, in accord with a -wave like gap symmetry. A surprising result appears near the nodal point, nevertheless, as the persistent existence of a small gap on crossing the –S line. Even at the momentum point along –S direction where the gap size becomes minimum [corresponds to (1) and (i) in Fig. 8(b) and in Fig. 8(c)], the spectrum clearly shows a gapped feature thus indicating the “nodeless” character of the superconducting gap. Near the antinodal X and Y regions, the EDC shows a fairly weak coherence peak with high background level, reflecting the loss of ARPES intensity due to the matrix element effect. On approaching the –S direction, on the other hand, the coherence peak intensity evolves and gets sharp in width, as is also observed in BSCCO. In the very vicinity of the –S line, however, the coherence peak seems to become suppressed and broadened, even though the higher energy part (0.1 eV) of the dispersion remains clearly [Figs. 1(a) and 1(e)]. Such behavior is fairly unusual among hole-doped high- cuprates, where the nodal quasiparticle tends to show a robust coherence.
To show the validity of our data analysis, we plot the raw EDCs along the cut where the gap minimum appears in Fig. 6(c). Comparing to the off-nodal point as shown in Fig. 6(a), the band dispersion approaches somewhat closer to . The EDCs and those symmetrized [Fig. 6(d)], however, persistently show a clear gap across . In Fig. 7(b), we show the EDC spectrum at together with that at . We can clearly see a peak structure at 12 meV for EDC at , which is responsible for the gap feature. By comparing these two spectra at and , we can rule out the possibility that this gap structure is due to the background (angle-integrated) component. In addition, we show the temperature-dependence of the symmetrized EDC at for off-nodal (A) and nodal (B) points in Fig. 8(e). Both of them clearly show the gap structure disappearing between 5 K and 100 K ( K). This indicates that this “nodal gap” evolution also reflects some modification of the electronic state, like superconducting transition.
Now we discuss the gap symmetry by plotting as a function of the Fermi surface angle, (Fig. 9).
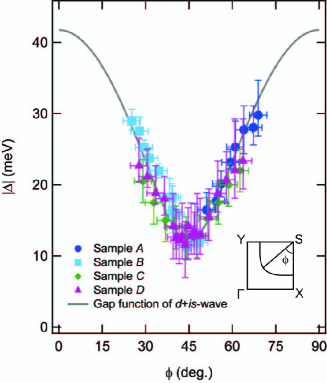
We estimated the gap magnitudes by taking the energy position of the coherence peaks in the symmetrized EDCs at . In order to confirm the reproducibility, we obtained ARPES data from seven different samples and found that all of their results coincide within errors. Four of them are shown here (samples A–D). Our result indicates that the momentum-dependence of the gap in the observed region is nearly symmetric with respect to , where the gap shows the minimum of 12 meV. Note that the nodes should shift to (e.g., from Ref. Kirtley et al., 2006) in case of -wave, but do not disappear unless the -wave component dominates that of -wave. A clear difference of the gap size between X and Y regions (e.g., the X-Y anisotropy ratio of the gap magnitude is larger than 1.22 in Ref. Smilde et al., 2005) indicative of the -wave like anisotropy, is also not observed. Precise measurements covering the whole Brillouin zone (both X- and Y-points) are further necessary, nevertheless, to make any definite conclusion on the X-Y anisotropy of the gap. foo Assuming that the observed gap character arises from a single superconducting state, a time reversal symmetry broken state such as - or -wave must be taken into account in order to reproduce such a nodeless -wave like symmetry. Van Harlingen (1995); Tsuei and Kirtley (2000) Here we tentatively tried fitting the -dependence with the symmetry gap function as shown in Fig. 9, and obtained meV and meV.
The Fermi surface-dependences of the superconducting gap magnitude and its anisotropy should be also considered, which are actually observed in several multiband superconductors such as -NbSe2, Yokoya et al. (2001); Kiss et al. (2007) MgB2, Souma et al. (2003); Tsuda et al. (2003) and a novel FeAs-based high- superconductor. Ding et al. (2008) In Fig. 10, we show the -dependence of for the two bilayer-split bonding and antibonding bands.
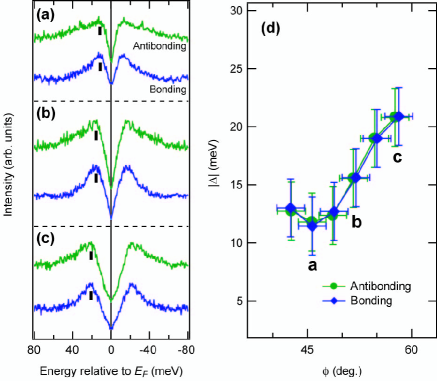
The symmetrized EDCs at are shown along respective Fermi sheets, where each was estimated from the MDC fitting as shown in Fig. 4. -dependence of for bonding and antibonding bands are similar to each other, both showing the gap minimum of meV at around as discussed above. From this result, we cannot find any significant Fermi sheet-dependence of at least in this momentum region of measurement.
Now let us discuss the possible origins of the “nodeless” behavior of the superconducting gap. This result is in a strong contrast to many recent macroscopic experimental reports on YBCO.Limonov et al. (1998); Nemetschek et al. (1998); Smilde et al. (2005); Kirtley et al. (2006) Such behaviour has not been either observed by ARPES in other cuprate superconductors until now. To explain this unusual data, here we discuss its possible origins, mainly in comparison with BSCCO. The first possibility we must suggest is the possible effect of the surface roughness in YBCO arising from two types of the surface terminations (CuO chain and BaO layers) obtained upon cleaving. Edwards et al. (1992); Maki et al. (2001) If there is a serious microscopic roughness at the surface, it may disturb the conservation law of the photoelectron momentum as the boundary condition. Thus the “nodal gap” might be reflecting the average gap value around the nodal point in the momentum space. If this is the case, the spectrum at off-nodal region should show a broader peak feature than that at node, because of the greater gap distribution as a function of . The EDC spectrum at off-nodal point, nevertheless, actually shows a much sharper feature as shown in Fig. 7, which does not agree well with the above scenario. Another major difference between YBCO and BSCCO is the existence of the CuO chain structure along -axis, which may cause symmetry-like modification of the gap as represented by the -wave. It is unlikely to be the origin of -like superconducting gap as we observed, however, which holds symmetry. The remaining factors we should consider are the higher out-of-plane electron hopping and the greater bilayer coupling compared to BSCCO and related materials, which generate two well separated bonding and antibonding Fermi sheets with relatively high three-dimensional dispersions. Note that the ratio of out-of-plane and in-plane resistivity is in YBCO, while in BSCCO. Ott (2003) Such three-dimensional electronic structure, which is not usually taken into account, may be playing a relevant role. For example, some unexpected electronic state at the (001) surface may show up, as the time reversal symmetry broken superconducting state discussed in the (110) surface of a -wave superconductor. Matsumoto and Shiba (1995a); Covington et al. (1997) In addition, the strong three-dimensional dispersion can induce the electron pairing along the direction. A muon spin rotation (SR) study Khasanov et al. (2007) actually revealed the possible existence of an -wave superconducting component along -axis. Theoretical consideration how a -dependent superconducting component can be detected by various kinds of probes, including ARPES, is needed. Finally, we refer to several interesting reports regarding the pseudogap behavior in under and optimally doped YBCO. Sonier et al. (2001); Xia et al. (2008) These studies insist that a hidden order phase, such as charge/spin density waves Kivelson et al. (2003) or time reversal symmetry broken staggered current flux states, Varma (1997); Chakravarty et al. (2001) coexists with the superconducting phase below the pseudogap temperature (–60 K in optimally doped YBCO). This pseudogap phase may be associated with the nodal gap evolution. The origins cannot yet be clarified at present, nevertheless, it shows a possibility of a novel unconventional superconducting state realizing in YBCO. Further precise experimental and theoretical studies for its microscopic description are highly desired.
IV Conclusions
We have investigated the low energy electronic structure of optimally-doped YBCO by using VUV laser-ARPES. The unwanted surface state as well as CuO chain band were not detected perhaps because of the bulk sensitivity or the matrix element effect at eV. Thus we succeeded in the clear observation of the superconducting state in YBCO, which had been long desired. As a universal feature for high- cuprates, the band renormalization effect caused by the electron-boson coupling was found at 60 meV. The wide bilayer splitting of the Fermi surface was also confirmed for the superconducting electronic state, in good accordance with band calculations. Regarding the momentum-dependence of the superconducting gap, we found the like behavior but without a clear evidence of gap node, showing the gap minimum of 12 meV along the –S direction. This gap feature was similarly observed for both of the bilayer-split Fermi surfaces. This “nodeless” character of the gap raises the possibility of an unusual superconducting state appearing in YBCO, thus motivating further systematic studies.
Acknowledgements.
The authors thank M. Ogata, T. Tohyama, and T. Yokoya for fruitful discussions, and T. Kiss, T. Shimojima, and S. Tsuda for technical help. This work was partially supported by Grants-in-Aid for Scientific Research from the Japan Society for the Promotion of Science and the Ministry of Education, Culture, Sports, Science and Technology (MEXT), Japan. M.O. acknowledges financial support from the Global COE Program “the Physical Science Frontier,” MEXT, Japan.References
- Damascelli et al. (2003) A. Damascelli, Z. Hussain, and Z.-X. Shen, Rev. Mod. Phys. 75, 473 (2003).
- Lanzara et al. (2001) A. Lanzara, P. V. Bogdanov, X. J. Zhou, S. A. Kellar, D. L. Feng, E. D. Lu, T. Yoshida, H. Eisaki, A. Fujimori, K. Kishio, J.-I. Shimoyama, T. Noda, S. Uchida, Z. Hussain, and Z.-X. Shen, Nature (London) 412, 510 (2001).
- Sato et al. (2003) T. Sato, H. Matsui, T. Takahashi, H. Ding, H.-B. Yang, S.-C. Wang, T. Fujii, T. Watanabe, A. Matsuda, T. Terashima, and K. Kadowaki, Phys. Rev. Lett. 91, 157003 (2003).
- Cuk et al. (2004) T. Cuk, F. Baumberger, D. H. Lu, N. Ingle, X. J. Zhou, H. Eisaki, N. Kaneko, Z. Hussain, T. P. Devereaux, N. Nagaosa, and Z.-X. Shen, Phys. Rev. Lett. 93, 117003 (2004).
- Sato et al. (2007) T. Sato, K. Terashima, K. Nakayama, H. Matsui, T. Takahashi, K. Kadowaki, M. Kofu, and K. Hirota, J. Phys. Soc. Jpn. 76, 103707 (2007).
- Wei et al. (2008) J. Wei, Y. Zhang, H. W. Ou, B. P. Xie, D. W. Shen, J. F. Zhao, L. X. Yang, M. Arita, K. Shimada, H. Namatame, M. Taniguchi, Y. Yoshida, H. Eisaki, and D. L. Feng, Phys. Rev. Lett. 101, 097005 (2008).
- Takana et al. (2006) K. Tanaka, W. S. Lee, D. H. Lu, A. Fujimori, T. Fujii, Risdiana, I. Terasaki, D. J. Scalapino, T. P. Devereaux, Z. Hussain, and Z.-X. Shen, Science 314, 1910 (2006).
- Kondo et al. (2007) T. Kondo, T. Takeuchi, A. Kaminski, S. Tsuda, and S. Shin, Phys. Rev. Lett. 98, 267004 (2007).
- Lee et al. (2007) W. S. Lee, I. M. Vishik, K. Tanaka, D. H. Lu, T. Sasagawa, N. Nagaosa, T. P. Devereaux, Z. Hussain, and Z.-X. Shen, Nature (London) 450, 81 (2007).
- Kanigel et al. (2006) A. Kanigel, M. R. Norman, M. Randeria, U. Chatterjee, S. Souma, A. Kaminski, H. M. Fretwell, S. Rosenkranz, M. Shi, T. Sato, T. Takahashi, Z. Z. Li, H. Raffy, K. Kadowaki, D. Hinks, L. Ozyuzer, and J. C. Campuzano, Nature Phys. 2, 447 (2006).
- Kanigel et al. (2007) A. Kanigel, U. Chatterjee, M. Randeria, M. R. Norman, S. Souma, M. Shi, Z. Z. Li, H. Raffy, and J. C. Campuzano, Phys. Rev. Lett. 99, 157001 (2007).
- Jorgensen et al. (1987) J. D. Jorgensen, M. A. Beno, D. G. Hinks, L. Soderholm, K. J. Volin, R. L. Hitterman, J. D. Grace, I. K. Schuller, C. U. Segre, K. Zhang, and M. S. Kleefisch, Phys. Rev. B 36, 3608 (1987).
- Timusk and Statt (1999) T. Timusk and B. Statt, Rep. Prog. Phys. 62, 61 (1999).
- Basov et al. (1995) D. N. Basov, R. Liang, D. A. Bonn, W. N. Hardy, B. Dabrowski, M. Quijada, D. B. Tanner, J. P. Rice, D. M. Ginsberg, and T. Timusk, Phys. Rev. Lett. 74, 598 (1995).
- Limonov et al. (1998) M. F. Limonov, A. I. Rykov, S. Tajima, and A. Yamanaka, Phys. Rev. Lett. 80, 825 (1998); Phys. Rev. B 61, 12412 (2000).
- Nemetschek et al. (1998) R. Nemetschek, R. Hackl, M. Opel, R. Philipp, M. T. Béal-Monod, J. B. Bieri, K. Maki, A. Erb, and E. Walker, Eur. Phys. J. B 5, 495 (1998).
- Kirtley et al. (2006) J. R. Kirtley, C. C. Tsuei, Ariando, C. J. M. Verwijs, S. Harkema, and H. Hilgenkamp, Nature Phys. 2, 190 (2006).
- Smilde et al. (2005) H. J. H. Smilde, A. A. Golubov, Ariando, G. Rijnders, J. M. Dekkers, S. Harkema, D. H. A. Blank, H. Rogalla, and H. Hilgenkamp, Phys. Rev. Lett. 95, 257001 (2005).
- Veal and Gu (1994) B. W. Veal and C. Gu, J. Electron Spectrosc. Relat. Phenom. 66, 321 (1994).
- Schabel et al. (1998a) M. C. Schabel, C.-H. Park, A. Matsuura, Z.-X. Shen, D. A. Bonn, R. Liang, and W. N. Hardy, Phys. Rev. B 57, 6090 (1998a); 57, 6107 (1998b).
- Lu et al. (2001) D. H. Lu, D. L. Feng, N. P. Armitage, K. M. Shen, A. Damascelli, C. Kim, F. Ronning, Z.-X. Shen, D. A. Bonn, R. Liang, W. N. Hardy, A. I. Rykov, and S. Tajima, Phys. Rev. Lett. 86, 4370 (2001).
- Borisenko et al. (2006) S. V. Borisenko, A. A. Kordyuk, V. Zabolotnyy, J. Geck, D. Inosov, A. Koitzsch, J. Fink, M. Knupfer, B. Büchner, V. Hinkov, C. T. Lin, B. Keimer, T. Wolf, S. G. Chiuzbăian, L. Patthey, and R. Follath, Phys. Rev. Lett. 96, 117004 (2006).
- Nakayama et al. (2007) K. Nakayama, T. Sato, K. Terashima, H. Matsui, T. Takahashi, M. Kubota, K. Ono, T. Nishizaki, Y. Takahashi, and N. Kobayashi, Phys. Rev. B 75, 014513 (2007).
- Zabolotnyy et al. (2007) V. B. Zabolotnyy, S. V. Borisenko, A. A. Kordyuk, J. Geck, D. S. Inosov, A. Koitzsch, J. Fink, M. Knupfer, B. Büchner, S.-L. Drechsler, H. Berger, A. Erb, M. Lambacher, L. Patthey, V. Hinkov, and B. Keimer, Phys. Rev. B 76, 064519 (2007).
- Hossain et al. (2008) M. A. Hossain, J. D. F. Mottershead, D. Fournier, A. Bostwick, J. L. McChesney, E. Rotenberg, R. Liang, W. N. Hardy, G. A. Sawatzky, I. S. Elfimov, D. A. Bonn, and A. Damascelli, Nature Phys. 4, 527 (2008).
- Edwards et al. (1992) H. L. Edwards, J. T. Markert, and A. L. de Lozanne, Phys. Rev. Lett. 69, 2967 (1992).
- Maki et al. (2001) M. Maki, T. Nishizaki, K. Shibata, and N. Kobayashi, J. Phys. Soc. Jpn. 70, 1877 (2001).
- Kiss et al. (2008) T. Kiss, T. Shimojima, K. Ishizaka, A. Chainani, T. Togashi, T. Kanai, X.-Y. Wang, C.-T. Chen, S. Watanabe, and S. Shin, Rev. Sci. Instrum. 79, 023106 (2008).
- Andersen et al. (1995) O. K. Andersen, A. I. Liechtenstein, O. Jepsen, and F. Paulsen, J. Phys. Chem. Solids 56, 1573 (1995).
- Andersen et al. (1994) O. K. Andersen, O. Jepsen, A. I. Liechtenstein, and I. I. Mazin, Phys. Rev. B 49, 4145 (1994).
- Yamada and Shiohara (1993) Y. Yamada and Y. Shiohara, Physica C 217, 182 (1993).
- Seah and Dench (1979) M. P. Seah and W. A. Dench, Surf. Interface Anal. 1, 2 (1979).
- Rietveld et al. (1992) G. Rietveld, N. Y. Chen, and D. van der Marel, Phys. Rev. Lett. 69, 2578 (1992).
- Norman et al. (1998) M. R. Norman, H. Ding, M. Randeria, J. C. Campuzano, T. Yokoya, T. Takeuchi, T. Takahashi, T. Mochiku, K. Kadowaki, P. Guptasarma, and D. G. Hinks, Nature (London) 392, 157 (1998).
- Ishizaka et al. (2008) K. Ishizaka, T. Kiss, S. Izumi, M. Okawa, T. Shimojima, A. Chainani, T. Togashi, S. Watanabe, C.-T. Chen, X. Y. Wang, T. Mochiku, T. Nakane, K. Hirata, and S. Shin, Phys. Rev. B 77, 064522 (2008).
- Bansil et al. (2005) A. Bansil, M. Lindroos, S. Sahrakorpi, and R. S. Markiewicz, Phys. Rev. B 71, 012503 (2005).
- Markiewicz et al. (2005) R. S. Markiewicz, S. Sahrakorpi, M. Lindroos, H. Lin, and A. Bansil, Phys. Rev. B 72, 054519 (2005).
- Sahrakorpi et al. (2005) S. Sahrakorpi, M. Lindroos, R. S. Markiewicz, and A. Bansil, Phys. Rev. Lett. 95, 157601 (2005).
- (39) In all the samples which we succeeded in observing the superconducting dispersion, CuO chain band was not detected. In the low-energy photoemission process using 6.994-eV light, the final state is considered to be a rather band like character, unlike the free electron picture assumed to be held in conventional high-energy photoemission spectroscopy. This will make the matrix element effect strongly dependent on the incident light energy in relation to the final state, and make it difficult to quantitative simulate its effect. The -dependent ARPES using a low-energy synchrotron light will be useful to obtain more information concerning the matrix element effect in YBCO.
- Kordyuk et al. (2004) A. A. Kordyuk, S. V. Borisenko, A. N. Yaresko, S.-L. Drechsler, H. Rosner, T. K. Kim, A. Koitzsch, K. A. Nenkov, M. Knupfer, J. Fink, R. Follath, H. Berger, B. Keimer, S. Ono, and Y. Ando, Phys. Rev. B 70, 214525 (2004).
- Yamasaki et al. (2007) T. Yamasaki, K. Yamazaki, A. Ino, M. Arita, H. Namatame, M. Taniguchi, A. Fujimori, Z.-X. Shen, M. Ishikado, and S. Uchida, Phys. Rev. B 75, 140513(R) (2007).
-
(42)
The in-plane and out-of-plane momenta ( and
) at fixed emission angle are given by
where is the electron mass, is the work function, and is the inner potential. varies periodically as a function of , while its absolute value is difficult to be confirmed since is unknown. Regarding , the region of measurement is limited by Å-1 in the present setup with eV. For detail, see, e.g., S. Hüfner, Photoelectron Spectroscopy—Principles and Applications (Springer, Berlin, 2003), 3rd ed. - Van Harlingen (1995) D. J. Van Harlingen, Rev. Mod. Phys. 67, 515 (1995).
- Tsuei and Kirtley (2000) C. C. Tsuei and J. R. Kirtley, Rev. Mod. Phys. 72, 969 (2000).
- Yokoya et al. (2001) T. Yokoya, T. Kiss, A. Chainani, S. Shin, M. Nohara, and H. Takagi, Science 294, 2518 (2001).
- Kiss et al. (2007) T. Kiss, T. Yokoya, A. Chainani, S. Shin, T. Hanaguri, M. Nohara, and H. Takagi, Nature Phys. 3, 720 (2007).
- Souma et al. (2003) S. Souma, Y. Machida, T. Sato, T. Takahashi, H. Matsui, S.-C. Wang, H. Ding, A. Kaminski, J. C. Campuzano, S. Sasaki, and K. Kadowaki, Nature (London) 423, 65 (2003).
- Tsuda et al. (2003) S. Tsuda, T. Yokoya, Y. Takano, H. Kito, A. Matsushita, F. Yin, J. Itoh, H. Harima, and S. Shin, Phys. Rev. Lett. 91, 127001 (2003).
- Ding et al. (2008) H. Ding, P. Richard, K. Nakayama, K. Sugawara, T. Arakane, Y. Sekiba, A. Takayama, S. Souma, T. Sato, T. Takahashi, Z. Wang, X. Dai, Z. Fang, G. F. Chen, J. L. Luo, and N. L. Wang, EPL 83, 47001 (2008).
- Ott (2003) H. R. Ott, in The Physics of Superconductors Vol. I. Conventional and High- Superconductors, edited by K. H. Bennemann and J. B. Ketterson (Springer, Berlin, 2003), pp. 385–494.
- Matsumoto and Shiba (1995a) M. Matsumoto and H. Shiba, J. Phys. Soc. Jpn. 64, 3384 (1995); 64, 4867 (1995); 65, 2194 (1996).
- Covington et al. (1997) M. Covington, M. Aprili, E. Paraoanu, L. H. Greene, F. Xu, J. Zhu, and C. A. Mirkin, Phys. Rev. Lett. 79, 277 (1997).
- Khasanov et al. (2007) R. Khasanov, S. Strässle, D. Di Castro, T. Masui, S. Miyasaka, S. Tajima, A. Bussmann-Holder, and H. Keller, Phys. Rev. Lett. 99, 237601 (2007).
- Sonier et al. (2001) J. E. Sonier, J. H. Brewer, R. F. Kiefl, R. I. Miller, G. D. Morris, C. E. Stronach, J. S. Gardner, S. R. Dunsiger, D. A. Bonn, W. N. Hardy, R. Liang, and R. H. Heffner, Science 292, 1692 (2001).
- Xia et al. (2008) J. Xia, E. Schemm, G. Deutscher, S. A. Kivelson, D. A. Bonn, W. N. Hardy, R. Liang, W. Siemons, G. Koster, M. M. Fejer, and A. Kapitulnik, Phys. Rev. Lett. 100, 127002 (2008).
- Kivelson et al. (2003) S. A. Kivelson, I. P. Bindloss, E. Fradkin, V. Oganesyan, J. M. Tranquada, A. Kapitulnik, and C. Howald, Rev. Mod. Phys. 75, 1201 (2003).
- Varma (1997) C. M. Varma, Phys. Rev. B 55, 14554 (1997); Phys. Rev. Lett. 83, 3538 (1999).
- Chakravarty et al. (2001) S. Chakravarty, R. B. Laughlin, D. K. Morr, and C. Nayak, Phys. Rev. B 63, 094503 (2001).