Probing the complex environments of GRB host galaxies and intervening systems: high resolution spectroscopy of GRB050922C111Based on observations collected at the European Southern Observatory (ESO) with the VLT/Kueyen telescope, Paranal, Chile, in the framework of program 075.A-0603.
Abstract
Aims. The aim of this paper is to investigate the environment of gamma ray bursts (GRBs) and the interstellar matter of their host galaxies.
Methods. We use to this purpose high resolution spectroscopic observations of the afterglow of GRB050922C, obtained with UVES/VLT hours after the GRB event.
Results. We found that, as for most high resolution spectra of GRBs, the spectrum of the afterglow of GRB050922C is complex. At least seven components contribute to the main absorption system at . The detection of lines of neutral elements like MgI and the detection of fine-structure levels of the ions FeII, SiII and CII allows us to separate components in the GRB ISM along the line of sight. Moreover, in addition to the main system, we have analyzed the five intervening systems between and identified along the GRB line of sight.
Conclusions. GRB afterglow spectra are very complex, but full of information. This can be used to disentangle the contribution of the different parts of the GRB host galaxy and to study their properties. Our metallicity estimates agree with the scenario of GRBs exploding in low metallicity galaxies
Key Words.:
gamma rays: bursts - cosmology: observations - galaxies: abundances - ISM1 Introduction
Soon after the discovery of the cosmological origin of gamma-ray bursts (GRBs) it was realized that they provide powerful tools to investigate the high redshift Universe. Minutes to hours after a GRB, its optical afterglow can sometimes be as bright as magnitude 13–18, such that it can be used as a bright beacon to gather high resolution (a few tens of km s-1 in the optical band), high quality (signal to noise per resolution element) spectra. Absorption lines produced by the matter along the line of sight are superimposed on these spectra and allow a detailed investigation of the medium surrounding the GRB and of the host galaxy interstellar matter (ISM).
As of today, about a dozen GRBs have been observed with high resolution spectrographs (and less than one hundred with standard low resolution spectrographs, see Savaglio 2006 and references therein). These high resolution spectroscopic observations showed that the absorption systems along GRB sightlines are complex, with many components. They are resolved down to a width of a few tens km s-1 and contribute to each main absorption system, spanning a total velocity range of typically hundreds km s-1. In one case, GRB021004, all the systems likely to be associated to the GRB host galaxy span a velocity range of a few thousands km s-1, although Chen et al. (2007) suggest that the high velocity 3000 km s-1 CIV component may no not be related to the GRB host galaxy. Both low and high-ionization lines are normally observed, as well as fine structure lines of CII, SiII, OI, FeII etc. This is at odds with what is observed from high resolution spectroscopy of QSO “associated” absorption lines (AALs; D’Odorico et al. 2004). First, the equivalent widths and the inferred optical depths along GRB sightlines are much greater than both QSO AALs and those associated with galaxies along QSO sightlines. Second, despite more than 30 years of investigations, only sparse detections of fine-structure lines are available along QSOs sightlines due to a lower density environment around them. Fine structure lines have been detected only in Broad Absorption Line QSO spectra (Srianand & Petitjean 2001, 2000; Hall et al. 2002).
The main reasons for these marked observational differences are probably linked to the characteristics of the phenomena and to their host galaxies. QSOs are long-lasting sources that ionize, partially or totally, the gas over their entire host galaxy. Instead, GRBs are transient phenomena, affecting only smaller regions, close to the site of the GRB explosion. Moreover, the star-forming regions surrounding GRBs are probably much richer in enriched gas than the giant elliptical galaxies, which are the typical host of luminous QSOs (Savaglio 2006). On the other hand, faint metal line systems along QSO sightlines probe mainly galaxy haloes, rather than their bulges or discs. Therefore, GRBs constitute a complementary tool to investigate the ISM of typical high redshift galaxies.
After the first pioneering programs that used BeppoSAX and HETE2 triggers to obtain high resolution spectroscopy of the optical afterglows 12-24 hours after the bursts (e.g. Fiore et al. 2005), we are now in a “golden age” for this kind of studies. This is because of the GRB-dedicated Swift satellite which provides accurate GRB positions on time scales as short as tens of seconds, and the rapid response mode (RRM) of the ESO/VLT. Using this new revolutionary observing mode it is possible to obtain GRB afterglow spectra from an 8m class telescope with delays from 10 min down to a few hours after the GRB event.
The absorption systems along GRB sightlines can be divided into three broad categories: (1) systems associated with the GRB surrounding medium. The physical, dynamical and chemical state of the medium in the star-forming region hosting the GRB progenitor can be modified by the GRB (long type), through shock waves and ionizing photons. Strong fine structure lines are always observed in these systems. Physical and geometrical parameters for the absorbers can be derived comparing the observed line ratios to those predicted by ionization codes (e.g. Nicastro et al. 1999; Perna & Lazzati 2002; Lazzati et al. 2006; Vreeswijk et al. 2007). (2) Systems associated with random clouds of the ISM of the host galaxy along the line of sight. These systems show low ionization lines and ground state lines, implying distances from the GRB explosion site larger than a few hundred pc. (3) Systems originating in the intergalactic matter along the line of sight.
The distinction between the first and second category is not always clear cut. Dessauges-Zavadsky et al. (2006) analyzed the afterglow spectra of GRB 020813 obtained in two epochs. They report a decline by a factor of 5 in the equivalent width of the Fe II 2396 transition, giving an estimate on its distance from the afterglow of about 50-100 pc. Vreeswijk et al. (2007) discovered large variations of FeII fine-structure lines in the spectra of GRB060418 on rest frame time scales of a fraction of an hour, and interpreted them as due to ultraviolet (UV) pumping from the afterglow radiation field. Their detailed modeling of the observed variability suggests a distance of the FeII absorbing cloud from the GRB explosion site of kpc, comparable to the size of a typical galaxy at . This would imply that, at least in this case, the entire galaxy (or a significant fraction of it) is affected by the GRB explosion. Recently D’Elia et al. (2008) analyzed the high resolution spectra of GRB080319B afterglow 9 minutes and 8 hours after the GRB onset. They found the strongest Fe II fine structure lines ever observed in a GRB. A few hours later the optical depth of these lines was reduced by a factor of 4-20, and the optical/UV flux by a factor of 60. This proves that the excitation of the observed fine structure lines is due to “pumping” by the GRB UV photons. A comparison of the observed ratio between the number of photons absorbed by the excited state and those in the Fe II ground state suggests that the six absorbers are kpc from the GRB site.
Our goal is to better disentangle different absorption systems by using Ultra-violet and Visual Echelle Spectrograph (UVES; Dekker et al. 2000) observations of GRB050922C. The burst was detected by Swift on 2005 September 22 19:55:50 UT (Norris et al. 2005) and, after 4 s, by Konus/Wind (Golenetskii et al. 2005). ROTSE discovered a bright transient source at RA(J2000 and DEC(J2000, 172.4 s after the burst, which was promptly identified as the optical afterglow of GR050922C (Rykoff et al. 2005) with a magnitude . The redshift of the GRB, , was determined by Jakobsson et al. (2005) using ALFOSC at the Nordic Optical Telescope at the Observatorio del Roque de los Muchachos in La Palma. This redshift was confirmed shortly after through TNG/DOLoRes spectroscopy (Piranomonte et al. 2005). The afterglow was then observed by UVES/VLT at high spectroscopic resolution () about 3.5 hours after the burst, when its magnitude was . The spectrum of GRB050922C is especially rich of features and contains clear examples of the three system categories discussed above. In addition to the main system at z=2.1992, there are five intervening systems at , 1.9891, 2.0087, 2.077, 2.1421 (confirmed also by Sudilovsky et al. 2007).
The system associated with the host galaxy presents several components, some showing strong high-ionization lines and strong fine-structure lines, some showing only low-ionization transitions, thus suggesting that we detect in this GRB both the circum-burst medium and random clouds of the host galaxy ISM along the line of sight.
This paper is organized as follows. Section 2 presents the observations and data reduction; Section 3 gives a brief summary of all absorbing systems identified in the UVES spectrum; Section 4 presents a detailed analysis of the absorption features belonging to the main absorption system at ; finally, in Section 5 the results are discussed and conclusions are presented.
2 Observations and data analysis
2.1 VLT observations
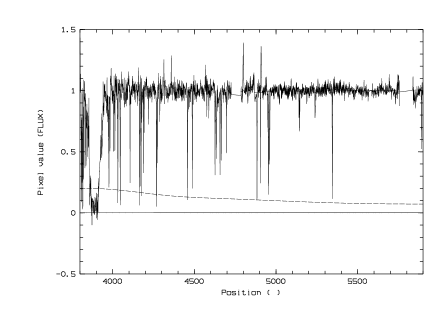
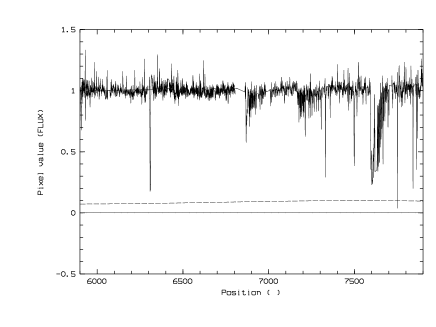
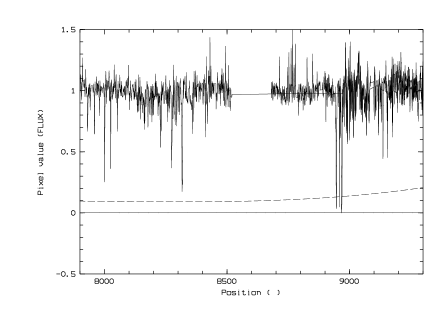
In the framework of ESO program 075.A-0603 we observed the afterglow of GRB050922C with UVES mounted at the VLT-UT2 telescope. Table 1 gives the log of the observations. Both UVES dichroics, as well as the red and the blue arms, were used. This allowed us to achieve a particularly wide spectral coverage, extending from Å to Å. In order to maximize the signal to noise ratio the CCD was rebinned in pixels. The data reduction was carried out by using the UVES pipeline (Ballester et al. 2000). The final useful spectra extend from about 3750 Å to about 9780 Å. Following Fiore et al. (2005) the total spectrum was rebinned to 0.1 Å to increase the signal-to-noise ratio. This resolution is still good enough to sample with at least 3-4 bins weak lines. The resolution element, set to two pixels, ranges then from 14 km s-1 at 4200 Å to 6.6 km s-1 at 9000 Å. The noise spectrum, used to determine the errors on the best fit line parameters, was calculated from the real-background-subtracted and rebinned spectrum using line-free regions. This takes into account both statistical errors and systematic errors in the pipeline processing and background subtraction.
2.2 Column densities
The line fitting was performed using the MIDAS package FITLYMAN (Fontana & Ballester 1995). This uses a Voigt profile and yields independently the column density and the Doppler parameter for each absorption component. For each absorption system several lines, spread over the entire spectral range covered by the UVES observations, were fitted simultaneously, using the same number of components for each line, and the same redshift and value for each component.
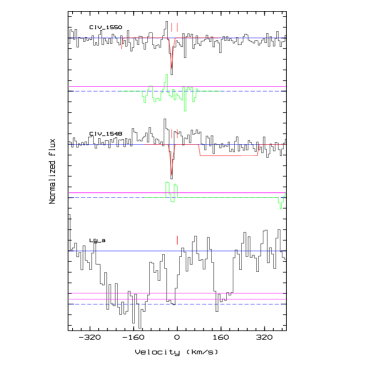
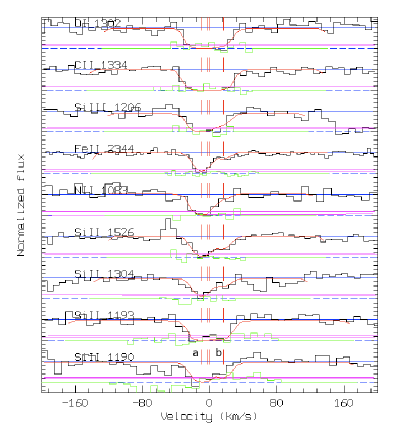
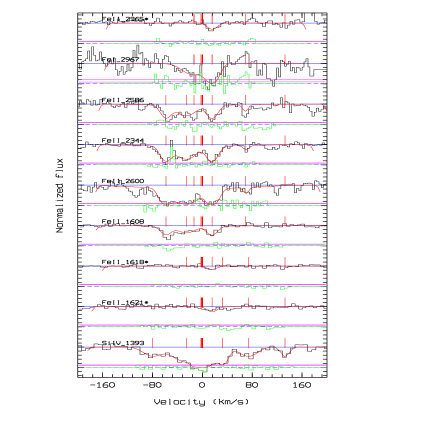
In all of the following figures showing plots from FITLYMAN (Fig. 2 - 10) the x-axis represents the velocity shift of the gas with respect to the zero, the y-axis represents the flux normalized to 1 for each element, the horizontal blue lines and dashed blue lines represent the flux level of the spectrum normalised to 1 and zero point respectively. The red line corresponds to the fit profile of the individual components and the magenta and green lines correspond to the polynomial approximation of the noise and residual spectrum respectively.
| Date | Dichroic | Central wavelength | Slit width | Seeing | Exposure | Time since GRB | |
|---|---|---|---|---|---|---|---|
| (UT) | Blue arm | Red arm | (″) | (″) | (min) | (hr) | |
| 09/22/05 00:07:17 | 1 | 3460 Å | 5800 Å | 1 | 50 | 4.15 | |
| 09/22/05 01:02:09 | 2 | 4370 Å | 8600 Å | 1 | 50 | 5.07 | |
3 Summary of the absorption systems
The high resolution spectrum of GRB050922C (see Fig. 1) exhibits a large number of absorption features, belonging to different absorption systems. The main system is due to the gas inferred to be in the host galaxy, at redshift . We identified five more intervening absorbers at (, 1.5691, 1.9891, 2.0087, 2.077 and 2.1416). Sudilovsky et al. (2007) found one more intervening systems , but we could not confirm that this is real because the C IV doublet is coincident with the SiII1304 and OI1302, OI*1304 of the main system at .
Each system is briefly illustrated in the next subsections.
3.1 The host galaxy at
This is the system with the highest number of features in the UVES spectrum. Fig. 1 shows the Ly- absorption at Å. The redshift inferred from this feature is confirmed by a high number of metal-line transitions, the narrowest of which allow a more precise determination: . This system exhibits a large number of absorption lines, from the neutral hydrogen Ly- and neutral metal-absorption lines (OI, NI and FeI) to low-ionization lines (C II, Si II, Mg II, Al II, Fe II, Al III) and high-ionization absorption features (C IV, Si IV, N V, P V, O VI). In addition, strong fine-structure lines (C II*, Si II*, O I*, O II**, Fe II*, OI II**) have been identified. The total velocity range spanned by this system is km s-1. This system is discussed in detail in the next sections.
3.2 The intervening absorber at
The intervening system at shows one main component spanning a velocity range of 20 km s-1 (see Fig. 2). This system presents HI and the CIV transition. The total HI column density is logN(HI)=18.10.1 cm-2.
The derived column density of CIV is given in Table 2.
| Transition | 2.1416 |
| CIV | 13.290.07 |
3.3 The intervening absorber at
The intervening system at shows two main components spanning a velocity range of km s-1 (see Fig. 3). This system presents HI and neutral metal-absorption lines (OI, NI), many low-ionization lines (FeII, SiII, NII, CII) and some high-ionization transitions (SiIII, AlIII, SiIV, CIV). The derived column densities are given in Table 3. We could not separate the two components for HI. The total HI column density is logN(HI)=20.30.3 cm-2.
| Transition | 2.077a | 2.077b |
|---|---|---|
| FeII | 14.450.08 | 13.060.04 |
| SiII | 14.180.08 | 13.540.07 |
| NII | 14.560.06 | 13.260.06 |
| CII | 15.70.3 | 14.30.3 |
| SiIII | 13.90.6 | 12.50.3 |
| OI | 15.60.3 | 14.40.2 |
| NI | 14.20.1 | 13.40.2 |
| AlIII | - | 12.20.1 |
| SiIV | 13.050.09 | 12.50.2 |
| CIV | 13.70 0.06 | 13.30.1 |
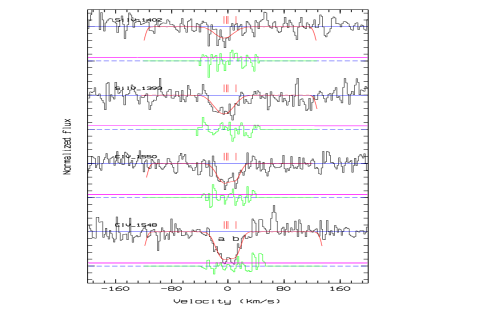
3.4 The intervening absorber at
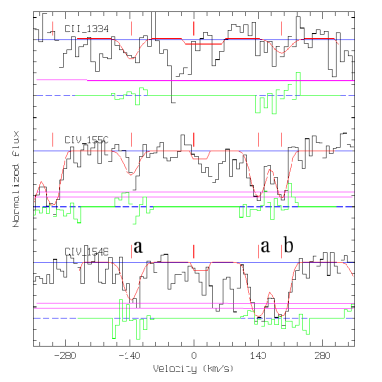
The intervening system at shows four main components spanning a velocity range of km s-1 (see Fig.4). This system presents HI, one low-ionization line (MgII) and some high-ionization transitions (SiIV, CIV). The derived column densities are given in Table 4. We could not separate the four components for HI. The total HI column density is log (HI)=18.20.2 cm-2.
| Transition | 2.0081a | 2.0081b | 2.0081c | 2.0081d |
|---|---|---|---|---|
| SiIV | 12.40.2 | 12.20.3 | 13.50.1 | 12.50.2 |
| CIV | 13.10.1 | 13.50.1 | 14.80.1 | 13.70.1 |
| MgII | - | 12.00.2 | 12.64 0.04 | - |
3.5 The intervening absorber at .
The intervening system at shows three main components: a, 1.9885b and 1.9885c, spanning a velocity range of km s-1 (see Fig. 5). It presents HI and high-ionization lines (SiIV, CIV). We could not constrain the SiIV 1393 transition because it is blended with the saturated OI 1302 line from the GRB host galaxy. The derived column densities are given in Table 5. We could not separate the three components for HI. The total HI column density is log(HI)=18.2 0.4 cm-2.
| Transition | 1.9885a | 1.9885b | 1.9885c |
|---|---|---|---|
| CIV | 13.780.05 | 14.20.1 | 13.790.04 |
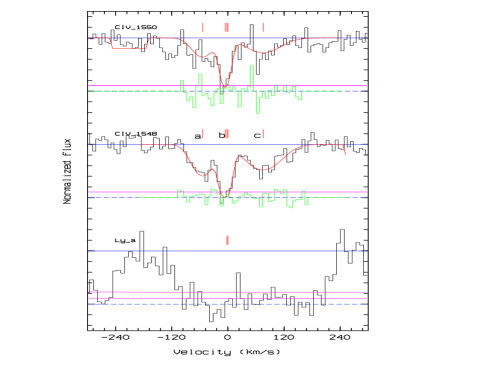
3.6 The intervening absorbers at and at .
We discuss the intervening system at and together, because the velocity shift between them is very small. They show high ionization line (CIV) and low ionization line (CII), (see Table 6 and Fig. 6).
| Transition | 1.5664a | |
| CII | 13.60.2 | |
| CIV | 13.700.07 | |
| Transition | 1.5691a | 1.5691b |
| CII | - | 13.40.3 |
| CIV | 14.160.08 | 14.10.1 |
4 The absorption system: physical properties of the GRB environment and host galaxy ISM
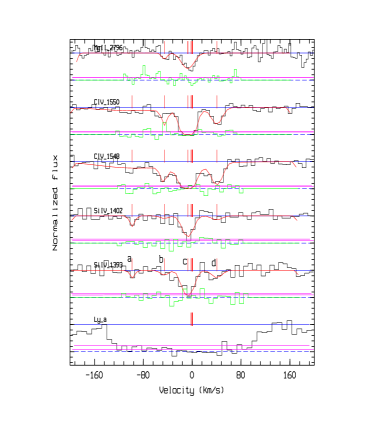
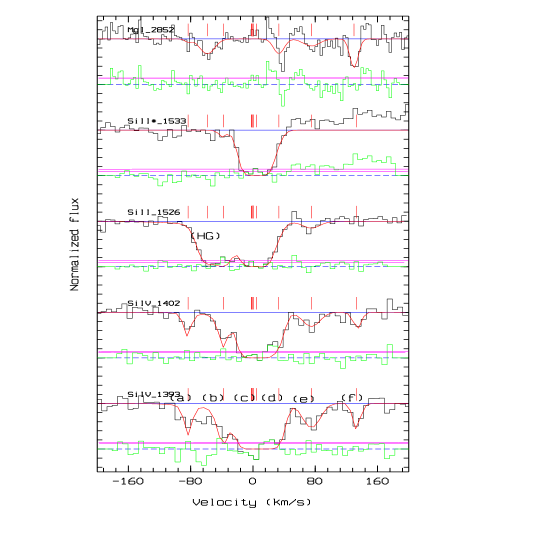
This system is most likely associated with the GRB host galaxy. Likewise most GRB host galaxy absorption systems (e.g. Fiore et al. 2005; D’Elia et al. 2007; Vreeswijk et al. 2007; Prochaska et al. 2006, 2008; D’Elia et al. 2008) it presents many components, spanning a rather large velocity range ( km s-1). Interestingly, different components exhibit different transitions: some exhibit low-ionization lines, high-ionization lines and fine-structure lines, some exhibit low-ionization lines only. An example is given in Figure 7. Six components, labeled from (a) to (f), are identified for the SiIV and CIV doublets, spanning a velocity range from -75 to +140 km s-1. Each component has a width from 10 to 25 km s-1. Component (c) has nearly zero velocity shift and it may be associated with the GRB surrounding medium, because of the strong Si II* the high-ionization transitions and the fact that this component is not detected in MgI. Fainter, but still significant Si II* lines are associated with components (d) and (e) too. On the other hand, the Si II component labeled (HG) as “host galaxy” at km s-1 is not present in either Si IV and Si II* transitions, suggesting that this component is due to some host galaxy cloud along the line of sight not modified by the GRB radiation field. For this component, Mg I is seen in absorption (Fig. 7), implying a distance from the GRB site pc (Prochaska et al. 2006).
The complex line profile, and the fact that different components may exhibit physically different line transitions, made it impossible to fit the system with a single Voigt profile. Therefore we were forced to identify the different components, before we could derive the column densities through a fitting procedure. The main goal of this work is indeed to disentangle the relative contribution of the different components. We use the less saturated transitions to guide this identification. We identified 7 components for the system ((a) through (f), and (HG); see Fig. 7). The redshifts of components (a) to (f), and therefore their velocity shifts with respect to , which has been taken as a reference, were determined using the CIV and SiIV lines. The redshift of the (HG) component was determined by using the SiII transitions. The redshifts were taken fixed when fitting all other lines belonging to each component with Voigt profiles. The Doppler parameters of these lines were also linked together. The column densities of non saturated and moderately saturated transitions of each component of the main absorption system at are given in Table 7. Strongly saturated lines could not be used for column density evaluation, and accordingly a “SAT” is given in the tables for the corresponding transitions.
To test the robustness of the results, in terms of the accuracy and stability, we performed many fits, using several combinations of line components. We found that the results presented in Table 7 provide a good compromise between increasing the statistical precision of the fit, obtained by increasing the number of components fitted simultaneously, and the stability/repeatability of the results. The latter is degraded when the number of fitted parameters is increased, because of the increasingly complex shape of the hypersurface in the parameter space, which may contain many local minima. We verified that the total best-fit column density of each system is stable, within the statistical errors, changing the number of components in each system.
| Transition | 2.1992a | 2.1992(HG) | 2.1992b | 2.1992c | 2.1992d | 2.1992e | 2.1992f |
| km s-1 | -83.26 | -58.60 | -37.88 | -0.39 | +33.15 | +77.54 | +136.73 |
| MgI | 11.80.1 | 11.8 | 12.00.1 | 11.60.2 | |||
| OI | - | 15.40.3 | - | - | - | ||
| OI* | - | - | - | 15.10.1 | 14.00.2 | 13.7 | - |
| OI** | - | - | - | 14.530.08 | 13.40.3 | 13.7 | - |
| MgII | 14.60.3 | 14.80.6 | 13.60.3 | 13.40.3 | 11.30.5 | ||
| CII | 15.50.4 | 14.60.2 | 14.60.5 | 14.20.3 | 13.060.21 | ||
| CII* | - | 13.3 | - | 14.60.1 | 14.20.3 | 13.50.2 | |
| SiII | 14.26 | ||||||
| SiII* | - | 13.0 | - | ||||
| AlII | 12.900.05 | 14.00.3 | 12.10.2 | 12.150.07 | 10.60.5 | ||
| AlIII | 11.80.1 | 12.090.04 | 11.300.3 | - | - | ||
| CIV | 13.400.05 | 13.26 | 13.150.09 | 15.00.2 | 13.630.07 | 13.780.03 | 13.120.07 |
| SiIV | 13.070.07 | 13.17 | 13.20.1 | 14.30.2 | 13.30.1 | 13.060.06 | 12.760.09 |
| NV | - | - | - | 14.060.08 | 15.30.7 | - | - |
| OVI | - | - | - | 15.21.9 | 14.60.2 | - | - |
| Fe | 2.1992a | 2.1992(HG) | 2.1992b | 2.1992c(1) – 2.1992c(2) | 2.1992d | 2.1992e | 2.1992f |
| km s-1 | -83.26 | -58.60 | -37.88 | -13.3 / +15.74 | +33.15 | +77.54 | +136.73 |
| FeII | - | 13.670.04 | 13.750.03 | 13.30.1 / 13.730.04 | - | 14.30.4 | - |
| FeII* | - | - | - | - / 13.360.07 | - | - | - |
This component is blended with the host galaxy component (HG), so
we cannot determine the relative column density.
Saturated
component.
Component confused by another one shifted to
5.5 km s-1 with respect to (f) position.
4.1 Low-ionization lines
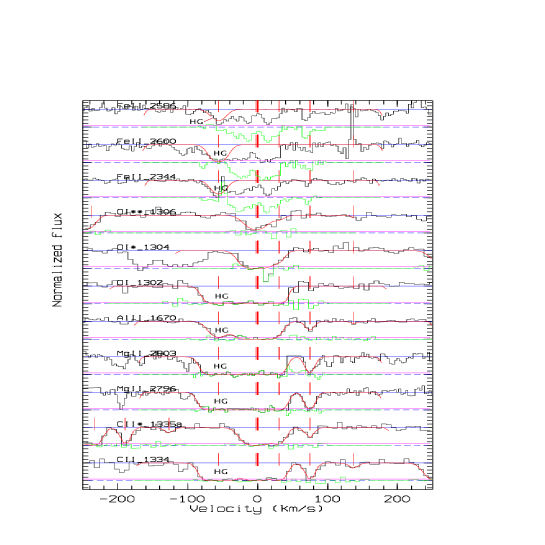
Strong low-ionization lines were detected for all components. In four cases (MgII, CII, AlII and AlIII) reliable estimates of the ion column density for (c), (d), (e), (f) and (HG) components were possible. In all cases, strong blending of the (a) and (b) components with the (HG) one renders such an estimate difficult for these components. We observe the SiII (Å, Å, Å, Å, Å), CII (Å), MgII doublet (Å, Å), AlIIÅ and the AlIII doublet (Å, Å). From Table 7 we can see that the host galaxy component (HG) is present in all low ionization lines (see also Fig. 8).
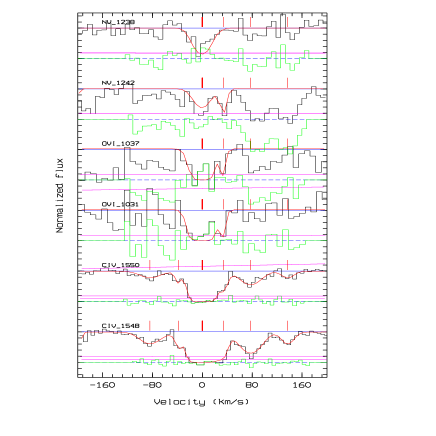
4.2 High-ionization lines
Figure 9 shows all high-ionization lines (NV doublet, OVI doublet) identified together with SiIV and CIV. Significant column densities of CIV and SiIV are detected for all six components (a) to (f). NV and OVI are detected for components (c) and (d) only. Confusion with the Lyman- forest makes it difficult to search for faint OVI and NV lines for the other components or to compute robust upper limits. No high-ionization lines were detected for component (HG).
4.2.1 The atoms MgI and OI
We detect significant amounts of both neutral Mg and O. The first ionization energy of Mg lies below the 1 Ryd threshold, at 7.6 eV. This transition is not screened by H absorption and therefore Mg would be ionized easily by the strong radiation coming from the GRB. As a consequence, the presence of significant MgI implies large distances ( pc, Prochaska et al. 2006; Chen et al. 2007) of the gas clouds from the GRB site. MgI is detected for components (HG), (d) and (e) (see Table 7 and Fig. 7). These components are therefore likely to be associated with gas clouds which are little affected by the GRB radiation field. MgI of components (a) and (b) is difficult to constrain because of the blending with the strong HG component. MgI is not detected for component (c), which has very high-ionization and fine-structure lines, and for component (f). It should be noted that a line is present at 5.5 km s-1 from the position of MgI at the redshift of component (f), a shift big for this line to be associate to the component.
4.2.2 Fine-structure lines
We detected several fine-structure lines associated with components (c), (d), (e) and (f). We identified the following lines arising from fine structure levels: SiII*1194Å, SiII*1197Å, SiII*1264Å, SiII*1309Å, SiII*1533Å, CII*1335aÅ, OI*1304Å, OI**1306Å. The redshifts of all these lines were fixed to those of the corresponding components in the CIV and SiIV systems.
We also detect three FeII fine-structure lines: FeII*1618Å, FeII*1621Å, FeII*2365Å. The redshift of these lines is shifted from that found for component (c) using the CIV and SiV systems by about 20 km s-1, see Fig. 10. This suggests that additional structure is actually present in this absorption system. In the following we consider the FeII fine-structure lines as associated with component (c) without making further splitting in velocity. No FeII fine-structure transition is found for the other six components and, in particular, no fine-structure line was found at a redshift consistent with that of component (HG).
5 Properties of the medium surrounding the GRB
5.1 Fine-structure line excitation I: constraining the density of the gas
As shown in section 4.2.2, for this burst we found several fine-structure transitions. These levels can be populated (1) indirectly through excitation by ultraviolet photons, followed by fluorescence, (2) through collisions between the ion and other particles like free electrons, (3) and/or via direct photo-excitation by infrared photons. The first mechanism has been conclusively shown to be the preferred mechanism in two cases: GRB060418 (Vreeswijk et al. 2007) and GRB080319B (D’Elia et al. 2008). The latter mechanism is the less dominant one and we will not consider it. Whatever the case, the physical conditions of the interstellar medium can be probed through the detection of transitions from these energetically lower excited levels.
For GRB050922C fine-structure transitions are present in component (c), (d), (e) and (f), (see Table 7).
If we assume that collisions with electrons are the dominant excitation mechanism, we can put constraints on the electron density of the components where we found such transitions. A method to estimate the electron density is presented by Prochaska et al. (2006). We can compare our results on the SiII*/SiII and FeII*/FeII ratios with Fig. 9 of Prochaska et al. (2006), showing collisional excitation of the first excited state relative at the ground state for Si+, Fe+ and O0. We can only use Si II and Fe II because oxygen is satured. From this comparison we find for SiII in the range cm-3 for component (c), in the range cm-3 for component (d), cm-3 for component (e) and cm-3 for component (f).
We have evaluated the electron density of component (c) also using the Fe II transitions. This produces a result cm-3 inconsistent with the previous estimate. A possible reason for this inconsistency may be our simple description of a complex system (the excited transition lines are shifted by 20 km s-1 from the ground level lines).
5.2 Fine-structure line excitation II: constraining the radiation field
A competitive mechanism responsible for the presence of fine-structure levels is indirect UV pumping. If this is the dominant excitation mechanism, we can constrain the GRB radiation field and the distance of the gas from the GRB. Prochaska et al. (2006) using the PopRatio code developed by Silva & Viegas (2001, 2002), analyzed the relation between the far UV radiation field intensity and the relative fraction of excited fine-structure states with respect to their ground levels (for O I, Si II and Fe II, see their Figs. 7 and 8). In the following we make use of these figures to estimate the radiation-field intensity from our column density data.
Using Fig. 7 of Prochaska et al. (2006), we find that our measured ratio log( for component (c) implies a radiation field intensity (90% confidence interval; erg cm-2 s-1 is the Habing constant). We note that the Si II lines of this component are moderately saturated and therefore that additional systematic uncertainty may affect their column densities determination. Fortunately, for this component we detect also Fe II and Fe II∗ transitions. The log() is , implying a radiation field intensity , consistent with the Si II determination, within the rather large statistical errors.
A similarly high value of is found for component (f) only, for which we found log(, implying a radiation field intensity of .
For component (d) and (e) we found log( and respectively, implying radiation field intensity and , both significantly lower than for component (c). We note that the Si II lines of component (e) are certainly not saturated or blended with other components, while that of component (d) may be slightly blended and/or saturated.
While UV pumping is the likely mechanism for the population of fine structure levels in this GRB spectrum, we cannot rule out collisional exitation. The “smoking gun” of the UV pumping mechanism is time variability of fine structure lines (Vreeswijk et al. 2007; D’Elia et al. 2008). Unfortunately we have only one single observation of the GRB050922C and therefore we cannot look for line variations. We note that components (c) and (f) experience the highest radiation field.
6 Discussion
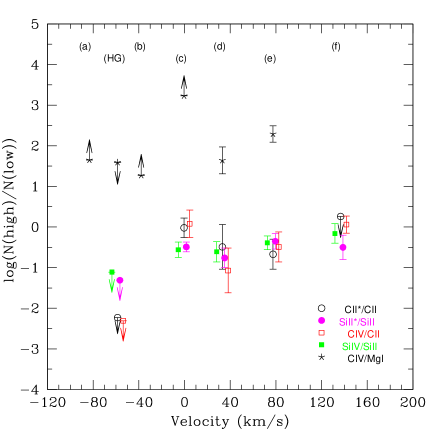
6.1 Distances from the burst region
We plot in Fig. 11 high to low-ionization line ratios and fine structure to ground state line ratios for the seven components of the system. The different behaviour of component (HG) with respect to all the others and in particular to components (c) and (f) is evident from this plot. The most natural explanation for this behaviour is to assume that the various components do not belong to the same physical region in the host galaxy. The strength of the high ionization lines and of the fine-structure lines, the absence of MgI absorption, the analysis of the ratio of the excited levels to ground levels and the metallicity analysis suggest that components (c) and (f) are closer to the GRB site than the other components. To better quantify this suggestion we performed detailed time evolving photoionization calculations using the GRB light-curve to estimate the photoionization fractions (assuming an optically thin medium). We used the code initially developed by Nicastro et al. (1999) and updated by Krongold et al. (2008). We assumed a constant density profile throughout the cloud, and a plane parallel geometry. We studied gas densities between 10 cm-3 and cm-3. The ionizing continuum was assumed to be a power law, photons cm-2 s-1, with cutoffs at low and high energy. The high energy cutoff was fixed at Hz.
Our calculations require that component (c), in order to reproduce simultaneously the lines by OVI, NV, CIV, SiIV, FeII and OI, the gas density would have to be between 105 and 107 cm-3, and the distance between 200 and 300 pc from the GRB site222this density is implied only if both the high and low ionization lines come from the same gas phase.
The presence of neutral elements in the spectra of GRB afterglows can place strong constraints on the distance of the gas from the GRB. For example, Prochaska et al. (2006) suggest that components showing MgI absorption should be located at distances greater than 100 pc from the GRB site. In the afterglow spectra of GRB050922C we detect neutral MgI for three components: (HG), (d) and (e), see Fig. 7. In particular, the presence of strong MgI absorption, absence of high-ionization lines and excited transitions, and low metallicity, suggest that the (HG) component is located further away from the GRB site, in a region of the host galaxy not strongly affected by the GRB radiation field. Our time evolving photoionization calculations require a distance of at least 700 pc from the GRB site for this component. Components (d) and (e) do show fine-structure transitions. If the dominant excitation mechanism is UV pumping from the GRB radiation field, this suggests a distance kpc from the GRB site (Prochaska et al. 2007). Our time evolving photoionization calculations require a distances pc for both components, to be consistent with the observed C and Si line ratios. Component (d) exhibits also high-ionization absorption (NV, PV, OVI). The presence of these highly ionized ions, along with the presence of low ionized ones (O I, Mg I, Fe II), can be explained at a distance of 300 pc from the GRB site if the density of this cloud is high enough, i.e. cm-3.
For components (a) and (b) we do not have information on the abundance of neutral elements, because these transitions occur at wavelenghts affected by the strong absorption of component (HG). The detection of CIV implies a distance to the GRB site closer than pc for both components (a) and (b).
6.2 Carbon and iron abundances
Following D’Elia et al. (2007), we calculated the average [C/Fe] ratio, an estimator of the enrichment of the elements relative to iron. We measure a mean [C/Fe], consistent with the value predicted by the models of Pipino & Matteucci (2004, 2006) for a galaxy younger than 1 Gyr subject to a burst of star-formation. In such a case also a low [Fe/H] value is predicted, close to that in Table 8, and similar to what found by D’Elia et al. (2007) for GRB050730. Again, we note that mean abundance estimates may be affected by large systematic uncertainties.
6.3 Metallicity of the main system
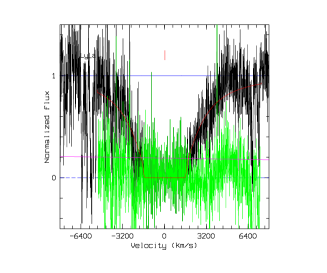
Figure 12 shows the Ly- absorption features. Hydrogen absorption results in very broad lines with damped wings, reaching well beyond the velocity range of the heavier ions. Therefore is clearly impossible to separate the seven components identified from the analysis of C IV, Si IV and Si II, and we can only estimate the metallicity of the host galaxy in terms of the ratio [X/H] between the total absorption column of the X element with respect to that of hydrogen.
For this burst we measure a Hydrogen column density cm-2, similar to the average value found by Jakobsson et al. (2006) for a sample of Swift GRBs.
Table 8 gives, for each element, the total column density of the seven components obtained by adding the column densities for each ion (including ground states and the excited fine-structure levels, if these are present) and the metallicity of the element on a log scale. Taken at face value these metallicities are rather small. Furthermore, a fraction of Hydrogen may well be ionized, in particular that associated to the components closer to the GRB site (Waxman & Draine 2000; Prochaska et al. 2007), suggesting even lower metallicities. On the other side, the quoted metallicities are not corrected for dust depletion. This is likely to be particuarly important for iron (see Savaglio 2006) while it should be negligible for Silicon. The Si metallicity in Table 8 is formally higher than that of Fe, but statistically consistent within the large error bars. In conclusion, even considering a little contribution from ionized Hydrogen, we can exclude metallicities higher than solar.
This GRB was observed by the Swift X-ray telescope (XRT) Swift at the same time of the UVES observations. It is therefore possible to compare directly the column density determined from the Ly- observation to that obtained from X-ray spectroscopy. The spectrum was fitted using model including a power law reduced at low energy by intervening absorption at the redshift of the GRB host galaxy. An additional local absorber was included in the fit to account for Galactic gas along the GRB line of sight. The column density of this absorber was fixed at cm-2 (Dickey & Lockman 1990). Solar abundances were adopted for the Galactic absorber while the metallicity of the GRB rest frame column density was fixed either to solar metallicities or to 1/10 solar. The best fit rest frame NH values are (, and ( for the two cases respectively. The latter value is higher than what found using the Lyman- in the UVES spectrum a result consistent with what found by Jakobsson et al. (2006) from other GRBs.
| Transition | (cm-2) | [X/H] |
|---|---|---|
| HI | - | |
| C | ||
| Si | ||
| O | ||
| N | ||
| Al | ||
| Mg | ||
| Fe |
(a) Total column density of the element.
The metallicity estimates can be compared to metallicity derivations that use optical emission lines from the GRB host galaxy. Savaglio (2006) found an average value of -0.15 for a sample of 11 GRB hosts at z, a value significantly higher than those in Table 8. The values in table 8 are significantly lower than this feature. As discussed above several effects can play a role, the main three being the exact correction for dust depletion, the amount of ionized Hydrogen and the fact that we cannot estimate the H column density of each single component. This is particularly relevant, since different components can be associated with regions of the host galaxy with very different metallicities. On the other hand, emission line spectroscopy of GRB host galaxies is very difficult to perform at , meaning that at high redshift absorption line spectroscopy of GRBs is probably the only tool to estimate host metallicities.
6.4 Metallicity of the intervening systems
The Ly- of three of the five intervening systems lies in the UVES observed band. In these cases we were able to estimate the HI column density (see Sections 3.2, 3.4 and 3.5), and therefore the metallicity following the same approach used for the main system.
For the z=2.1416 intervening system we measure [C/H] = . For the z=2.077 intervening system we measure [C/H]= -1.4, [Si/H]= -1.4, [Fe/H]= -1.3, [N/H]= -1.5, [O/H]= -1.4. For this system we can also estimate the SiIV/CIV ratio, which is for component (a) and for component (b). These values are near the median value performed by Songaila (1998). For the z=2.0081 intervening system we measure [C/H] = , [Si/H] = and [Mg/H] = . The SiIV/CIV ratio, which is for component (c), is similar to the median value computed by Songaila (1998) but at the lower end of the range found by D’Odorico & Petitjean (2001) for systems at z. Finally, for the z=1.9885 intervening system we measure [C/H] = . These values are not corrected for the fractions of Si and C in ions different from those in observed transitions and reported in Tables 2, 4 and 5, and, most important are not corrected for the fraction of H which may be ionized. This so called ‘ionization correction’ is a rather steep function of the observed HI column density (Péroux et al. 2007), and for low observed column densities, such those for the three intervening systems under study, may be as large as -0.3 - -0.4. Accounting for this ionization correction, the [C/H] of the z=2.0081 and z=1.9885 systems appear significantly higher than that found for the GRB host galaxy in Table 8. They are also higher than the typical metallicity found in DLA and sub-DLA at similar redshifts (Péroux et al. 2007). We remark however that our determinations are based on rather sparse line detections and therefore that a more systematic work is needed to investigate further this issue.
7 Conclusions
Using the VLT high resolution spectrometer UVES, we have obtained a high signal to noise () spectrum of the optical afterglow of GRB050922C. Five intervening systems between and have been identified along the GRB line of sight, in addition to the main system at , which we identify as the redshift of the GRB host galaxy. The spectrum shows that the ISM of this galaxy is complex, with at least seven components contributing to the main absorption system. These systems show both high- and low-ionization lines, fine-structure lines and neutral element absorption lines, thus suggesting wide ranges of distances to the GRB site and physical properties of the absorbing clouds. The analysis of ratios between high and low ionization lines, the presence of strong fine structure line and the analysis of the metallicity of the clouds allow us to put quantitative constraints on the distance of the absorbing clouds to the GRB site. In particular, we find that component (c) is likely to be the closest component, with a distance pc from the GRB site. Component HG is likely to be farthest component, with a distance pc.
We calculated the average metallicity of the GRB host galaxy by adding the column densities of all seven components. This turned out to be between 1/100 and 1/10 solar, even for an element like Silicon, which should not be strongly affected by dust depletion. This value is roughly consistent with what is found by absorption spectroscopy in other z=2-4 GRBs (Savaglio 2006; Prochaska et al. 2007) but is lower than the average found by emission line spectroscopy at z (Savaglio 2006; Savaglio et al. 2008). Interestingly, the C fraction of three intervening systems at z is nearly solar, and therefore significantly higher than that of the GRB host galaxy.
The element transitions detected, the complexity of the components and the column densities measured are similar to the other high redshift GRB high resolution spectra present in the literature. We have no evidence of both the high velocity components reported for GRB021004 (Mirabal et al. 2003; Fiore et al. 2005; Starling et al. 2005), GRB030226 (Klose et al. 2004) and GRB050505 (Berger et al. 2006), and the strong asymmetry reported for GRB030329 (Thöne et al. 2007).
Acknowledgements.
We thank an anonymous referee for comments that improved the presentation. We thank C. Porciani, V. D’Odorico, H.-W. Chen, J. X. Prochaska and P.M. Vreeswijk for useful discussions. Part of this work was supported by MIUR COFIN-03-02-23 and INAF/PRIN 270/2003 and ASI contracts ASI/I/R/039/04 and ASI/I/R/023/05/0. SP and VD acknowledge support from ASI grants. SP, SDV and MDV thank the Dark Cosmology Centre of Copenhagen, where part of this work was done, for the friendly and creative atmosphere. D.M. acknowledges the Instrument Center for Danish Astrophysics for support and thanks the Dark Cosmology Centre (funded by the DNRF). SDV is supported by SFI.References
- Ballester et al. (2000) Ballester, P., Modigliani, A., Boutquin, O., et al. 2000, Messenger, 101, 31
- Berger et al. (2006) Berger, E., Penprase, B. E., Cenko, S. B., et al. 2006, ApJ, 642, 979
- Chen et al. (2007) Chen, H.-W., Prochaska, J. X., & Bloom, J. S. 2007, ApJ, 668, 384
- Dekker et al. (2000) Dekker, H., D’Odorico, S., Kaufer, A., Delabre, B., & Kotzlowski, H. 2000, in Proc. SPIE Vol. 4008, p. 534-545, Optical and IR Telescope Instrumentation and Detectors, Masanori Iye; Alan F. Moorwood; Eds., ed. M. Iye & A. F. Moorwood, 534–545
- D’Elia et al. (2007) D’Elia, V., Fiore, F., Meurs, E. J. A., et al. 2007, A&A, 467, 629
- D’Elia et al. (2008) D’Elia, V., Fiore, F., Perna, R., et al. 2008, ArXiv e-prints, 804
- Dessauges-Zavadsky et al. (2006) Dessauges-Zavadsky, M., Chen, H.-W., Prochaska, J. X., Bloom, J. S., & Barth, A. J. 2006, ApJ, 648, L89
- Dickey & Lockman (1990) Dickey, J. M. & Lockman, F. J. 1990, ARA&A, 28, 215
- D’Odorico et al. (2004) D’Odorico, V., Cristiani, S., Romano, D., Granato, G., & Danese, L. 2004, MNRAS, 424, 23
- D’Odorico & Petitjean (2001) D’Odorico, V. & Petitjean, P. 2001, A&A, 370, 729
- Fiore et al. (2005) Fiore, F., D’Elia, V., Lazzati, D., et al. 2005, ApJ, 624, 853
- Fontana & Ballester (1995) Fontana, A. & Ballester, P. 1995, ESO Messenger, 80, 37
- Golenetskii et al. (2005) Golenetskii, S., Aptekar, R., Mazets, E., et al. 2005, GRB Coordinates Network, 4030, 1
- Hall et al. (2002) Hall, P. B., Gunn, J. E., Knapp, G. R., et al. 2002, in Astronomical Society of the Pacific Conference Series, Vol. 255, Mass Outflow in Active Galactic Nuclei: New Perspectives, ed. D. M. Crenshaw, S. B. Kraemer, & I. M. George, 161–+
- Jakobsson et al. (2006) Jakobsson, P., Fynbo, J. P. U., Ledoux, C., et al. 2006, A&A, 460, L13
- Jakobsson et al. (2005) Jakobsson, P., Fynbo, J. P. U., Paraficz, D., et al. 2005, GRB Coordinates Network, 4017, 1
- Klose et al. (2004) Klose, S., Greiner, J., Rau, A., et al. 2004, AJ, 128, 1942
- Krongold et al. (2008) Krongold, Y., Nicastro, F., Elvis, M., et al. 2008, in Revista Mexicana de Astronomia y Astrofisica Conference Series, Vol. 32, Revista Mexicana de Astronomia y Astrofisica Conference Series, 123–127
- Lazzati et al. (2006) Lazzati, D., Perna, R., Flasher, J., Dwarkadas, V. V., & Fiore, F. 2006, MNRAS, 372, 1791
- Mirabal et al. (2003) Mirabal, N., Halpern, J. P., Chornock, R., et al. 2003, ApJ, 595, 935
- Nicastro et al. (1999) Nicastro, F., Fiore, F., Perola, G. C., & Elvis, M. 1999, ApJ, 512, 184
- Norris et al. (2005) Norris, J., Barbier, L., Burrows, D., et al. 2005, GRB Coordinates Network, 4013, 1
- Perna & Lazzati (2002) Perna, R. & Lazzati, D. 2002, ApJ, 580, 261
- Péroux et al. (2007) Péroux, C., Dessauges-Zavadsky, M., D’Odorico, S., Kim, T.-S., & McMahon, R. G. 2007, MNRAS, 382, 177
- Pipino & Matteucci (2004) Pipino, A. & Matteucci, F. 2004, MNRAS, 347, 968
- Pipino & Matteucci (2006) Pipino, A. & Matteucci, F. 2006, MNRAS, 365, 1114
- Piranomonte et al. (2005) Piranomonte, S., Magazzu, A., Mainella, G., et al. 2005, GRB Coordinates Network, 4032, 1
- Prochaska et al. (2006) Prochaska, J. X., Chen, H.-W., & Bloom, J. S. 2006, ApJ, 648, 95
- Prochaska et al. (2007) Prochaska, J. X., Chen, H.-W., Dessauges-Zavadsky, M., & Bloom, J. S. 2007, ApJ, 666, 267
- Prochaska et al. (2008) Prochaska, J. X., Dessauges-Zavadsky, M., Ramirez-Ruiz, E., & Chen, H.-W. 2008, ArXiv e-prints, 806
- Rykoff et al. (2005) Rykoff, E. S., Yost, S. A., Rujopakarn, W., et al. 2005, GRB Coordinates Network, 4012, 1
- Savaglio (2006) Savaglio, S. 2006, New Journal of Physics, 8, 195
- Savaglio et al. (2008) Savaglio, S., Glazebrook, K., & Le Borgne, D. 2008, ArXiv e-prints, 803
- Silva & Viegas (2001) Silva, A. I. & Viegas, S. M. 2001, Computer Physics Communications, 136, 319
- Silva & Viegas (2002) Silva, A. I. & Viegas, S. M. 2002, MNRAS, 329, 135
- Songaila (1998) Songaila, A. 1998, AJ, 115, 2184
- Srianand & Petitjean (2000) Srianand, R. & Petitjean, P. 2000, A&A, 357, 414
- Srianand & Petitjean (2001) Srianand, R. & Petitjean, P. 2001, A&A, 373, 816
- Starling et al. (2005) Starling, R. L. C., Wijers, R. A. M. J., Hughes, M. A., et al. 2005, MNRAS, 360, 305
- Sudilovsky et al. (2007) Sudilovsky, V., Savaglio, S., Vreeswijk, P., et al. 2007, ArXiv e-prints, 705
- Thöne et al. (2007) Thöne, C. C., Greiner, J., Savaglio, S., & Jehin, E. 2007, ApJ, 671, 628
- Vreeswijk et al. (2007) Vreeswijk, P. M., Ledoux, C., Smette, A., et al. 2007, A&A, 468, 83
- Waxman & Draine (2000) Waxman, E. & Draine, B. T. 2000, ApJ, 537, 796