Highly ionized gas on galaxy scales: mapping the interacting Seyfert galaxy LEDA 135736††thanks: Based on observations made with ESO Telescopes at the Paranal Observatory under programme 078.B-0194(A).
Abstract
We have used the VIMOS IFU to map the properties of the Seyfert 1.9 galaxy LEDA 135736. These maps reveal a number of interesting features including: an Extended Narrow Line Region detectable out to kpc, an area of intense star formation located at a projected distance of 12 kpc from the centre, an elliptical companion galaxy, and kinematic features, aligned along the long-axis of the ENLR, that are consistent with radio jet-driven mass outflow. We propose that the ENLR results from extra-planar gas ionized by the AGN, and that the AGN in turn might be triggered by interaction with the companion galaxy, which can also explain the burst of star formation and morphological features. Only about two percent of the ENLR’s kinetic energy is in the mass outflow. We infer from this that the bulk of mechanical energy imparted by the jet is used to heat this gas.
keywords:
galaxies: Seyfert – galaxies: interactions – galaxies: evolution – galaxies: kinematics and dynamics – galaxies: individual: LEDA 135736– galaxies: structure.1 Introduction
In the hierarchical picture of galaxy evolution, the formation and growth is driven by mergers. Such events affect galaxies on all scales down to their nuclei where they can trigger AGN activity (e.g. Springel et al., 2005; di Matteo et al., 2005; Cattaneo et al. 2005). Observationally, there is some evidence for a link between AGN and mergers (e.g. Sanchez et al., 2005; Kuo et al., 2008). But this connection is difficult to establish in general as the brightest AGN typically reside at redshifts too large to determine the properties of the host galaxy and its neighbours.
It is increasingly recognized, however, that feedback generated by the AGN itself plays a crucial role in galaxy evolution. A jet powered by an AGN can drive large amounts of material out of the host system and thus significantly affect its subsequent evolution. Alternatively the AGN might primarily act on the galaxy halo, heating the halo, reducing the net cooling rate and possibly expelling some material. These two modes of feedback are often referred to as the “quasar-mode” and “radio mode” respectively. Models that incorporate AGN feedback can, for instance, account for the observed galaxy luminosity functions (Croton et al. 2006, Bower et al. 2006) using the “radio mode” and can reproduce the observed - correlation (e.g. di Matteo et al. 2005) primarily using the “quasar mode”. Observational evidence of quasar-mode feedback is emerging for in intrinsically bright AGN such as QSOs (Letawe et al.,2008) and compact radio sources (Nesvadba et al., 2007; Holt et al., 2008). Meanwhile observations of X-ray cavities associated with radio sources in galaxy clusters provide clear evidence of the effectiveness of the “radio mode” (Birzan et al. 2004, Allen et al. 2006). A key issue is to observationally determine the relative importance of these two modes in lower mass systems. In this letter we present VIMOS IFU observations of a nearby, low luminosity AGN, the Seyfert 1.9 galaxy LEDA 135736 at a redshift of . The AGN in this system ionizes an Extended Narrow Line Region (ENLR) up to at least 9 kpc. Interaction with an elliptical companion, at a projected distance of 11.6 kpc, is probably triggering jet activity (as well as off-centre star formation) that we observe indirectly in the H and [OIII] kinematic maps.
2 Data Reduction and Analysis
LEDA 135736 was observed with the VIMOS Integral Field Unit (IFU) as part of a project to map the properties of a sample of 24 galaxies selected randomly from the Sloan Digital Sky Survey (SDSS; York et al. 2000). All data were obtained using the medium resolution setup (wavelength range: 5000 - 9000 Å, dispersion, 2.5 Å/pix) covering a field-of-view of 27x27 arcsec (0.67 arcsec/spaxel). We obtained two 30 minute exposures on this galaxy during service mode observations in January 2007 (in seeing conditions of about 1.5 arcsec). A detailed description of the data reduction will be given in a forthcoming paper (Gerssen et al, 2008). Briefly, we used the ESO VIMOS pipeline to perform the basic reduction steps up to spectrum extraction and wavelength calibration. The post-processing steps (e.g. throughput correction, flux calibration, and exposure combination) to create the final data cube (,,) were performed using custom written IDL scripts.
To analyse the emission line data, we independently fit the H+[NII] group, the [OIII] doublet, the [SII] doublet and the H emission line. Each line is fit with a single Gaussian, and for each set of lines the relative position and widths of each line are fixed to each other as they trace the same kinematics. For example, in a three component fit to the H+[NII] emission lines we tie the centroids and line widths to the H line. In this case there are six free parameters: the amplitudes of the three emission lines, the line centroid and line width, and a constant continuum level. We do not include an additional broad H component in the emission line analysis. The Broad Line Region (BLR) in LEDA 135736 is only detectable in the H line and then only in spectra close to the nucleus, where it is so broad as to have no influence on the fit.
3 Results
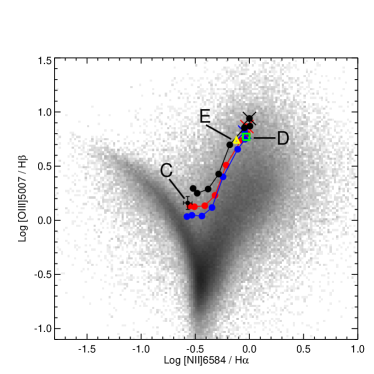
The galaxy LEDA 135736 is a Seyfert 1.9 at a distance111The luminosity distance is calculated assuming: =, =, = km s-1 Mpc-1. The scale is kpc/. of 293 Mpc. Its basic properties are listed in Table 1. It stands out in our sample because the radial dependence of its strongest emission lines (H, H, [NII]6584 [OIII]5007) indicates a high ionization state out to large radii, see Figure 1. In this so-called BPT diagram (Baldwin et al. 1981) we plot results derived using a synthetic annulus-aperture (2 arcsec width) of increasing radius. Remarkably, LEDA 135736 is located on the AGN ‘wing’ of the BPT diagram out to a radius of at least 9 kpc. This implies a role for strong ionizing radiation, probably associated with the AGN, on galaxy-wide scales.
| Basic | |
|---|---|
| RA (J2000) | 09h59m39.8s |
| Dec (J2000) | +00d35m14s |
| Type | Sy 1.9 |
| Luminosity | |
| (erg s-1) | |
| (erg s-1) | |
| (erg s-1) | |
| (erg s-1 Hz-1) | |
3.1 Morphology
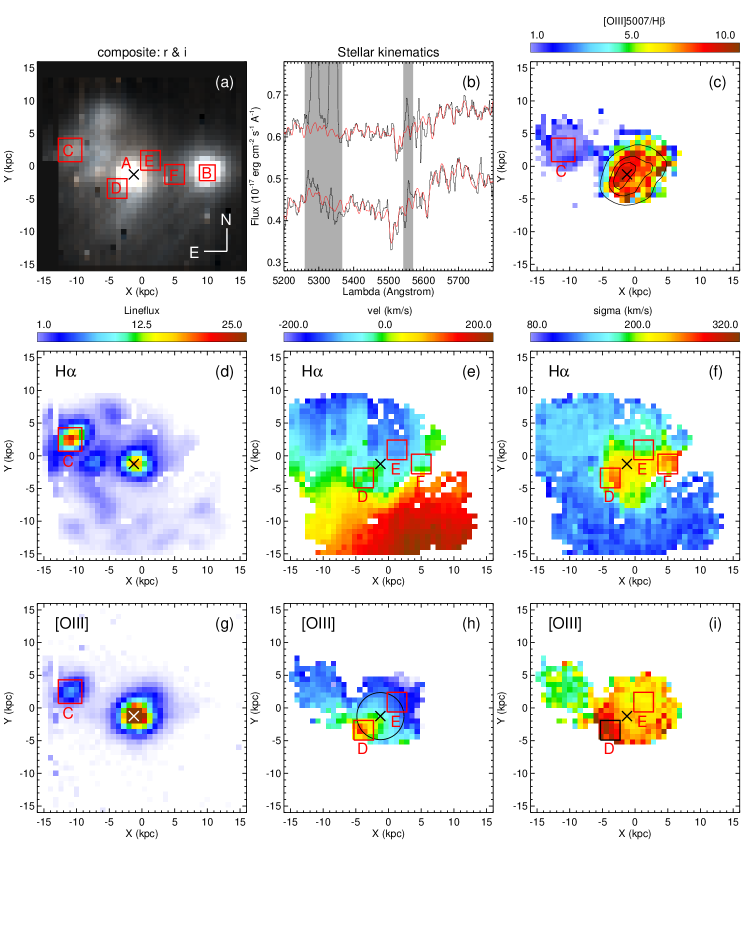
LEDA 135736 displays a complex morphological structure that is strongly wavelength dependent. A composite colour image derived from our data cube is shown in panel (a) of Figure 2. The two brightest knots, labelled A and B, coincide respectively with the nucleus of the host and that of a nearby galaxy. Their projected separation is 11.6 kpc. Hence, it is likely that the two systems are interacting. A clear manifestation of interaction are the faint knots visible NE of the host nucleus. The knot labelled C coincides with the peak of a resolved ultraviolet source (GALEX database). The H and [OIII] line flux maps (panels d and g) respectively) do show prominent features in region C as well. Interestingly, the H peak intensity is somewhat stronger for the off-centre peak than on the nucleus itself. The average line ratios over region C (shown in Figure 1) are consistent with ionization by young stars. This area is likely associated with off-centre star formation (at projected kpc from the nucleus) triggered by interaction with the companion galaxy.
As the companion galaxy shows no emission lines we establish its nature using a near infrared H-band image obtained from the UKIRT Infrared Deep Sky Survey (UKIDSS; Lawrence et al. 2007). The surface brightness profile (derived with ELLIPSE in IRAF) is consistent with the light profile of an elliptical galaxy with an effective radius of kpc.
3.2 Stellar kinematics
To constrain the systemic velocities of the host and the companion we sum the spectra in our data cube over regions A and B. We use the pixel-fitting method of (Cappellari & Emsellem 2004) to fit the summed specta with a set of stellar template spectra observed with EMMI on the NTT (convolved to the VIMOS instrumental resolution of 7.3 Å). The comparison, shown in panel (b), between the stellar absorption line spectra extracted at locations A and B demonstrates that the companion galaxy is also close in velocity space ( km s-1).
3.3 Extended Narrow Line Region
To examine the result shown in Figure 1 in more detail we can use our data cube to derive the line ratios in each spatial element individually. The full 2-D line ratio map of [OIII]/H is shown in panel (c) of Figure 2. Consistent with our azimuthally averaged result (Fig. 1), the map shows an extended region of highly ionized gas. The observed line ratios require a very strong ionization field (hard UV spectrum) and are typical for the Narrow Line Region (NLR) of a Seyfert galaxy. Such highly ionized gas, not confined to the nuclear regions of a galaxy, is known as an Extended Narrow Line Region (ENLR) (e.g. Bennert et al., 2006). As the overplotted contours demonstrate, the spatially resolved part (5 kpc) of the ENLR in LEDA 135736 is somewhat elongated () with the long axis at a PA .
Panels (d) and (e) of Figure 2 respectively show the H flux and velocity field. The Balmer lines are relatively more sensitive to less strongly ionized radiation fields than the [OIII] line (as utilised by the BPT diagram) and so more closely traces gas ionized by young stars. The rotating disk traced by the H line is therefore probably unrelated to the ENLR, with gas ionized by normal star formation in the disk. Our radially-averaged results (Fig. 1) illustrate that out to kpc the [OIII] line includes contributions from both disk gas ionized by young stars, and the more highly ionoized gas from the AGN (the ENLR). Beyond kpc (including region C) star formation dominates, and the line ratios are consistent with normally star-forming galaxies.
3.4 Gas kinematics
The gas kinematics derived from the H and [OIII]5007 emission lines are shown in Figure 2 along the middle row and bottom row respectively. The average error on the best-fit (as described in section 2) line centroids and line widths is km s-1.
On a global scale the H velocity field (panel e) is consistent with a simple rotating disk model. Near the systemic velocity, however, the data are significantly distorted from the straight line zero velocity contour (green in our map) predicted by this model. The peak in the H velocity dispersion map (panel f) does not coincide with the nucleus itself but is located SE of it along the long-axis of the ENLR in a region that we label D. Interestingly, a second dispersion peak, labelled F, is visible in the direction of the companion galaxy. The off-centre dispersion peaks cannot be attributed to an unaccounted for broad line component as they are located well beyond the BLR.
The [OIII] kinematic maps (panels h & i) also show pronounced features in the off-centre region D. The observed velocity blob in this region is offset from the systemic velocity by about 150 km-1 and is located too far from the galaxy centre (kpc) to be related to the kinematics of the nucleus itself.
3.5 Other Wavelengths
LEDA 135736 has been detected in X-ray and Radio wavelengths at values typical for a Seyfert galaxy. Anderson et al. (2003) associate this system with an X-ray source in the ROSAT All Sky Survey (RASS) of log10(/erg s 42.86. From the NVSS 1.4GHz radio survey we derive a total luminosity of 7.7W Hz-1. The more accurate position and better resolution of the FIRST 1.4GHz survey shows that this radio source is centred on the host galaxy nucleus, coincident with the ENLR. It appears to be unresolved in these data implying an upper limit on its projected size of 7.2 kpc (see Fig. 2 panel h).
4 Discussion and Conclusions
The high ionization state of the ENLR (with a ratio [OIII]/ in the range 5-10) is suggestive of gas photo-ionized by the AGN. Ioniozation from star formation is not so hard, and shocks also tend to produce lower line ratios (Villar-Martín et al. 1999). With a radius along its long axis of kpc the ENLR is quite large. However, larger ENLRs extending up to 20 kpc in Seyfert galaxies have been observed before (Unger et al. 1987; Fraquelli et al. 2000). In order for the AGN ionizing radiation to reach such radii, the AGN ionization cone must be pointing out of the galaxy disk and excite the extra-planar gas (Storchi-Bergmann et al. 1992). The presence of this gas and its observed high velocity dispersion suggests kinematic heating by the AGN.
The detailed correspondence between features in radio maps and emission line images of Sy 2 galaxies suggest strong interactions between the radio jets and the ENLR (e.g. Falcke et al. 1998; (Villar-Martín et al. 1999). Hence, the blob of perturbed kinematics in LEDA 135736 (region D in Fig. 2) at kpc from the nucleus along the ENLR axis is expected to be closely aligned with the radio structure. Although we cannot discard alternative scenarios, an interesting possibility is that the kinematic perturbation has been triggered by interaction with the radio structures.
In this interpretation the observed kinematics reflect material being driven out by the jet. The impact of such an outflow on the surrounding medium stirs up the gas, presumably by the vortices trailing the jet shock-front, leading to large (random) gas motions. A caveat here is that the observed kinematics could also be attributed to gas falling into the nucleus (possibly as the result of the interaction with the companion galaxy). However, in that scenario it is difficult to explain the high velocity dispersion of the gas.
It is interesting to note that on the opposite side of the nucleus (region E) neither the H nor the [OIII] kinematic maps show any remarkable features. The ionization state, however, is similar to region D. The H dispersion map does show a large perturbation in region F. Perhaps this is the signature of the counter jet although it could also be due to interaction with the companion galaxy.
The total [OIII] luminosity that we derive from the flux distribution shown in panel (g) is erg s-1 (ignoring the contribution from region C, which is due to star formation). This is equivalent to the H luminosity of the ENLR, erg s-1. Note that this will include the contribution from the gas disk, which cannot be properly separated from the highly ionized extra-planar gas. In comparison, the mechanical power of the jet itself can be estimated using an empirical conversion from radio luminosity (equation (1) of Best et al. 2007). The observed radio flux (table 1) implies erg s-1, roughly an order of magnitude more than the energy which is reradiated as emission lines. The X-ray luminosity (table 1) is larger than both and the emission line luminosities (H and [OIII]) as expected (e.g. Heckman et al. 2004).
If we assume that most of the mechanical energy of the jet is converted to kinetic energy in the extra-planar gas then we can compute an upper limit on the mass of ionized hydrogen in the ENLR. Over the lifetime of the jet, yr (e.g. Sanders 1984), the upper limit on the available energy in the ENLR is: erg s yr erg. The jet lifetime is also consistent with its small size of kpc, assuming a canonical jet velocity of . With the typical gas velocities observed in our data of km s-1, this kinetic energy would correspond to an upper limit on the mass in ionized hydrogen of .
In our interpretation, we associate the structure observed in region D with jet driven mass outflow. The fraction of the total kinetic energy needed to power this outflow is simply the fraction of mass in region D multiplied by the ratio of the bulk velocity ( km s-1) to km s-1 squared. Under the assumption of constant gas density, the fraction of mass can be estimated as the fraction of [OIII] luminosity in region D, . Therefore the fraction of ENLR kinetic energy in this bulk outflow is erg. That is, only about 2 percent of the mechanical energy is required to power the outflow.
The derived energies are order of magnitude estimates only but are all internally consistent. The low mass loading and velocity associated with the outflow makes it unlikely that this process has a profound impact on the cold gas content of this galaxy. However, the implied mechanical energy of the jet is 50 times greater — on this basis only a small fraction of the jet energy is used to power the outflow. A much larger fraction is available to heat the gas which we observe as the highly ionized, large ENLR in this galaxy. It is notable that the jet energy is comparable to the cooling luminosity of a 1 keV () halo. This is an important point — in this galaxy feedback from the AGN seems to have little direct effect on the galaxy: any influence it can have occurs through the heating of gas in the galaxy’s halo. This scenario is very much consistent with current galaxy formation models (eg., Croton et al. 2006, Bower et al. 2006, 2008). Compared with powerful QSOs (e.g. Nesvadba et al. 2007) and radio galaxies (eg., Best et al. 2007) the jet energy is small. Nevertheless, it is the impact of AGN feedback in – haloes that is responsible for shaping the galaxy luminosity function.
The jet of this low mass AGN imparts more of its kinetic energy into the cold gas by means of kinetic heating than by directed outflow. IFU observations of galaxies hosting radio AGN, such as presented in this letter, provide key insight into the coupling between the jet and the gas.
Acknowledgments
We thank the referee, Montserrat Villar-Martin, for the constructive comments and suggestions. We also like to thank Chris Done, Isabelle Gavignaud, Martin Krause and Marc Schartmann for helpful discussions.
References
- Allen et al. (2006) Allen, S. W., R. J. H Dunn, Fabian, A. C., Taylor, G. B., & Reynolds, C. S. 2006, MNRAS, 372, 21
- Anderson (2003) Anderson, S. F., Voges, W., Morgan, B., Trümper, J., Agüeros, M. A., Boller, T., Collinge, M. J. et al. 2003, AJ, 126, 2209
- Baldwin (1981) Baldwin, J. A., Phillips, M. M., Terlevich, R. 1981, PASP, 93, 5
- Bennert (2006) Bennert, N., Jungwiert, B., Komossa, S., Haas, M., & Chini, R. 2006, A&A, 456, 953
- Best (2007) Best, P. N., von der Linden, A., Kauffmann, G., Heckman, T. M., & Kaiser, C. R. 2007, MNRAS, 379, 894
- Bower (2006) Bower, R. G., Benson, A. J., Malbon, R., Helly, J. C., Frenk, C. S., Baugh, C. M., Cole, S. & Lacey, C. G. 2006, MNRAS, 370, 645
- Bower et al. (2008) Bower, R. G., McCarthy I. G., Benson A. 2008, MNRAS, submitted
- Brinchmann (2004) Brinchmann, J., Charlot, S., White, S. D. M., Tremonti, C., Kauffmann, G., Heckman, T. & Brinkmann, J. 2004, MNRAS, 351, 1151
- Cappellari (2004) Cappellari, M. & Emsellem, E. 2004, PASP 116, 138
- Cattaneo (2005) Cattaneo, A., Combes, F., Colombi, S., Bertin, E. & Melchior, A.-L. 2005, MNRAS, 359, 1237
- Croton et al. (2006) Croton, D. J., et al. 2006, MNRAS, 365, 11
- Di Matteo (2005) Di Matteo, T., Springel, V. & Hernquist, L. 2005, Nat, 433, 604
- Falcke (1998) Falcke, H., Wilson, A. S. & Simpson, C. 1998, ApJ, 502, 199
- Fraquelli (2000) Fraquelli, H. A., Storchi-Bergmann, T. & Binette, L. 2000, ApJ, 532, 867
- Heckman (2004) Heckman, T. M.. Kauffmann, G., Brinchmann, J., Charlot, S., Tremonti, C., & White, S. D. M. 2004, ApJ, 613, 109
- Holt (2008) Holt, J., Tadhunter, C. N. & Morganti, R. 2008 arXiv:0802.1444v1
- Kuo (2008) Kuo, C-Y., Lim, J., Tang, Y-W., & Ho, P. T. P. 2008 (arXiv:0802.4205v1)
- Lawrence (2007) Lawrence, A. et al. 2007, MNRAS, 379, 1599
- Letawe (2008) Letawe, Y., Magain, G., Letawe, G., Corbin, F. & Hutsemekers, D. 2008 arXiv:0802.1386v1
- Nesvadba (2007) Nesvadba, N. P. H., Lehnert, M. D., De Breuck, C., Gilbert, A. & van Breugel, W. 2007, A&A, 475, 145
- Sanders (1984) Sanders, R. H. 1984, A&A, 140, 52
- Sanchez (2005) Sánchez, S. F., Becker, T., Garcia-Lorenzo, B., Benn, C. R., Christensen, L., Kelz, A., Jahnke, K. & Roth, M. M. 2005, A&A, 429L, 21
- Springel (2005) Springel, V., Di Matteo, T., & Hernquist, L. 2005, MNRAS, 361, 776
- Storchi-Bergmann (1992) Storchi-Bergmann, T., Wilson, A. S. & Baldwin, Jack A. 1992, ApJ, 396, 45
- Unger (1987) Unger, S. W., Pedlar, A., Axon, D. J., Whittle, M., Meurs, E. J. A. & Ward, M. J. 1987 MNRAS, 228, 671
- villar (1999) Villar-Martín, M., Tadhunter, C., Morganti, R., Axon, D. & Koekemoer, A. 1999, MNRAS, 307, 24
- York (2000) York, D. G. et al. 2000, AJ, 120, 1579