Probing The Lower Mass Limit for Supernova Progenitors and the High-Mass End of the Initial-Final Mass Relation from White Dwarfs in the Open Cluster M35 (NGC 2168)11affiliation: Some of the data presented herein were obtained at the W.M. Keck Observatory, which is operated as a scientific partnership among the California Institute of Technology, the University of California and the National Aeronautics and Space Administration. The Observatory was made possible by the generous financial support of the W.M. Keck Foundation.
Abstract
We present a photometric and spectroscopic study of the white dwarf population of the populous, intermediate-age open cluster M35 (NGC 2168); this study expands upon our previous study of the white dwarfs in this cluster. We spectroscopically confirm 14 white dwarfs in the field of the cluster: 12 DAs, 1 hot DQ, and 1 DB star. For each DA, we determine the white dwarf mass and cooling age, from which we derive the each star’s progenitor mass. These data are then added to the empirical initial-final mass relation (IFMR), where the M35 WDs contribute significantly to the high-mass end of the relation. The resulting points are consistent with previously-published linear fits to the IFMR, modulo moderate systematics introduced by the uncertainty in the star cluster age. Based on this cluster alone, the observational lower limit on the maximum mass of white dwarf progenitors is found to be at the 95% confidence level; including data from other young open clusters raises this limit as high as , depending on the cluster membership of three massive WDs and the core-composition of the most massive WDs. We find that the apparent distance modulus and extinction derived solely from the cluster white dwarfs ( and , respectively) is fully consistent with that derived from main-sequence fitting techniques. Four M35 WDs may be massive enough to have oxygen-neon cores; the assumed core composition does not significantly affect the empirical IFMR. Finally, the two non-DA WDs in M35 are photometrically consistent with cluster membership; further analysis is required to determine their memberships.
Subject headings:
white dwarfs — open clusters and associations: individual (M35) — stars: evolution — supernovae: general1. Introduction
Intermediate-mass stars () end their evolution in one of two ways, either exploding as a core-collapse supernova or losing large amounts of material to form a massive white dwarf (WD) star. Recent models of massive asymptotic giant branch (AGB) stars suggest that, for stars with initial (i.e., zero-age main sequence) masses , the endpoint of stellar evolution will be a carbon-oxygen (C/O) WD. For stars with initial masses , carbon will burn in a “super-AGB” star, forming a degenerate oxygen-neon (ONe) core which could become an ONe WD (e.g., Garcia-Berro et al., 1997; Poelarends et al., 2006, 2008). More massive super-AGB stars may explode as electron capture supernovae, and stars with masses explode as canonical core-collapse supernovae.
The initial mass dividing supernova progenitors from white dwarf progenitors, , (also known as and referred to as in our earlier work) is therefore likely to lie in this mass range (); indeed, current super-AGB models predict , depending on metallicity and the degree of overshooting (Siess, 2007). However, observational constraints on have been slow in coming. The best published observations give (Koester & Reimers, 1996).
Tight constraints on are important; for a burst of star formation with a Salpeter initial mass function (IMF; Salpeter, 1955), the number of stars in the mass range of is equal to the number of stars with . This factor of two uncertainty in the number of supernovae in a starburst region has important implications for quantifying supernova feedback on the interstellar medium (e.g., McKee & Ostriker, 1977), and for understanding supernova-driven winds in galaxies (e.g., Dekel & Silk, 1986; Martin, 2005).
Observations of WDs provide a lower limit on the value of . In the simplest form, this limit can be determined by identifying WDs in progressively younger star clusters until no WDs are found, indicating that the turnoff-mass stars are going supernova instead of forming WD remnants. Variations on this method were used by Romanishin & Angel (1980) and Anthony-Twarog (1982), who independently determined . This method is improved upon by using spectroscopic analysis of the WDs in each cluster to determine each WD’s progenitor mass. The most massive WD progenitor is then a lower limit on . Such analysis was performed by Koester & Reimers (1996) in the open cluster NGC 2516, where they found . In our initial study of WDs in M35, we determined (Williams et al., 2004).
The relationship of a WD’s mass to that of its progenitor, the initial-final mass relation (IFMR), is also a matter of keen interest. This relationship quantifies the integrated mass lost by a star over its entire evolution, and is therefore a necessary part of understanding chemical enrichment and star formation efficiency in galaxies (e.g., Ferrario et al., 2005). The IFMR represents one of the best observational constraints on AGB star mass loss. These stars are thought to be the primary sites of -process production and to play crucial roles in the abundance ratios of helium, carbon, and nitrogen (e.g., Busso et al., 1999; Marigo, 2001; Herwig, 2005, and references therein).
Due in large part to the steepness of the IMF, the IFMR has relatively few points in the high initial mass () region. Four massive WDs are known from the open cluster NGC 2516 (Koester & Reimers, 1996). The Pleiades provides one to three points, depending on whether the massive WDs GD 50 and PG 0136+251 were once cluster members (Dobbie et al., 2006b). Age-dating of Sirius A has allowed the progenitor mass of Sirius B to be calculated (Liebert et al., 2005b). A new paper by Dobbie2008 identifies three massive WD progenitors in NGC 3532 and two in NGC 2287. Finally, the older open cluster NGC 2099 has one high-mass WD, albeit with very large error bars on both the initial and final mass (Kalirai et al., 2005b).
It is suspected that the IFMR should have some metallicity dependence (e.g., Marigo & Girardi, 2007), with more metal-rich systems producing lower mass WDs. Indeed, the WDs in the super-metal-rich cluster NGC 6791 have surprisingly low masses (Kalirai et al., 2007), though the invoked enhanced mass loss due to the high metallicity results in stars circumventing the AGB phase altogether. Comparison of the WD masses in the open star clusters NGC 2099, the Hyades, and Praesepe may show some evidence of metallicity dependence (Kalirai et al., 2005b), though this claim hinges on a yet-unpublished significantly sub-solar metallicity measurement for NGC 2099. Published spectroscopic metallicity measurements for this cluster (Marshall et al., 2005; Hartman et al., 2008) claim a solar metallicity or slightly super-solar metallicity for NGC 2099; the younger cluster age resulting from a higher metallicity would erase most of the claimed signal. In short, the metallicity dependence of the IFMR, while expected, has yet to be observed conclusively.
Addressing the questions of , the shape of the high-mass end of the IFMR, and any metallicity dependence via observations thus requires WD observations in multiple star clusters that are young (ages Myr), relatively rich, and of markedly different metallicities.
1.1. The Open Cluster M35
The open cluster NGC 2168 (M35) is an ideal laboratory for addressing these issues. The cluster has an age of Myr (Sung & Bessell, 1999; von Hippel, 2005) and a significantly sub-solar metallicity [Fe/H] (Barrado y Navascués et al., 2001a); newer spectroscopic abundance measurements from the WIYN Open Cluster Study confirm the sub-solar metallicity ([Fe/H]; A. Steinhauer, private communication). For the rest of this paper, we adopt [Fe/H]. The cluster main-sequence turnoff mass for the cluster is based on the most recent Padova stellar evolutionary models (Marigo & Girardi, 2007; Marigo et al., 2008). All cluster WDs therefore are the remnants of some of the most massive stars that form WDs.
Several determinations of the cluster distance modulus and extinction exist in the literature. For the sake of comparison, we have adjusted these published values to our assumed metallicity using the relation of Pinsonneault et al. (1998). Resulting apparent distance moduli include 10.3 (Twarog et al., 1997), (Sung & Bessell, 1999), (Kalirai & Tosi, 2004), and (Sarajedini et al., 2004). Published values of the reddening span color excess values of (Twarog et al., 1997) to (Sung & Bessell, 1999). For this paper, we adopt and as representative of the magnitude of and scatter in these values.
The first search for WDs in M35 was undertaken by Romanishin & Angel (1980), who used photographic images of the cluster to identify four WD candidates. Reimers & Koester (1988) obtained spectra of three of these stars, confirming that all three are WDs and establishing two as likely members. In recent years, deep CCD imaging studies of von Hippel et al. (2002) and Kalirai et al. (2003) identified several faint, blue stars likely to be WDs, but these studies lack the spectroscopic observations necessary to determine the WD masses and cooling ages.
Therefore, we began our own imaging and spectroscopic study of the WD population of M35. In Williams et al. (2004), we presented initial data on eight DA (hydrogen-atmosphere) WDs in the field of NGC 2168, seven of which were claimed to be cluster members. In this paper, we present data for an additional six WDs, four of which are DAs, as well as significant additional data on three of the previously-published DAs. All of the older data have been completely re-reduced to correct some errors in the initial reduction, to incorporate improvements to the atmospheric fitting routines, and to use the newest WD and stellar evolutionary models. The fits in this paper therefore supersede those published in Williams et al. (2004).
2. Cluster Photometry
2.1. Observations
Initial imaging of M35 was obtained on 2001 September 22 UT using the Prime Focus Camera (PFCam) on the Lick Observatory 3m Shane telescope. Weather was photometric, and seeing was moderate and steady at . The imaging covered two fields, one centered northeast of the cluster center, and the other southwest of the cluster center. As data from earlier in the night showed evidence for a nonlinear CCD response (see Williams & Bolte, 2007), these photometric data are not presented in this paper. However, they were of sufficient quality to identify blue-excess objects as WD candidates for initial spectroscopy.
Additional imaging of the cluster was obtained on 2004 January 23 UT with the Mosaic-1 camera on the Kitt Peak Mayall 4m telescope. Weather was photometric and seeing was excellent: in , in , and in . The Mosaic camera, which has a field-of-view of , was centered on the cluster core. In each filter, three long exposures were obtained for a total of 2700s in and 360s in and . Between each exposure, a dither of north and east was executed. Single shorter exposures of 30s and 5s were also obtained in each filter.
2.2. Photometric reduction
The Mosaic data were reduced using the MSCRED package of
IRAF.111IRAF is distributed by the National Optical Astronomy
Observatory, which is operated by the Association of Universities for
Research in Astronomy, Inc., under cooperative agreement with the
National Science Foundation. We closely followed the prescription
formulated for the NOAO Deep Wide-Field Survey (NDWFS) described in
online notes by Jannuzi et al. (2003).222Available at
http://www.noao.edu/noao/noaodeep/ReductionOpt/frames.html. In
short, we subtracted overscans and trimmed each image, and we combined
and subtracted bias frames to remove any residual bias structure. We
also combined and applied dome flat fields in each filter to the
science images. We refined the image world coordinate systems using
coordinates from the Guide Star Catalog 2 and projected the images
onto the tangent plane, thereby resampling each pixel and correcting
for the variable pixel scale. At this point in reduction we deviated
from the NDWFS reduction techniques. In order to obtain the most
accurate photometry and to account correctly for chip-to-chip variations
in color terms (Slesnick et al., 2002), we divided each resampled
image into individual subimages for each chip; each
subimage was analyzed independently.
Object detection and photometric measurements were performed using the DAOPHOT II suite of analysis programs (Stetson, 1987) and a detection threshold of . Approximately 50 bright, isolated stars were used in each subimage to define a point-spread function (PSF); photometry for each star was determined via PSF-fitting. Curve-of-growth analysis of the PSF stars determined the aperture corrections used to convert PSF magnitudes to total instrumental magnitudes.
The photometric catalogs from each band were then matched to create a final photometric catalog. Stars were required to have been detected on at least one frame in each of the three bandpasses in order to make the final catalog. Due to high background extinction, star-galaxy separation was deemed unnecessary.
2.3. Calibration
Calibrations for the MOSAIC data were determined via imaging of
standard star fields from Landolt (1992). The following
transformation equations were used for calibration of the data:
where are the total instrumental magnitudes, are the standard system magnitudes, is the exposure time, and is the airmass. Examination of the standard star observation residuals revealed the necessity of the quadratic term in the -band transformation. The number of observed standard stars with extreme colors was fairly small, rendering the value of the quadratic coefficient uncertain. However, the agreement of the WD -band photometry with theoretical values gives us confidence that this value is roughly correct; solving the transformation equation without the quadratic term leads to observed WD colors in conflict with the evolutionary models. Values for the transformation coefficients are given in Table 1.
| Filter | Zero Point | Color Term | Airmass Term | Quadratic Term |
|---|---|---|---|---|
As the number of observed standard stars was insufficient to determine individual color terms for each CCD in the Mosaic camera, a single, mean value was determined. For purposes of comparison, a second calibration was performed adopting published color terms for each individual CCD (Massey & Slesnick, 1999); the resulting photometry for individual stars in and averaged 0.01 mag fainter with a dispersion of 0.01 mag. As Massey & Slesnick (1999) did not use a quadratic term in the -band transformation, direct comparison of -band terms is not possible, but Massey & Slesnick (1999) note the chip-to-chip color-term variation introduces a scatter of mag over a 1 mag range in U B.
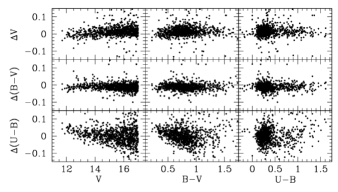
As a further sanity check, we compare our photometry with previous CCD photometry of M35 from Sung & Bessell (1999), shown in Figure 1. We find no systematic offsets in the or photometry at mag levels. However, a significant systematic trend is observable in : for the bluest objects, we obtain magnitudes systematically brighter by mag. It is unclear if this systematic is intrinsic to our data, perhaps indicative that the color terms in Eq. 2.3 are a poor approximation to the true color response (see discussions of U B photometry in Bessell, 1995), if the systematic is intrinsic to the Sung & Bessell (1999) data, or both.
2.4. Checking the Cluster Distance, Reddening and Metallicity
The and color-magnitude diagrams (CMDs) of the stars in the field of M35 are shown in Figure 2. Overplotted is the Padova isochrone for a ( for the traditional solar abundances of Anders & Grevesse, 1989), 200-Myr-old stellar population shifted to the adopted cluster distance and reddening (see §1.1). The isochrone is found to be an excellent representation of the main sequence for () in the B V CMD.
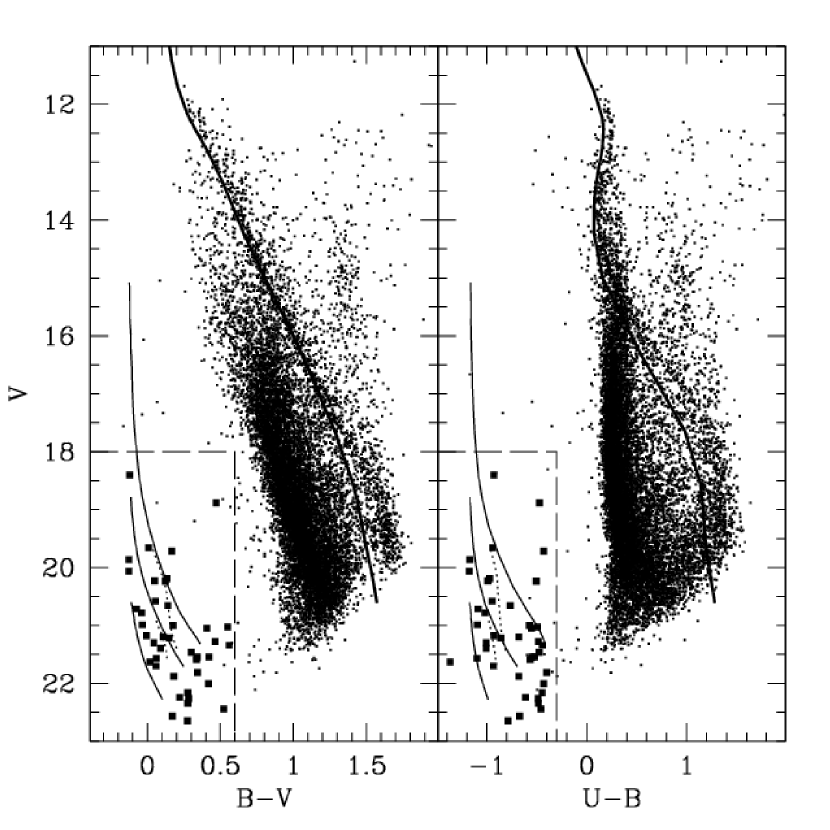
The same , 200-Myr isochrone is too blue in the U B CMD; agreement for () can be reached by increasing the reddening to . Such a change in reddening throws off the observed agreement in the B V CMD. This suggests either a non-standard reddening law in the direction of M35, a significant error in our -band zeropoint (in a direction which would worsen the systematic offset mentioned in the previous section), or a problem with the isochrone -band calculations. Additional data and analysis are needed to explore this discrepancy further.
A comparison of our data with and Padova isochrones finds that the observed main sequence agrees with the isochrone if the distance modulus of the cluster is shifted 0.15 mag closer or further, respectively. As with the isochrone, the U B CMD requires a higher assumed reddening value to bring the isochrone and main sequence into agreement.
The observed main sequence is also in excellent agreement with the empirical zero-age main sequence of Mermilliod (1981), shifted to the adopted cluster distance and reddening, and with the fiducial M35 main sequence of von Hippel et al. (2002).
We therefore conclude that our photometry is consistent with the literature-based distance, reddening, and metallicity we adopted in §1.1. We emphasize that, as our photometric data saturate well below the main sequence turnoff, our main sequence data are not useful for age determination.
2.5. Candidate WD Selection
The CMDs spanning the entire magnitude range of our photometry are shown in Figure 2 along with cooling curves for hydrogen-atmosphere (DA) and helium-atmosphere (DB) WDs for a range of WD masses, all shifted to the adopted cluster distance modulus and reddening. Several faint, blue objects are seen in the region of the CMD that should be populated by cluster WDs. The color-color plot (Figure 3) more clearly shows those objects with colors consistent with WD cooling models.
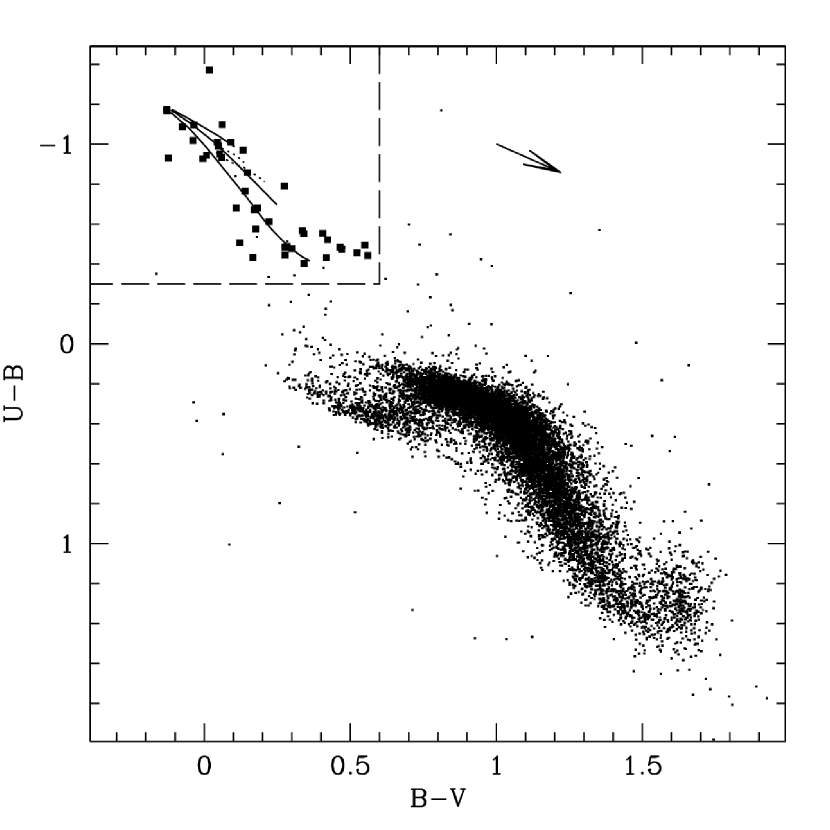
Candidate WDs are selected using the criteria , , and . These criteria would include all WDs at the cluster distance and reddening except for the hottest low-mass (K) WDs. These criteria are indicated in Figures 2 and 3; candidate WDs selected via these criteria indicated as larger solid points in the CMDs and color-color plot. Coordinates, photometry, and cross-identifications for each candidate WD are given in Table 2.
| Object | RA | Dec | Cross-Identification | ||||||
|---|---|---|---|---|---|---|---|---|---|
| LAWDS 1 | 6:08:38.79 | 24:15:06.9 | 20.989 | 0.019 | 0.028 | 0.028 | NGC 2168-1 in Romanishin & Angel (1980) | ||
| LAWDS 2 | 6:08:42.30 | 24:10:17.7 | 21.569 | 0.032 | 0.061 | 0.044 | 0.042 | ||
| LAWDS 3 | 6:09:04.78 | 24:21:39.2 | 20.581 | 0.020 | 0.053 | 0.028 | 0.028 | ||
| LAWDS 4 | 6:09:05.76 | 24:12:11.8 | 21.216 | 0.021 | 0.148 | 0.030 | 0.030 | NGC 2168-2 in Romanishin & Angel (1980) | |
| LAWDS 5 | 6:09:11.54 | 24:27:20.9 | 20.065 | 0.017 | 0.024 | 0.025 | NGC 2168-3 in Romanishin & Angel (1980) | ||
| LAWDS 6 | 6:09:23.48 | 24:27:22.0 | 19.863 | 0.016 | 0.023 | 0.024 | NGC 2168-4 in Romanishin & Angel (1980) | ||
| LAWDS 10 | 6:09:43.63 | 24:19:15.8 | 20.238 | 0.020 | 0.122 | 0.030 | 0.032 | ||
| LAWDS 11 | 6:09:42.79 | 24:11:05.4 | 21.198 | 0.025 | 0.110 | 0.037 | 0.038 | ||
| LAWDS 12 | 6:09:31.19 | 24:19:06.2 | 21.303 | 0.026 | 0.045 | 0.038 | 0.038 | ||
| LAWDS 13 | 6:09:29.71 | 24:15:58.6 | 21.542 | 0.024 | 0.341 | 0.037 | 0.038 | ||
| LAWDS 14 | 6:09:15.10 | 24:33:15.4 | 21.701 | 0.027 | 0.059 | 0.038 | 0.036 | ||
| LAWDS 15 | 6:09:11.63 | 24:02:38.5 | 20.785 | 0.022 | 0.032 | 0.033 | |||
| LAWDS 18 | 6:08:35.44 | 24:34:19.5 | 22.566 | 0.043 | 0.172 | 0.071 | 0.069 | ||
| LAWDS 22 | 6:08:24.65 | 24:33:47.6 | 19.657 | 0.016 | 0.008 | 0.023 | 0.025 | ||
| LAWDS 27 | 6:09:06.26 | 24:19:25.3 | 21.398 | 0.026 | 0.090 | 0.039 | 0.039 | Discovered by von Hippel et al. (2002) | |
| LAWDS 28 | 6:08:13.50 | 24:20:32.5 | 21.631 | 0.029 | 0.018 | 0.042 | 0.040 | ||
| LAWDS 29 | 6:08:02.20 | 24:25:24.2 | 20.719 | 0.019 | 0.027 | 0.027 | |||
| LAWDS 30 | 6:07:56.63 | 24:13:27.2 | 21.175 | 0.020 | 0.029 | 0.030 | |||
| LAWDS 31 | 6:10:08.48 | 24:22:32.3 | 20.231 | 0.020 | 0.048 | 0.031 | 0.033 | ||
| LAWDS 32 | 6:09:37.35 | 24:31:52.5 | 22.000 | 0.030 | 0.418 | 0.047 | 0.062 | ||
| LAWDS 33 | 6:09:33.02 | 24:15:23.5 | 22.259 | 0.033 | 0.284 | 0.051 | 0.060 | ||
| LAWDS 34 | 6:09:25.26 | 24:14:05.2 | 21.026 | 0.022 | 0.550 | 0.033 | 0.035 | ||
| LAWDS 35 | 6:09:12.92 | 24:22:17.4 | 21.809 | 0.027 | 0.342 | 0.040 | 0.042 | ||
| LAWDS 36 | 6:09:04.59 | 24:06:45.7 | 21.276 | 0.021 | 0.465 | 0.033 | 0.036 | ||
| LAWDS 37 | 6:08:59.02 | 24:08:40.8 | 21.049 | 0.020 | 0.406 | 0.030 | 0.033 | ||
| LAWDS 38 | 6:09:08.26 | 24:36:24.2 | 22.158 | 0.034 | 0.277 | 0.051 | 0.056 | ||
| LAWDS 39 | 6:09:01.46 | 24:26:50.3 | 22.648 | 0.052 | 0.275 | 0.081 | 0.086 | ||
| LAWDS 40 | 6:08:54.53 | 24:35:58.5 | 22.244 | 0.043 | 0.222 | 0.061 | 0.070 | ||
| LAWDS 41 | 6:08:34.97 | 24:32:47.3 | 18.886 | 0.015 | 0.471 | 0.022 | 0.024 | ||
| LAWDS 42 | 6:08:24.11 | 24:22:34.7 | 22.338 | 0.042 | 0.277 | 0.069 | 0.076 | ||
| LAWDS 43 | 6:08:20.96 | 24:08:51.4 | 22.440 | 0.037 | 0.523 | 0.065 | 0.086 | ||
| LAWDS 44 | 6:08:03.84 | 24:27:37.2 | 19.718 | 0.017 | 0.167 | 0.025 | 0.027 | ||
| LAWDS 45 | 6:08:03.77 | 24:27:38.3 | 18.403 | 0.015 | 0.021 | 0.022 | |||
| LAWDS 46 | 6:08:00.63 | 24:07:40.2 | 20.998 | 0.019 | 0.176 | 0.029 | 0.030 | ||
| LAWDS 47 | 6:08:00.37 | 24:18:02.1 | 21.540 | 0.023 | 0.422 | 0.036 | 0.038 | ||
| LAWDS 48 | 6:07:58.70 | 24:28:40.1 | 21.590 | 0.030 | 0.336 | 0.047 | 0.048 | ||
| LAWDS 49 | 6:07:52.95 | 24:25:23.5 | 20.191 | 0.017 | 0.133 | 0.025 | 0.026 | ||
| LAWDS 50 | 6:07:47.77 | 24:28:52.0 | 21.465 | 0.030 | 0.300 | 0.044 | 0.046 | ||
| LAWDS 51 | 6:07:47.39 | 24:34:15.3 | 21.877 | 0.031 | 0.182 | 0.044 | 0.041 | ||
| LAWDS 52 | 6:07:47.37 | 24:35:23.5 | 20.653 | 0.018 | 0.140 | 0.027 | 0.028 | ||
| LAWDS 53 | 6:07:33.79 | 24:07:55.5 | 21.341 | 0.028 | 0.560 | 0.046 | 0.050 | V57 in Mochejska et al. (2004) |
Note. — Units of right ascension are hours, minutes and seconds, and units of declination are degrees, arcminutes, and arcseconds. Coordinates are for Equinox J2000.0. The official (i.e., IAU-approved) format for each object name is NGC 2168:LAWDS NN.
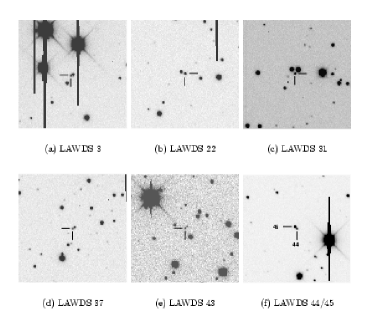
While most of the WD candidates are fairly isolated, some have close optical companions. In order to clarify identification for these WD candidates, finder charts for objects with close companions are provided in Figure 4.
3. WD Spectroscopy
3.1. Observations and Data Reduction
Spectra of several WD candidates were obtained between 2002 December and 2005 November with the blue camera of the LRIS spectrograph on Keck I (Oke et al., 1995; McCarthy et al., 1998). We selected the 400 grooves mm-1, 3400Å blaze grism for the highest available throughput for the vital higher-order Balmer lines. The D560 dichroic was used to obtain simultaneous observations of the H line (not presented here). Our aperture was a 1″ longslit at parallactic angle. The resulting spectral resolution (FWHM) is Å.
We reduced the spectra using the onedspec package in IRAF. Overscan regions were used to subtract the amplifier bias. Flat fielding was complicated by the discovery of a sharp inflection point in the response at Å and two low-level () emission lines in the illuminated dome flat field spectra between 3950Å and 3975Å; both of these features introduced ringing into the flat field. The ringing due to the inflection point was eliminated by creating a piecewise-smooth response function for image sections below and above the inflection point. As internal flat fields lacked the emission features, only internal flats were used to create the final flat fields.
Cosmic rays were removed from the two-dimensional spectrum using the “L.A. Cosmic” Laplacian cosmic-ray rejection routine (van Dokkum, 2001). We then averaged multiple exposures of individual objects weighted by their individual signal-to-noise ratios and extracted the one-dimensional spectrum. We applied a wavelength solution derived from Hg, Cd, and Zn arclamp spectra. We determined and applied a relative flux calibration from long-slit spectra of multiple spectrophotometric standard stars. We made no attempt at obtaining absolute spectrophotometry for any object.
| Object | UT Obs Date | Total exp. (s) | S/NaaAverage of signal-to-noise per resolution element at pseudocontinuum surrounding H (for DA WDs) or at 4200Å (non-DAs) | ID |
|---|---|---|---|---|
| LAWDS 1 | 2002 Dec 8 | 2700 | 64 | DA |
| LAWDS 2 | 2002 Dec 8 | 2700 | 109 | DA |
| 2004 Oct 11 | 3600 | |||
| LAWDS 4 | 2002 Dec 8 | 2700 | 32 | DB |
| 2004 Oct 11 | 900 | |||
| LAWDS 5 | 2002 Dec 8 | 2700 | 215 | DA |
| 2002 Dec 9 | 3600 | |||
| LAWDS 6 | 2002 Dec 8 | 2700 | 247 | DA |
| 2002 Dec 9 | 2700 | |||
| LAWDS 11 | 2004 Feb 12 | 3600 | 57 | DA |
| 2005 Nov 26 | 1800 | |||
| 2005 Nov 27 | 4800 | |||
| LAWDS 12 | 2005 Nov 26 | 4800 | 91 | DA |
| LAWDS 14 | 2005 Nov 26 | 6000 | 73 | DA |
| LAWDS 15 | 2004 Feb 12 | 3300 | 86 | DA |
| LAWDS 22 | 2004 Feb 12 | 3300 | 198 | DA(H?) |
| LAWDS 27 | 2002 Dec 9 | 3600 | 96 | DA |
| 2004 Feb 12 | 3600 | |||
| 2004 Oct 11 | 3300 | |||
| LAWDS 28 | 2004 Oct 12 | 1200 | 73 | DQ |
| 2005 Nov 26 | 4800 | |||
| LAWDS 29 | 2004 Oct 12 | 3600 | 75 | DA |
| LAWDS 30 | 2005 Nov 27 | 6000 | 41 | DA |
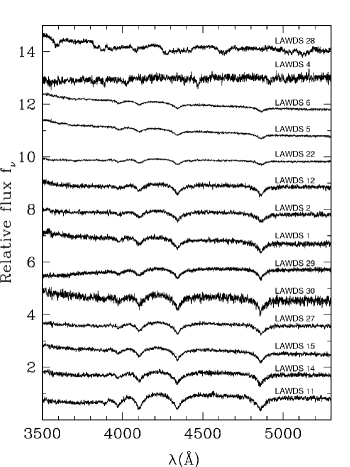
The observed candidates, their dates of observation, and the spectroscopic identification of each object are given in Table 3; all spectra are shown in Figure 5. NGC 2168:LAWDS 28 is the hot DQ WD discussed in Williams et al. (2006); NGC 2168:LAWDS 4 is spectral type DB and is discussed in §4.6.2. All twelve other WDs are of spectral type DA.

Figure 6 shows the WD regions of the CMDs and color-color plot of M35 indicating each object’s spectroscopic identification. In the B V vs. CMD, the cluster WDs form a very tight sequence about the 1 DA cooling model, with the exception of the likely magnetic DA LAWDS 22 (see next section). The redder color of LAWDS 22 could be due to an unresolved low-mass companion; the red side of LRIS was not functioning on the night this WD was observed, so we are unable to examine the spectra for evidence of such a companion. The hot DQ LAWDS 28 is significantly bluer in U B than all the other WDs. This exceptional color is due to high carbon opacity at wavelengths Å, which re-distributes the ultraviolet flux into the near-UV (Dufour et al., 2008).
3.2. WD parameter determination
and were determined for each DA WD via simultaneous fitting of the H to H9 Balmer line profiles (Bergeron et al., 1992). Model atmospheres used for this fitting are derived from Koester’s model grids; details of the input physics and methods can be found in Koester et al. (2001) and references therein. The algorithm for our fitting routine and error estimation are detailed in Williams & Bolte (2007), with the change that the model grid was expanded to include higher surface gravities (). Signal-to-noise was calculated by determining the root mean square scatter per 6Å resolution element about the fit pseudo-continuum on both sides of the H line.
Initial spectral fits proved unsatisfactory for the hottest white dwarfs (LAWDS 5, LAWDS 6, and LAWDS 22), with the observed spectrum deviating strongly from the best-fit models. The models severely underestimated the depth of the H line and overestimated those of lower-order Balmer lines. There are several potential sources for the poor H fits in these three WDs:
-
•
Magnetic fields — In the spectrum of LAWDS 22, the cores of the Balmer lines are significantly flattened. This is likely to be due to a magnetic field with a strength sufficient to broaden the line without producing obvious Zeeman splitting at our spectral resolution ( kG; Wickramasinghe & Ferrario, 2000); a rough comparison to a magnetic atmospheric models reveals good agreement for a magnetic field strength of MG (A. Kanaan, private communication). The Balmer line models we fit do not include magnetic fields, and so the parameters derived for this star are invalid. Weaker fields could also be present in LAWDS 5 and LAWDS 6, accounting for their poor fits. However, there is no compelling evidence for magnetism in these two stars.
-
•
Known high systematics — DA WDs with K show systematic differences in derived from different methods, though the proposed causes of these differences, including non-LTE effects, small quantities of helium, and metal opacities, remain a matter of debate (e.g., Bergeron et al., 1994; Napiwotzki, 1997; Barstow et al., 2003; Lajoie & Bergeron, 2007). The sense and magnitude of our deviations are similar to those calculated by Barstow et al. (1998) for a metal-rich, non-LTE atmosphere compared to a pure-H, LTE model.
-
•
Interstellar absorption — In our highest signal-to-noise spectra, we observe an additional absorption feature on the red wing of the H line that we identify as the 4430Å diffuse interstellar band (DIB; e.g., Herbig, 1966). Weak Ca II K absorption is also visible in the higher signal-to-noise WD spectra; due to the high of these WDs, this absorption must be interstellar. The H lines will therefore be contaminated by Ca II H absorption. In the hottest WDs, the depth of Ca II lines are of the H line. We have not attempted to model and subtract the Ca II H line, so this line will have some effect on the model atmosphere fits. However, as the Ca II H line is significantly narrower than the H line, and the deviations span the entire H line, contamination from Ca II H is therefore not the primary cause of the poor fits.
-
•
Shortcomings in the model atmospheres — The high-order Balmer lines are strongly affected by the dissolution of the higher atomic energy levels due to interactions with perturbing particles. This is described in the atmospheric models by the Hummer-Mihalas-Deppen occupation probability, which has free parameters that are difficult to quantify. The perturbation effect may be a bit too strong, leading to weaker higher-order lines in the models. To test this possibility, we have used our models and fitting routine to determine parameters of hot, high-gravity WDs in the Palomar Green WD sample (Liebert et al., 2005a), whose spectra were graciously provided by J. Liebert. These fits do not show the same problems with the fitting of H observed here; therefore, we conclude that shortcomings in the models are likely not responsible for our poor spectral fits.
-
•
Data reduction systematics — As mentioned in §3.1, the dome spectroscopic flat field lamps were observed to have weak emission features in this wavelength region, so only internal flat field lamps were used. If the internal lamps have similar spectral features, the H profiles could be affected. However, no such features were apparent in the internal flats, and the cooler DAs in this study do not show systematics in the H line, so we consider this explanation unlikely.
In short, we find no compelling explanation why the H lines in LAWDS 5 and LAWDS 6 are not well-represented by the atmospheric models; the failure in LAWDS 22 seems likely to be due to magnetic fields.
As a check against model atmosphere or data reduction systematics affecting all of our WDs, we re-fit each WD excluding the H line from the fits. In all cases, the values are identical within the internal fitting errors (described below). This is expected, as the majority of leverage in determination is from the lower Balmer lines. The values are systematically higher by an average of 0.1 dex when the H line is excluded. This change is because the higher-order Balmer lines are most sensitive to surface gravity, and the absence of the H8 and H9 lines due to the dissolution of these energy levels in these higher gravity atmospheres only sets a lower limit on the surface gravity.
| Object | Internal Errors | Total Errors | aaError due to total fitting error | bbAdditional systematic error due to cluster age uncertainty | |||||||||
|---|---|---|---|---|---|---|---|---|---|---|---|---|---|
| (K) | () | () | () | () | () | ||||||||
| LAWDS 1ccRe-reduction of data presented in Williams et al. (2004) | 33400 | 8.36 | 320 | 0.11 | 1150 | 0.16 | 0.873 | 0.091 | 7.228 | 0.260 | 4.39 | ||
| LAWDS 2 | 34100 | 8.62 | 310 | 0.04 | 1140 | 0.13 | 1.015 | 0.067 | 7.657 | 0.202 | 4.79 | ||
| LAWDS 5ccRe-reduction of data presented in Williams et al. (2004) | 53750ddFit excludes H | 8.39ddFit excludes H | 850 | 0.05 | 1390 | 0.13 | 0.916 | 0.075 | 6.103 | 0.088 | 4.21 | ||
| LAWDS 6ccRe-reduction of data presented in Williams et al. (2004) | 56000eeAdopted values intermediate to fits obtained by including and excluding H | 8.32eeAdopted values intermediate to fits obtained by including and excluding H | 1500 | 0.14 | 1860 | 0.18 | 0.877 | 0.096 | 6.077 | 0.082 | 4.21 | ||
| LAWDS 11 | 20800 | 8.28 | 520 | 0.08 | 1260 | 0.16 | 0.802 | 0.096 | 8.047 | 0.173 | 6.63 | ||
| LAWDS 12 | 34500ddFit excludes H | 8.44ddFit excludes H | 280 | 0.10 | 1140 | 0.16 | 0.922 | 0.092 | 7.314 | 0.281 | 4.43 | ||
| LAWDS 14 | 29200 | 8.62 | 220 | 0.07 | 1120 | 0.14 | 1.010 | 0.072 | 7.865 | 0.167 | 5.32 | ||
| LAWDS 15ccRe-reduction of data presented in Williams et al. (2004) | 29500 | 8.40 | 160 | 0.00 | 1110 | 0.15 | 0.888 | 0.088 | 7.551 | 0.236 | 4.63 | ||
| LAWDS 22ccRe-reduction of data presented in Williams et al. (2004) | 50000ddFit excludes H | 8.08ddFit excludes H | 1420 | 0.07 | 1800 | 0.12 | ffValues not calculated due to poor Balmer line fits | ffValues not calculated due to poor Balmer line fits | ffValues not calculated due to poor Balmer line fits | ffValues not calculated due to poor Balmer line fits | ffValues not calculated due to poor Balmer line fits | ffValues not calculated due to poor Balmer line fits | ffValues not calculated due to poor Balmer line fits |
| LAWDS 27 | 30200 | 8.64 | 100 | 0.04 | 1100 | 0.13 | 1.022 | 0.072 | 7.840 | 0.170 | 5.22 | ||
| LAWDS 29 | 32400 | 8.38 | 220 | 0.07 | 1120 | 0.14 | 0.882 | 0.078 | 7.331 | 0.235 | 4.44 | ||
| LAWDS 30 | 30400 | 8.62 | 390 | 0.18 | 1170 | 0.22 | 1.011 | 0.122 | 7.808 | 0.289 | 5.12 | ||
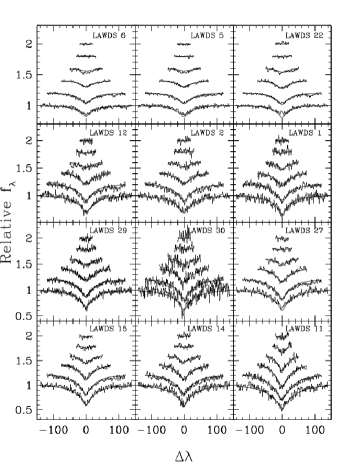
The best-fitting model atmospheres from each of the two fits were plotted over each WD’s observed spectrum, and the best qualitative fit was adopted for the remaining analysis; adopted values are given in Table 4. For most WDs, this adopted fit was the fit obtained using all Balmer lines. For LAWDS 5, LAWDS 12, and LAWDS 22, the adopted fit excluded H. For LAWDS 6, both fits were qualitatively similar, so an intermediate value (also qualitatively similar) was adopted, and the internal error bars were increased to include both fit values. The adopted-fit model Balmer lines are shown plotted over the observed spectra in Figure 7.
Masses () and cooling ages () for each white dwarf were computed from evolutionary models provided by P. Bergeron & G. Fontaine. These models assume “thick” hydrogen layers (). For K, the pure carbon cooling models of Wood (1995) are used; for K, the mixed C/O models of Fontaine et al. (2001) are used. The evolutionary models also provide synthetic photometry as described in Holberg & Bergeron (2006). As pure carbon models are generally disfavored at these masses, we also calculated and for K WDs using the C/O mixed models of Wood (1995); the resulting differences in and were within the stated error bars. The derived and for each WD are presented in Table 4. Due to the poor fits of LAWDS 5 and LAWDS 6, their derived masses are of questionable quality.
3.2.1 Error Determinations
We consider two primary sources of error in the and values determined for each WD:
Internal fitting errors — We refer to the random errors in our determination of and resulting from the signal-to-noise of our observations as “internal fitting errors,” or the distribution of spectral parameters we would expect given an ensemble of observations with the same signal-to-noise of the same WD using the same instrumental setup. We determine the magnitude of these errors via the Monte Carlo technique described in Williams & Bolte (2007). For LAWDS 5, LAWDS 12 and LAWDS 22, where the adopted atmospheric parameters used the fits excluding the H line, that line was also excluded in the Monte Carlo error determination, thereby providing a realistic estimate of the additional random error introduced by the exclusion.
External fitting errors — It has been noticed that the scatter in measured and derived by different groups for the same WDs is larger than the internal errors calculated by Balmer fitting routines (e.g., Napiwotzki et al., 1999; Williams & Bolte, 2007). Possible sources for these differences include the different instruments with which these stars were observed, the different spectral fitting routines, and the different model atmospheres used. In Williams & Bolte (2007), we determined that these external errors appear to be random with a scatter of K in and a scatter of dex in based on a comparison of our observations of field DA WD spectra to fits in the literature. In our past work (with the exception of Rubin et al., 2008), we have not propagated the external fitting errors through our analysis. In order to facilitate proper comparison of our open cluster WDs with those of other groups, we propagate these errors through the analysis in this paper.
We obtain the total fitting error in and for each WD by adding the internal, and external fitting errors in quadrature. This total error is then propagated through the analysis to obtain the stated errors in all subsequently derived parameters (, , and ). The internal and total fitting errors are both given in Table 4.
4. The WD population of M35
4.1. Cluster membership
In the absence of kinematic information, such as radial velocity or proper motion measurements, the best means of determining cluster membership of WDs is to apply age and distance criteria. Any current cluster member WDs must have shorter than the cluster age and, unless escaped from the cluster, must lie at the same distance. Both and for each WD are determined from the evolutionary models. For each WD, is shown (along with other derived mass quantities) in Table 4, and is given along with other derived photometric quantities in Table 5. We identify candidate cluster member WDs as those DAs with Myr and that have distance moduli consistent within of the cluster distance modulus. All of the WDs in this sample meet these criteria.
| Model Photometry | Derived Distance and Reddening | |||||||||||
|---|---|---|---|---|---|---|---|---|---|---|---|---|
| WD | E(B V) | |||||||||||
| 1 | 10.300 | 0.283 | -0.221 | 0.011 | -1.420 | 0.016 | 10.689 | 0.284 | 0.186 | 0.030 | 0.290 | 0.043 |
| 2 | 10.736 | 0.254 | -0.222 | 0.010 | -1.433 | 0.014 | 10.833 | 0.256 | 0.283 | 0.045 | 0.397 | 0.062 |
| 5 | 9.759 | 0.247 | -0.291 | 0.003 | -1.563 | 0.004 | 10.306 | 0.248 | 0.163 | 0.024 | 0.262 | 0.035 |
| 6 | 9.592 | 0.319 | -0.295 | 0.003 | -1.570 | 0.004 | 10.271 | 0.319 | 0.167 | 0.023 | 0.275 | 0.034 |
| 11 | 11.090 | 0.270 | -0.051 | 0.025 | -1.006 | 0.045 | 10.108 | 0.271 | 0.161 | 0.045 | 0.436 | 0.069 |
| 12 | 10.382 | 0.300 | -0.228 | 0.009 | -1.438 | 0.013 | 10.921 | 0.301 | 0.273 | 0.039 | 0.474 | 0.055 |
| 14 | 11.041 | 0.264 | -0.169 | 0.016 | -1.324 | 0.025 | 10.660 | 0.265 | 0.228 | 0.041 | 0.450 | 0.058 |
| 15 | 10.622 | 0.270 | -0.179 | 0.015 | -1.330 | 0.025 | 10.163 | 0.271 | 0.140 | 0.035 | 0.272 | 0.052 |
| 27 | 11.008 | 0.265 | -0.182 | 0.014 | -1.353 | 0.021 | 10.390 | 0.266 | 0.272 | 0.041 | 0.434 | 0.059 |
| 29 | 10.393 | 0.246 | -0.212 | 0.011 | -1.401 | 0.017 | 10.326 | 0.247 | 0.137 | 0.029 | 0.239 | 0.042 |
| 30 | 10.957 | 0.428 | -0.185 | 0.016 | -1.358 | 0.024 | 10.218 | 0.428 | 0.180 | 0.033 | 0.426 | 0.048 |
In Williams et al. (2004), we suggested that LAWDS 15 could also be an escaped cluster member. After the re-analysis presented in this paper, the WD distance modulus is consistent with the cluster distance modulus, so the speculation on its potential escape from the cluster was premature.
There are some factors that lead us to question the membership of DA LAWDS 11. Its cooling age is Myr older than the second-oldest WD, LAWDS 14, though this difference is within the stated errors. In addition, LAWDS 11 is the second-least massive WD in the cluster, despite having the highest progenitor mass. This goes against the preconceived notion that higher-mass stars produce higher-mass WDs. There are theoretical means to explain this low mass, such as binary evolution or enhanced mass loss during the post-main sequence evolution of the star.
It is also possible that LAWDS 11 is a field WD unrelated to the star cluster that lies within our selection volume. Using a calculation similar to that described in Rubin et al. (2008), we estimate field WDs meeting our cluster-member criteria should be in our imaged area. As of field WDs in a volume-limited sample are more massive than 0.8(Liebert et al., 2005a), it would not be improbable to find a massive field WD in our sample. Measurements of this star’s proper motion are needed to determine if it is indeed a member of the cluster; as LAWDS 11 meets all of our current membership criteria, we include it in our analysis below.
4.1.1 Sample Completeness
The fourteen WDs observed in this cluster may not be the complete WD population of M35. Our imaging is only of the central arcmin radius of the cluster; the tidal radius of M35 is arcmin (Leonard & Merritt, 1989). Therefore, it is fully possible that cluster WDs may be found outside our imaged area. However, almost all main-sequence proper motion members more massive than 1.2 are located within a 20 arcmin radius of the cluster center (McNamara & Sekiguchi, 1986; Barrado y Navascués et al., 2001b), and the progenitor stars of M35 WDs were significantly more massive than this, suggesting that few cluster member WDs may be outside of our images.
We may also be missing cluster WDs within our imaged area. Because precise WD parameter measurements rely on the higher-order Balmer lines and because an atmospheric dispersion corrector was not available when these observations were made, we decided to make longslit observations of individual WDs at parallactic angle rather than multi-slit observations at less favorable angles. Therefore, most of the WD candidates lack spectroscopic observations.
Many of the unobserved WD candidates lie along and above the 0.6 WD cooling curve; all of the observed DAs are more massive than this and, with the exception of LAWDS 22 (see §3.1), lie along more massive WD cooling curves. We cannot rule out that the unobserved candidates may be cluster WDs in double degenerate or WD+M binaries, or low-mass cluster WDs formed via some binary process. While interesting in their own right, any of these scenarios would warrant their exclusion from the initial-final mass relation and analyses below, which are assumed to be valid only for single-star evolution.
The other unobserved WD candidates, if cluster members, would have cooling ages Myr, the oldest likely age for the cluster. Therefore, they are almost certainly not white dwarfs related to the star cluster.
Most of the WD candidates lacking spectroscopic observations are likely field WDs. As mentioned in the previous section, we estimate that, on average, 3.2 field WDs meeting our cluster membership selection criteria should be found within our field of view. Our photometric selection criteria are much more generous, consistent with WDs as cool as K at the cluster distance and reddening; such WDs would be significantly older than the star cluster, and therefore not cluster members. Solely using our photometric selection criteria and integrating along the line of sight to the cluster, we estimate field WDs to be in our field of view. Given our 41 total WD candidates, 10 to 14 of which are cluster members, we expect that most or all of these unobserved WD candidates are field WDs.
In the B V vs. CMD (Fig. 6), a tight, nearly continuous sequence of member WDs is observed. There are no remaining WD candidates along the 1 cooling track younger than 200 Myr, suggesting that no older, massive WDs are present in the cluster. However, we cannot rule out that cooler WDs were formed and lost from the cluster due to dynamical processes. Photometric incompleteness is also a concern; artificial star tests (significantly complicated by proper treatment of the mosaicked CCDs) are being performed and will be presented in a future paper.
In short, spectroscopic observations of the unobserved WD candidates are needed to ascertain their true nature, but they are quite unlikely to impact the conclusions of this paper.
4.2. The initial-final mass relation
The progenitor star masses for cluster WDs can be determined by subtracting from the cluster age. The result represents the lifetime of the progenitor star from the zero-age main sequence through the planetary nebula stage. We then use the [Fe/H] evolutionary models of Marigo & Girardi (2007) to determine the mass of star with this lifetime. These model lifetimes only extend from the zero-age main sequence through the start of the thermally-pulsing AGB phase. The amount of time from the first thermal pulse through the thermally-pulsing AGB and planetary nebula phases to the start of the WD cooling track is negligible ( yr) compared with the total stellar lifetimes ( yr) and the errors on the cluster age ( yr).
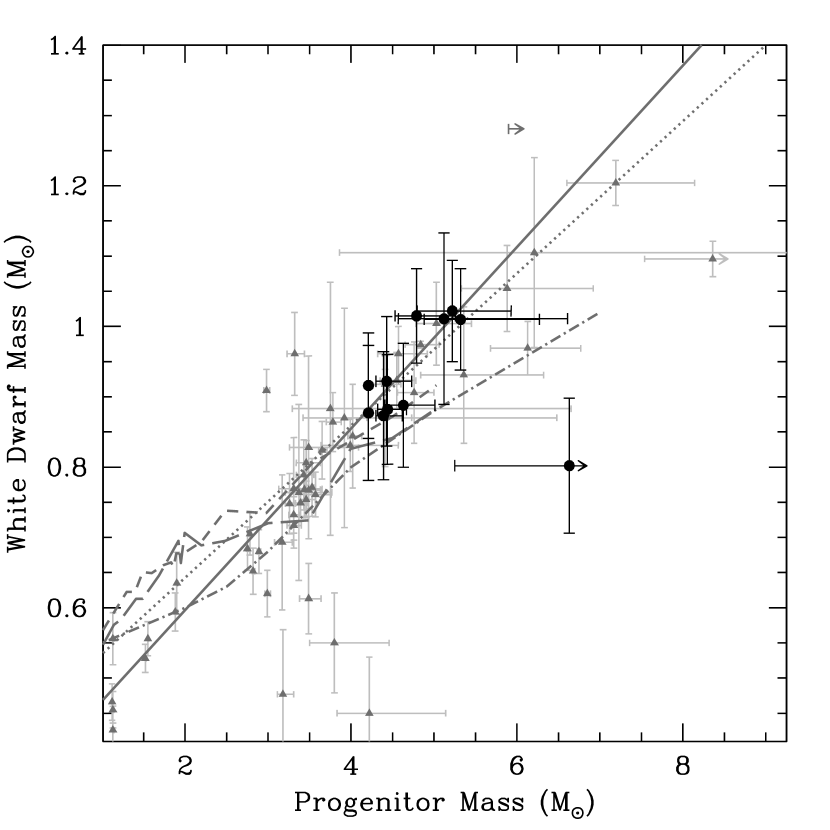
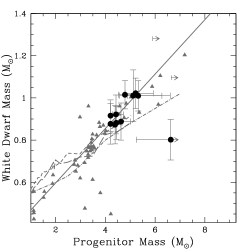
Table 4 gives the progenitor mass for each cluster WD. This table excludes parameters for LAWDS 22 due to its likely magnetic nature and resulting poor spectral fits. The table lists the observational errors in resulting from the propagation of the total fitting errors through the calculations. Also given are the systematic errors, the changes in due to the 25 Myr uncertainty in the cluster age. These systematic errors would be in the same sense for each cluster WD and so should not be added in to the random error (see §4.3). The given errors in are strongly asymmetric and represent the 68% confidence level. The initial-final mass relation is plotted in Figure 8. Error bars are the 68% confidence levels derived from the total fitting errors. Despite the uncertainty in the spectral fits for LAWDS 5 and LAWDS 6, their values and uncertainties are fairly robust; as their are very short, even an error in of 10000 K translates to an error in of only 0.02.
Also included in Figure 8 are cluster WDs from the literature. For consistency, we re-determined and from the published and using our adopted WD and stellar evolutionary models. These clusters, the adopted parameters from each cluster, and references for the parameters and WD observations are given in Table 4.2. Points from the literature with small error bars typically do not include the external fitting errors that we have considered in our data.
| Cluster | Age (Myr) | [Fe/H] | References |
|---|---|---|---|
| Pleiades | 1,2,3,4,5 | ||
| NGC 2516 | 6,7,8 | ||
| M34 | 9,10,11 | ||
| Sirius A/B | 12,13 | ||
| NGC 2287 | 14 | ||
| NGC 3532 | 6,14 | ||
| NGC 2099 | 14,15,16 | ||
| NGC 6633 | 17,18 | ||
| Hyades | 3,19,20 | ||
| Praesepe | 3,21,22 | ||
| NGC 7789 | 23 | ||
| NGC 6819 | 23 | ||
| NGC 6791 | 24,25 |
References. — (1) Mazzei & Pigatto 1989, (2) Stauffer et al. 1998, (3) Claver et al. 2001, (4) Ferrario et al. 2005, (5) Dobbie et al. 2006b, (6) Meynet et al. 1993, (7) Koester & Reimers 1996, (8) Sung et al. 2002, (9) Jones & Prosser 1996, (10) Schuler et al. 2003, (11) Rubin et al. 2008, (12) Liebert et al. 2005b, (13) Barstow et al. 2005, (14) Dobbie et al. 2008, (15) Marshall et al. 2005, (16) Hartman et al. 2008, (17) Jeffries et al. 2002, (18) Williams & Bolte 2007, (19) Boesgaard & Friel 1990, (20) Perryman et al. 1998, (21) Dobbie et al. 2004, (22) Dobbie et al. 2006a, (23) Kalirai et al. 2008, (24) Origlia et al. 2006, (25) Kalirai et al. 2007
As we are seeking the cleanest-possible IFMR indicative of the results of single-star evolution, a few WDs from the literature are excluded from our analysis. WD 0437+138 is of spectral type DBA; the cooling models we employ are appropriate only for DA WDs. WD 0837+199 is strongly magnetic, which could potentially indicate a more complicated evolutionary history (e.g., Tout et al., 2008). The two binary WD candidates from Williams & Bolte (2007), NGC 6633:LAWDS 4 and NGC 6633:LAWDS 7, either have uncertain parameters (if binaries, the observed spectra are a blend of the two components) or, if lone WDs, are not cluster members. Proper motion studies have identified the following WDs as field stars: WD 0837+218 (Casewell et al., 2008), NGC 1039:LAWDS 9, NGC 1039:LAWDS 20, NGC 1039:LAWDS S1, and NGC 7063:LAWDS 1 (Dobbie et al., 2008).
From the figure, we see that the M35 WDs fall along the existing empirical IFMR, with higher cluster WD masses are seen to correspond to higher progenitor star masses, as is generally expected from stellar evolution. In fact, the M35 WDs follow the linear relation of Ferrario et al. (2005), perhaps with a slightly steeper slope. Also included in the figure are the semi-empirical IFMR of Weidemann (2000) and a theoretical prediction for the IFMR from Marigo & Girardi (2007) for and stellar evolutionary models.
A recent paper by Salaris et al. (2008) highlights that the IFMR determined via our method is not completely self-consistent. The cluster age was adopted from literature using isochrone-fitting methods employing different stellar evolutionary models; the WD evolutionary models do not use the chemical profiles output by the same stellar models used to determine the cluster age; and the atmospheric models used to fit the spectra are not identical to those used in the WD evolutionary models. However, as pointed out by Salaris et al. (2008), the overwhelming source of systematic error in IFMR calculations is from the uncertainty in the cluster age (see §4.3.1). The systematic errors due to the self-inconsistency described above is therefore assumed to be negligible.
4.2.1 The shape of the IFMR
The empirical IFMR can be fit marginally well by a linear function. We determine the slope and zero-point of this line using least-squares fitting with error bars in two dimensions (e.g., Press et al., 1992). We include the 61 WDs in Figure 8 with masses ; lower masses, which may indicate He cores and a different evolutionary history, were omitted. LAWDS 11 was also omitted from the fit due to its uncertain membership; if it is a cluster member and is the result of binary evolution, this exclusion would also be justified. Using the published random error bars for each WD’s parameters, we obtain
| (4) |
this fit is plotted in Figure 8. The reduced value for this fit is 2.47. We note that, if LAWDS 5 and LAWDS 6 are also excluded from the fit due to their poor spectral fits, the linear fit is unchanged within the formal error bars.
Our linear fit is formally inconsistent with the slopes of the fits given in Ferrario et al. (2005), Kalirai et al. (2008) and Catalán et al. (2008); the M35 WDs at the high-mass end of the relation prefer a steeper slope. However, the goodness-of-fit statistic for all of these linear fits (including the new fits presented here) are very low. This could indicate that the error bars on the WD parameters are understated, that there is an additional scatter not due to measurement error (such as intrinsic scatter in the relation), and/or that a linear function is not an appropriate representation of the data (e.g., Press et al., 1992). In any of these cases, the formal error bars on the slope and zero point of the linear fit quoted above are likely understated. Qualitatively, all of these linear fits appear to be a decent approximation to the data.
We cannot exclude the possibility that the empirical IFMR may not be strictly linear; emergent hints of a non-linear IFMR have been discussed recently in the literature (e.g. Kalirai et al., 2008; Salaris et al., 2008; Catalán et al., 2008; Dobbie et al., 2008). The formal significance of these non-linear fits is limited by the larger error bars in massive WDs (driven by cluster age uncertainties and the steep change in the relationship between stellar mass and lifetimes at these younger ages) and the limited amount of data at the low end of the relation (e.g., Catalán et al., 2008; Salaris et al., 2008).
4.3. Systematic errors in the IFMR
4.3.1 The age uncertainty in M35
Although several systematic effects may affect the IFMR, by far the largest systematic in M35 is the uncertainty in the cluster age. Errors in the cluster age affect the IFMR in two distinct ways. First, an increase (decrease) in the assumed cluster age will result in all WDs from a given cluster having lower (higher) derived initial masses. Second, a change in the cluster age results in a larger shift for cluster WDs with higher progenitor masses, as the change in age represents a larger fraction of the main sequence lifetime for these stars.
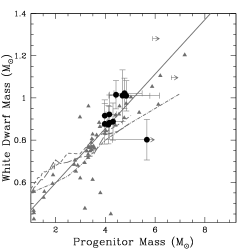
Both of these effects can be illustrated in the M35 empirical IFMR. Figure 9 shows the empirical IFMR for three different assumed ages of M35: 150 Myr, 175 Myr, and 200 Myr. The figure illustrates that, for older assumed ages, the cluster points shift systematically to lower . The slope of the cluster IFMR also steepens significantly with increasing assumed cluster ages.
The conclusions drawn from comparison of the M35 IFMR to that of other clusters will differ depending on the assumed cluster age. If the cluster age is 150 Myr, the cluster IFMR agrees extraordinarily well with the empirical IFMR derived from other clusters. Yet if the cluster age is 200 Myr, one would conclude that the cluster WDs are systematically more massive than those in other young clusters, perhaps indicative of metallicity-dependent mass loss rates (e.g., Marigo & Girardi, 2007; Kalirai et al., 2007).
These same systematics affect attempts to calculate the intrinsic scatter in the IFMR. For a younger M35, the scatter at a given would be explained by the intrinsic observational errors. Yet for an older cluster, the intrinsic scatter would be significant.
This systematic is most severe in young clusters; for old open clusters, the uncertainty in the cluster age is small relative to the progenitor star lifetimes. For example, the 1 Gyr () uncertainty in the age of NGC 6791 results in just a 0.05 change in for its WDs, compared with the uncertainty in for the M35 WDs for the cluster age uncertainty of just 25 Myr (also ).
4.4. Limits on
Observational lower limits on the maximum mass of WD progenitors, , can be determined from IFMR. To zeroth order, this can be accomplished by simply identifying the WD with the highest in the empirical IFMR. However, this approach is complicated by numerous uncertainties. First, the sizes of the error bars on individual WDs are large enough that it is not possible to identify the single WD with the highest . Second, the errors on of individual WDs are asymmetric and non-analytic, complicating any effort to simply calculate limits on . Third, the WDs with the highest come from numerous star clusters, each of which will have its own unique systematic errors in due to the cluster age uncertainties. We therefore elect to use a Monte Carlo simulation to determine the lower observational limits on .
The simulation creates 25000 realizations of the observed WD population in the open clusters M35, the Pleiades (including GD 50 and PG 0136+251, Dobbie et al., 2006b), NGC 2516, NGC 3532, NGC 2287, and Sirius B; WDs from older open clusters are excluded because they either have such low or such large error bars that they do not contribute to the limits on . For each realization, each open cluster is a assigned an age randomly drawn from the values quoted in Table 4.2; as the published errors in cluster ages tend to indicate acceptable ranges rather than a normal distribution about the best value, cluster ages are drawn randomly from a uniform distribution. Additionally, in each realization a and are assigned to each known WD, with values drawn from a normal distribution with a mean of the observed and for the WD, and a standard deviation equal to the stated random errors in each quantity.The assigned and are then used to determine for each WD; if the cooling age of the simulated WD is older than the cluster age, that WD is ignored for that particular realization. For each realization, the highest overall is identified as the lower limit on for that realization.
We perform six runs on this Monte Carlo simulation with varying parameters. Three different WD populations are tested:
-
•
Only the WDs in NGC 2168; this limits the number of systematics involved in the simulation, but provides the loosest limits on ,
-
•
All DA WDs in the five open clusters mentioned in the previous paragraph as well as Sirius B; this data set represents all available useful cluster data, and
-
•
The previous sample minus three WDs of uncertain cluster membership: NGC 2168 LAWDS 11 (see §4.1), and GD 50 and PG 0136+251, as their common space motion with the Pleiades does not prove they were born simultaneously with the cluster.
Each of these three WD populations was paired with two variations on WD core composition. In the first instance, all WDs are assumed to have carbon-oxygen cores; in the second, any WDs with are assumed to have oxygen-neon cores (see §4.6.1).
| WD Sample | Carbon/Oxygen | Oxygen/Neon | ||||||
|---|---|---|---|---|---|---|---|---|
| 50% | 90% | 95% | 99% | 50% | 90% | 95% | 99% | |
| () | () | () | () | () | () | () | ||
| M35 alone | 6.57 | 5.40 | 5.19 | 4.89 | 6.48 | 5.34 | 5.14 | 4.86 |
| All Clusters | 8.86 | 7.41 | 7.08 | 6.51 | 8.39 | 6.95 | 6.70 | 6.34 |
| All Clusters, “Cleaned” | 7.97 | 6.58 | 6.25 | 5.77 | 7.80 | 6.54 | 6.30 | 5.91 |
Note. — Masses are lower limits on from Monte Carlo simulations for the given confidence interval and given core composition for (lower mass WDs are assumed to have C/O cores). The “cleaned” sample excludes LAWDS 11, GD 50, and PG
Results of these calculations are presented in Table 7. Based on the WDs in M35 alone, the 95% confidence lower limit on is , depending on assumed core composition. By combining all available cluster WD data, the 95% confidence lower limit on increases to , depending on the membership of LAWDS 11, GD 50, and PG 0136+251 and on the assumed core composition.
We also note that the combination of all cluster data is required to get the tightest limits on . For example, the Pleiad WD, LB 1497, has the highest plotted in Fig. 8. In our Monte Carlo calculations excluding LAWDS 11, GD 50, and PG 0136+251, LB 1497 only provides the highest in 38% of the realizations. Messier 35 WDs provide the highest in 42% of the realizations, and NGC 2516 in 19% of the realizations. Excluding any one of these three clusters from the Monte Carlo calculation lowers the limit on by .
Combining these lower limits on with emerging upper limits from supernova progenitor searches (, e.g., Hendry et al., 2006; Smartt et al., 2008), it may be reasonable to assert that with 95% confidence for stars near solar-metallicity. However, a more careful analysis of both the WD and supernova data is needed before these constraints can be claimed with confidence.
4.4.1 Systematic errors in the limits on
The primary sources of systematic error in these simulations are from the input star cluster ages and the input stellar evolutionary models. The input ages are all determined from evolutionary models including moderate convective overshoot, and so are reasonably consistently determined despite coming from a multitude of published sources and methods. However, there is a well-known degeneracy between an observed cluster’s age, metallicity, and distance; a significant change in the age of any of the clusters used in this simulation would change the results. And, as stellar models continue to evolve, the derived ages for the entire cluster sample may change systematically.
These same evolutionary models are used to convert the WD progenitor lifetime into . Therefore, any significant changes in the output lifetimes for intermediate-mass stars would also significantly impact these results. However, moderate levels of convective overshoot have become generally accepted in the community and appear to be borne out by observations (e.g., Claret, 2007; Sandberg Lacy et al., 2008).
How large a difference could future changes to evolutionary models make? According to the Padova isochrones, a solar-metallicity model including moderate convective overshoot with a lifetime of 100 Myr has a mass of 5.42, and a mass of 5.18 with no convective overshoot. Therefore, it seems unlikely that our derived limits will change by due to a choice of evolutionary models alone. Larger changes are possible, though, depending on how newer evolutionary models affect the input star cluster ages.
Another possible source of error is due to our combination of data from star clusters of differing metallicity; namely, NGC 2168 is significantly subsolar metallicity, while the remaining clusters and Sirius are close to solar metallicity. Numerous models of super-AGB stars exhibit a dependence of on metallicity (e.g., Siess, 2007, and references therein). Though these models differ significantly on the precise value of , they predict that for stars with the metallicity of NGC 2168 should be systematically to 0.3 lower than for solar-metallicity stars.
We note that incompleteness in the WD sample cannot reduce our lower limits on ; additional WDs can only raise the lower limit.
4.5. The cluster white dwarf distance modulus
The distance modulus and reddening we have adopted for M35 , are based solely on previously-published main-sequence fitting derivations. As the spectral fits to each WD, when combined with the WD photometry, provide a measure on the distance modulus and reddening for each WD, we can use the ensemble averages of these individual measurements as an independent determination of the cluster distance and reddening. Again, due to the uncertainty in its spectral parameters, we do not include LAWDS 22 in these calculations.
The weighted means of the individual distance moduli give a mean WD distance modulus of , with a dispersion of mag. The mean color excesses are , and , . The mean cluster WD distance modulus and are therefore fully consistent with the values determined from main-sequence fitting; the ratio is consistent with the Milky Way reddening law of Rieke & Lebofsky (1985) for .
The measured scatter in the measured color excesses is larger than the uncertainties in the individual measurements (see Table 5). In addition, there is a significant correlation between the individual WD distance moduli and the color excess. These two effects could be explained by differential interstellar extinction across the cluster. If we “correct” each distance modulus to the mean color excess, the dispersion in the distance moduli drops to mag.
However, there is no obvious spatial correlation between WDs with similar measured . In addition, errors in the measured will mimic extinction effects. If the measured is higher than the actual value, then the derived WD absolute magnitude will be too bright, resulting in too large of a measured distance modulus. At the same time, the derived model color will be bluer than the actual WD, resulting in an artificially large measured . The magnitude of this effect is essentially identical to the stated errors in the and measurements in Table 5. Therefore, the errors in can explain most, but not all, of the observed scatter in the and values.
4.6. Notes on interesting objects
4.6.1 Potential oxygen-neon core WDs
Four M35 WDs, LAWDS 2, LAWDS 14, LAWDS 27, and LAWDS 30, have masses within of 1.05, the lower mass of ONe core WDs that may be produced by super-AGB stars (Althaus et al., 2007). For this reason, we have also calculated and for these stars using the ONe WD evolutionary models of Althaus et al. (2007). The ONe models reduce by for all four WDs. The decrease in is due primarily to the lower heat capacity of ONe cores, which allow the ONe-core WDs to cool more rapidly than C/O-core WDs of the same mass.
From our data, we have no means of knowing if these two WDs have carbon-oxygen or oxygen-neon cores. However, stellar evolutionary models of the progenitors of these WDs suggest that they should have C/O cores.
4.6.2 The DB white dwarf LAWDS 4
Claims have been made that a lack of DB WDs exists in younger open clusters (Kalirai et al., 2005a, 2008). Several non-DA WDs are known to exist in the field of younger open clusters, including LP 475-252 (spectral type DBA in the Hyades), NGC 2168: LAWDS 28 (the hot DQ in this cluster; Williams et al., 2006), NGC 1039:LAWDS 26, and NGC 6633:LAWDS 16 (Williams & Bolte, 2007; Rubin et al., 2008), though only LP 475252 has been confirmed as a cluster member via proper motion. We have identified one DB WD in the field of M35, LAWDS 4. If this is a cluster member, it would make M35 the youngest open star cluster with a DB WD member (noting again that M35 contains the non-DA LAWDS 28).
Is LAWDS 4 a cluster member? At present, the low signal-to-noise of the spectrum precludes a robust spectral fit. However, we can estimate its . The weakness of the helium absorption lines, the spectral slope, and the colors are all consistent with a fairly cool (K) DB WD. Based on cooling models provided by P. Bergeron, this DB could only be this cool and still be younger than M35 if it has a relatively low mass ().
If we assume a WD mass of 0.4 to 0.6 and K, the apparent distance modulus of LAWDS 4 is between 10.24 and 10.77, consistent with the cluster distance modulus. In other words, this DB is photometrically consistent with cluster membership, under the assumption that its mass is .
If LAWDS 4 is a cluster member, its progenitor mass would have to be high (), yet the WD mass () lies well below the empirical initial-final mass relation, possible under a binary formation scenario for the WD. It is also possible, and perhaps probable, that this star is a field WD located near the cluster. Accurate, precise proper motion measurements for this WD will likely be necessary to clarify its cluster membership, and a higher signal-to-noise spectrum is needed to determine its and . Clearly, this star warrants further study.
5. Conclusions
In this paper, we have presented observations and analysis of the white dwarf population of the open star cluster M35. Our conclusions are the following.
-
•
Spectroscopy of 14 white dwarf candidates identifies 12 DA, 1 DB, and 1 hot DQ WDs. Temperatures, surface gravities, masses, and cooling ages are derived for each of the DA WDs.
-
•
All twelve DAs are potentially cluster member WDs, with distance moduli consistent with that of the cluster and cooling ages less than the cluster age. The hot DQ and DB are also consistent with being cluster members. Further data, such as proper motion measurements, are necessary to confirm the cluster membership of each star.
-
•
The empirical initial-final mass relation from the M35 white dwarf population is consistent with the roughly linear relation derived from other open star clusters.
-
•
The dominant systematic uncertainty in the empirical initial-final mass relation of M35 is the uncertainty in the star cluster age. In the absence of tighter age constraints, we cannot draw robust conclusions on the intrinsic scatter and metallicity-dependence of the initial-final mass relation.
-
•
Based on M35 WDs alone, the lower limit on the maximum mass of WD progenitor stars () is (95% confidence). Inclusion of WDs from other young open clusters raises this lower limit to , depending on the membership of certain massive white dwarfs and the core composition of the most massive WDs. Combined with upper limits on from supernova surveys, for solar-metallicity stars.
-
•
Based on the cluster WDs alone, we derive a distance modulus to M35 of and reddening of , both in agreement with published values derived from main sequence fitting.
-
•
Four of the DAs have masses that are sufficiently massive that they may possess oxygen-neon cores. The available data are incapable of determining the core compositions, and the core composition has only a small impact on the initial mass of these stars.
References
- Althaus et al. (2007) Althaus, L. G., García-Berro, E., Isern, J., Córsico, A. H., & Rohrmann, R. D. 2007, A&A, 465, 249
- Anders & Grevesse (1989) Anders, E., & Grevesse, N. 1989, Geochim. Cosmochim. Acta, 53, 197
- Anthony-Twarog (1982) Anthony-Twarog, B. J. 1982, ApJ, 255, 245
- Barrado y Navascués et al. (2001a) Barrado y Navascués, D., Deliyannis, C. P., & Stauffer, J. R. 2001a, ApJ, 549, 452
- Barrado y Navascués et al. (2001b) Barrado y Navascués, D., Stauffer, J. R., Bouvier, J., & Martín, E. L. 2001b, ApJ, 546, 1006
- Barstow et al. (2005) Barstow, M. A., Bond, H. E., Holberg, J. B., Burleigh, M. R., Hubeny, I., & Koester, D. 2005, MNRAS, 362, 1134
- Barstow et al. (2003) Barstow, M. A., Good, S. A., Burleigh, M. R., Hubeny, I., Holberg, J. B., & Levan, A. J. 2003, MNRAS, 344, 562
- Barstow et al. (1998) Barstow, M. A., Hubeny, I., & Holberg, J. B. 1998, MNRAS, 299, 520
- Bergeron et al. (1992) Bergeron, P., Saffer, R. A., & Liebert, J. 1992, ApJ, 394, 228
- Bergeron et al. (1994) Bergeron, P., Wesemael, F., Beauchamp, A., Wood, M. A., Lamontagne, R., Fontaine, G., & Liebert, J. 1994, ApJ, 432, 305
- Bessell (1995) Bessell, M. S. 1995, PASP, 107, 672
- Boesgaard & Friel (1990) Boesgaard, A. M., & Friel, E. D. 1990, ApJ, 351, 467
- Busso et al. (1999) Busso, M., Gallino, R., & Wasserburg, G. J. 1999, ARA&A, 37, 239
- Casewell et al. (2008) Casewell, S. L., Dobbie, P. D., Napiwotzki, R., Barstow, M. A., Burleigh, M. R., & Jameson, R. F. 2008, MNRAS, submitted
- Catalán et al. (2008) Catalán, S., Isern, J., García-Berro, E., & Ribas, I. 2008, MNRAS, 387, 1693
- Claret (2007) Claret, A. 2007, A&A, 475, 1019
- Claver et al. (2001) Claver, C. F., Liebert, J., Bergeron, P., & Koester, D. 2001, ApJ, 563, 987
- Dekel & Silk (1986) Dekel, A., & Silk, J. 1986, ApJ, 303, 39
- Dobbie et al. (2006a) Dobbie, P. D., et al. 2006a, MNRAS, 369, 383
- Dobbie et al. (2008) Dobbie, P. D., Napiwotzki, R., Burleigh, M. R., Williams, K., Sharp, R., Barstow, M. A., Casewell, S. L., & Hubeny, I. 2008, MNRAS, submitted
- Dobbie et al. (2006b) Dobbie, P. D., Napiwotzki, R., Lodieu, N., Burleigh, M. R., Barstow, M. A., & Jameson, R. F. 2006b, MNRAS, 373, L45
- Dobbie et al. (2004) Dobbie, P. D., Pinfield, D. J., Napiwotzki, R., Hambly, N. C., Burleigh, M. R., Barstow, M. A., Jameson, R. F., & Hubeny, I. 2004, MNRAS, 355, L39
- Dufour et al. (2008) Dufour, P., Fontaine, G., Liebert, J., Schmidt, G. D., & Behara, N. 2008, ApJ, 683, 978
- Ferrario et al. (2005) Ferrario, L., Wickramasinghe, D., Liebert, J., & Williams, K. A. 2005, MNRAS, 361, 1131
- Fontaine et al. (2001) Fontaine, G., Brassard, P., & Bergeron, P. 2001, PASP, 113, 409
- Garcia-Berro et al. (1997) Garcia-Berro, E., Ritossa, C., & Iben, I. J. 1997, ApJ, 485, 765
- Hartman et al. (2008) Hartman, J. D., et al. 2008, ApJ, 675, 1233
- Hendry et al. (2006) Hendry, M. A., et al. 2006, MNRAS, 369, 1303
- Herbig (1966) Herbig, G. H. 1966, Zeitschrift fur Astrophysik, 64, 512
- Herwig (2005) Herwig, F. 2005, ARA&A, 43, 435
- Holberg & Bergeron (2006) Holberg, J. B., & Bergeron, P. 2006, AJ, 132, 1221
- Jannuzi et al. (2003) Jannuzi, B. T., Claver, J., & Valdes, F. 2003, The NOAO Deep Wide-Field Survey MOSAIC Data Reductions (Tucson: NOAO)
- Jeffries et al. (2002) Jeffries, R. D., Totten, E. J., Harmer, S., & Deliyannis, C. P. 2002, MNRAS, 336, 1109
- Jones & Prosser (1996) Jones, B. F., & Prosser, C. F. 1996, AJ, 111, 1193
- Kalirai et al. (2007) Kalirai, J. S., Bergeron, P., Hansen, B. M. S., Kelson, D. D., Reitzel, D. B., Rich, R. M., & Richer, H. B. 2007, ApJ, 671, 748
- Kalirai et al. (2003) Kalirai, J. S., Fahlman, G. G., Richer, H. B., & Ventura, P. 2003, AJ, 126, 1402
- Kalirai et al. (2008) Kalirai, J. S., Hansen, B. M. S., Kelson, D. D., Reitzel, D. B., Rich, R. M., & Richer, H. B. 2008, ApJ, 676, 594
- Kalirai et al. (2005a) Kalirai, J. S., Richer, H. B., Hansen, B. M. S., Reitzel, D., & Rich, R. M. 2005a, ApJ, 618, L129
- Kalirai et al. (2005b) Kalirai, J. S., Richer, H. B., Reitzel, D., Hansen, B. M. S., Rich, R. M., Fahlman, G. G., Gibson, B. K., & von Hippel, T. 2005b, ApJ, 618, L123
- Kalirai & Tosi (2004) Kalirai, J. S., & Tosi, M. 2004, MNRAS, 351, 649
- Koester et al. (2001) Koester, D., et al. 2001, A&A, 378, 556
- Koester & Reimers (1996) Koester, D., & Reimers, D. 1996, A&A, 313, 810
- Lajoie & Bergeron (2007) Lajoie, C.-P., & Bergeron, P. 2007, ApJ, 667, 1126
- Landolt (1992) Landolt, A. U. 1992, AJ, 104, 340
- Leonard & Merritt (1989) Leonard, P. J. T., & Merritt, D. 1989, ApJ, 339, 195
- Liebert et al. (2005a) Liebert, J., Bergeron, P., & Holberg, J. B. 2005a, ApJS, 156, 47
- Liebert et al. (2005b) Liebert, J., Young, P. A., Arnett, D., Holberg, J. B., & Williams, K. A. 2005b, ApJ, 630, L69
- Marigo (2001) Marigo, P. 2001, A&A, 370, 194
- Marigo & Girardi (2007) Marigo, P., & Girardi, L. 2007, A&A, 469, 239
- Marigo et al. (2008) Marigo, P., Girardi, L., Bressan, A., Groenewegen, M. A. T., Silva, L., & Granato, G. L. 2008, A&A, 482, 883
- Marshall et al. (2005) Marshall, J. L., Burke, C. J., DePoy, D. L., Gould, A., & Kollmeier, J. A. 2005, AJ, 130, 1916
- Martin (2005) Martin, C. L. 2005, ApJ, 621, 227
- Massey & Slesnick (1999) Massey, P., & Slesnick, C. L. 1999, NOAO Newsletter, 59
- Mazzei & Pigatto (1989) Mazzei, P., & Pigatto, L. 1989, A&A, 213, L1
- McCarthy et al. (1998) McCarthy, J. K., et al. 1998, in Proc. SPIE Vol. 3355, p. 81-92, Optical Astronomical Instrumentation, Sandro D’Odorico; Ed., ed. S. D’Odorico, 81–92
- McKee & Ostriker (1977) McKee, C. F., & Ostriker, J. P. 1977, ApJ, 218, 148
- McNamara & Sekiguchi (1986) McNamara, B. J., & Sekiguchi, K. 1986, ApJ, 310, 613
- Mermilliod (1981) Mermilliod, J. C. 1981, A&A, 97, 235
- Meynet et al. (1993) Meynet, G., Mermilliod, J.-C., & Maeder, A. 1993, A&AS, 98, 477
- Mochejska et al. (2004) Mochejska, B. J., Stanek, K. Z., Sasselov, D. D., Szentgyorgyi, A. H., Westover, M., & Winn, J. N. 2004, AJ, 128, 312
- Napiwotzki (1997) Napiwotzki, R. 1997, A&A, 322, 256
- Napiwotzki et al. (1999) Napiwotzki, R., Green, P. J., & Saffer, R. A. 1999, ApJ, 517, 399
- Oke et al. (1995) Oke, J. B., et al. 1995, PASP, 107, 375
- Origlia et al. (2006) Origlia, L., Valenti, E., Rich, R. M., & Ferraro, F. R. 2006, ApJ, 646, 499
- Perryman et al. (1998) Perryman, M. A. C., et al. 1998, A&A, 331, 81
- Pinsonneault et al. (1998) Pinsonneault, M. H., Stauffer, J., Soderblom, D. R., King, J. R., & Hanson, R. B. 1998, ApJ, 504, 170
- Poelarends et al. (2008) Poelarends, A. J. T., Herwig, F., Langer, N., & Heger, A. 2008, ApJ, 675, 614
- Poelarends et al. (2006) Poelarends, A. J. T., Izzard, R. G., Herwig, F., Langer, N., & Heger, A. 2006, Memorie della Societa Astronomica Italiana, 77, 846
- Press et al. (1992) Press, W. H., Teukolsky, S. A., Vetterling, W. T., & Flannery, B. P. 1992, Numerical recipes in FORTRAN. The art of scientific computing (Cambridge: University Press, —c1992, 2nd ed.)
- Reimers & Koester (1988) Reimers, D., & Koester, D. 1988, A&A, 202, 77
- Rieke & Lebofsky (1985) Rieke, G. H., & Lebofsky, M. J. 1985, ApJ, 288, 618
- Romanishin & Angel (1980) Romanishin, W., & Angel, J. R. P. 1980, ApJ, 235, 992
- Rubin et al. (2008) Rubin, K. H. R., Williams, K. A., Bolte, M., & Koester, D. 2008, AJ, 135, 2163
- Salaris et al. (2008) Salaris, M., Serenelli, A., Weiss, A., & Miller Bertolami, M. 2008, ApJ, submitted (arXiv:0807.3567)
- Salpeter (1955) Salpeter, E. E. 1955, ApJ, 121, 161
- Sandberg Lacy et al. (2008) Sandberg Lacy, C. H., Torres, G., & Claret, A. 2008, AJ, 135, 1757
- Sarajedini et al. (2004) Sarajedini, A., Brandt, K., Grocholski, A. J., & Tiede, G. P. 2004, AJ, 127, 991
- Schuler et al. (2003) Schuler, S. C., King, J. R., Fischer, D. A., Soderblom, D. R., & Jones, B. F. 2003, AJ, 125, 2085
- Siess (2007) Siess, L. 2007, A&A, 476, 893
- Slesnick et al. (2002) Slesnick, C. L., Hillenbrand, L. A., & Massey, P. 2002, ApJ, 576, 880
- Smartt et al. (2008) Smartt, S. J., Eldridge, J. J., Crockett, R. M., & Maund, J. R. 2008, MNRAS, submitted (arXiv:0809.0403)
- Stauffer et al. (1998) Stauffer, J. R., Schultz, G., & Kirkpatrick, J. D. 1998, ApJ, 499, L199
- Stetson (1987) Stetson, P. B. 1987, PASP, 99, 191
- Sung & Bessell (1999) Sung, H., & Bessell, M. S. 1999, MNRAS, 306, 361
- Sung et al. (2002) Sung, H., Bessell, M. S., Lee, B.-W., & Lee, S.-G. 2002, AJ, 123, 290
- Tout et al. (2008) Tout, C. A., Wickramasinghe, D. T., Liebert, J., Ferrario, L., & Pringle, J. E. 2008, MNRAS, 387, 897
- Twarog et al. (1997) Twarog, B. A., Ashman, K. M., & Anthony-Twarog, B. J. 1997, AJ, 114, 2556
- van Dokkum (2001) van Dokkum, P. G. 2001, PASP, 113, 1420
- von Hippel (2005) von Hippel, T. 2005, ApJ, 622, 565
- von Hippel et al. (2002) von Hippel, T., Steinhauer, A., Sarajedini, A., & Deliyannis, C. P. 2002, AJ, 124, 1555
- Weidemann (2000) Weidemann, V. 2000, A&A, 363, 647
- Wickramasinghe & Ferrario (2000) Wickramasinghe, D. T., & Ferrario, L. 2000, PASP, 112, 873
- Williams & Bolte (2007) Williams, K. A., & Bolte, M. 2007, AJ, 133, 1490
- Williams et al. (2004) Williams, K. A., Bolte, M., & Koester, D. 2004, ApJ, 615, L49
- Williams et al. (2006) Williams, K. A., Liebert, J., Bolte, M., & Hanson, R. B. 2006, ApJ, 643, L127
- Wood (1995) Wood, M. A. 1995, LNP Vol. 443: White Dwarfs, 443, 41