Blue Stragglers after the Main Sequence
Abstract
We study the post-main sequence evolution of products of collisions between main sequence stars (blue stragglers), with particular interest paid to the horizontal branch and asymptotic giant branch phases. We found that the blue straggler progeny populate the colour-magnitude diagram slightly blueward of the red giant branch and between 0.2 and 1 magnitudes brighter than the horizontal branch. We also found that the lifetimes of collision products on the horizontal branch is consistent with the numbers of so-called “evolved blue straggler stars” (E-BSS) identified by various authors in a number of globular clusters, and is almost independent of mass or initial composition profile. The observed ratio of the number of E-BSS to blue stragglers points to a main sequence lifetime for blue stragglers of approximately 1-2 Gyr on average.
Subject headings:
blue stragglers – stars: horizontal branch – stars: AGB and post-AGB – globular clusters: general1. INTRODUCTION
Blue stragglers are main sequence stars that are bluer and brighter than the main sequence turnoff in clusters. They are expected to have been formed through either dynamical processes, such as direct stellar collisions or during the disruption of a binary system; or through the coalescence of an unperturbed primordial binary in the cluster.
Blue straggler populations have been used to try to and constrain the dynamical evolution of globular clusters (e.g. Hut, 1993). Since the number of collision products in a cluster should tell us about the rate of collisions in the past, it follows that we should be able to constrain the density, mass function, or other cluster properties from the blue straggler population. In practice this has been difficult, since the number of unsettled questions about the formation mechanisms of blue stragglers, and competing effects of cluster evolution, is large. However, Sills et al. (2000) and Monkman et al. (2006) claim, based on the blue straggler population, that 47 Tucanae may have come close to core collapse a few Gyr ago; and Ferraro et al. (1999) use the blue straggler population of M80 to postulate imminent core collapse in that cluster as well.
But what happens after the blue stragglers evolve off the main sequence? Can we see them anywhere in the colour-magnitude diagram (CMD), and if we can, does that give us any further information about the past of the cluster? Blue stragglers have lifetimes of approximately 1 Gyr or so (Sills et al., 1997), and it would be useful to probe slightly further back in time if we can.
There is a population of HB stars in clusters slightly brighter than the regular horizontal branch that has been seen in M3 as early as Sandage (1953). Blue stragglers are expected to have masses of up to twice the turnoff mass in globular clusters, and using these masses in standard single-star evolutionary models puts them in this part of the HB branch of the CMD (Renzini & Fusi Pecci, 1988): BSS progeny should be redder and slightly brighter than their low-mass counterparts. Knowing the relative numbers of blue stragglers and their evolved progeny can constrain the lifetimes of these two stages. Iben (1986) also suggests that different formation mechanisms for blue stragglers could result in very different properties later in their evolution, and so observing evolved blue stragglers may help us constrain their formation.
Evolved blue stragglers should also exist in the instability strip, and the expectation is that they could be observed as Anomalous Cepheids. These stars are low metallicity pulsating stars approximately 2 magnitudes brighter than RR Lyrae stars, and with pulsation periods around 1.5 days. Almost all are found in dwarf galaxies in the Local Group. They are expected to be the result of mass transfer and possibly coalescence in a low mass binary system (up to about 1.6 M⊙) (Zinn & Searle, 1976; Cox & Proffitt, 1988), which is exactly the same as one scenario for the formation of blue stragglers. Only one anomalous Cepheid has been observed in a Galactic Globular Cluster: V19 in NGC 5466 (Zinn & King, 1982). A detailed spectroscopic study of that star (McCarthy & Nemec, 1997) found a mass of 1.66 +0.7-0.5 M⊙, a small rotational velocity km s-1, normal iron, s-process, and alpha element abundances for a cluster member, and some evidence for a very long-period (P 10 000 days) binary orbit. The rotational velocity, chemical composition, and orbital period argue against a recent Roche Lobe overflow mass transfer episode, but are not inconsistent with a collisional origin for the blue straggler. Unfortunately, NGC 5466 is quite a sparse cluster and therefore collisions are rather unlikely. Nevertheless, the existence of an unusual evolved star as well as a significant number of blue stragglers in this cluster makes it an interesting case.
The first paper to explore the possible connection between blue stragglers and horizontal branch morphology in many clusters was Fusi Pecci et al. (1992). They looked at 21 globular clusters with both blue stragglers and well-observed horizontal branches. They argue that the reddest horizontal branch stars, particularly in clusters with bluer HBs, are the descendents of blue stragglers. Based on their analysis of the observations of BSS and HB stars in 10 globular clusters, they determine that the average ratio of the number of blue stragglers to the number of “blue straggler progeny” on the HB to range from 1 to 10, with a mean of 6.6 and an overall value of 5.3, summed over the 10 clusters.
Bailyn (1994) studied the evolved stars in the nearby globular cluster 47 Tucanae, using a combination of ground-based and Hubble Space Telescope (WFPC) observations to look at the distribution of these stars throughout the cluster. He found an enhancement of asymptotic giant branch (AGB) stars, approximately one magnitude brighter than the horizontal branch, in the centre of this cluster only. Since the blue stragglers in that cluster (and many others) are centrally concentrated, he makes the link between these two populations. More recently, Beccari et al. (2006) used HST/ACS to look at the evolved stars in 47 Tucanae with better precision than the study of Bailyn (1994). They confirm Bailyn’s result of a central enhancement of AGB stars, which they interpret as the result of evolved blue stragglers formed in binary mergers. Neither study was sensitive to stars much fainter than the HB, and so do not give the number of blue stragglers, or the ratio of blue stragglers to HB or AGB stars.
Blue stragglers and their evolved counterparts (E-BSS) have been identified using HST/WFPC2 in M3 (Ferraro et al., 1997a), M13 (Ferraro et al., 1997b, 1999) and M80 (Ferraro et al., 1999). The E-BSS are identified as being slightly bluer than the RGB and between 0.2 and 1 magnitudes brighter than the horizontal branch in those clusters. In M3 and M80, the radial distribution of the blue stragglers and E-BSS is the same, while both populations are more centrally concentrated than the normal RGB stars in those clusters. The ratios of ‘bright’ blue stragglers to E-BSS are determined from these studies to be 6.4 in M3, 2.2 in M13, and 6.8 in M80 In M80, the population of blue stragglers is so well determined that the limitation to bright blue stragglers is not necessary. In that case, the ratio of all blue stragglers to E-BSS is 16.
In this paper, we use models of stellar collision products as starting models for stellar evolutionary calculations. We follow the evolution of these stars from the main sequence to the giant branch, through the helium flash onto the horizontal branch, and onto the asymptotic giant branch. We look at their positions in the HR diagram and their lifetimes, and compare to the observational evidence listed above. We wish to determine whether the stars identified in the observational studies are indeed evolved blue stragglers, and whether their observed properties agree with our models of blue straggler formation and evolution. We outline our computational method in section 2, and present the results in section 3. The implications and a discussion of further questions follows in section 4.
2. METHOD
In this paper, we assume that blue stragglers were formed during direct collisions between two unrelated main sequence stars. The other methods of forming blue stragglers (collisions mediated by binary stars, and mass transfer in binary systems) will probably result in somewhat different structure and composition profiles of the newly-born blue stragglers (see e.g. Bailyn & Pinsonneault, 1995). However, the direct collision products are the best-studied blue stragglers to date (Sills et al., 1997; Sandquist et al., 1997; Sills et al., 2001), and also the easiest to model. The possible implications of this choice on our results will be discussed in section 4.
2.1. The collision parents
We used the Yale Rotational Evolutionary Code (YREC, Guenther et al., 1992) to calculate evolutionary tracks for representative globular cluster stars. We chose a metallicity of Z=0.001 and Y=0.232 (corresponding to [Fe/H]=-1.27 where Z⊙ = 0.0188). Our mixing length is , calibrated to give the solar luminosity and radius at the solar age for a solar-mass star with solar metallicity. We ran models for 0.4 M⊙, 0.6 M⊙and 0.8 M⊙ stars, starting at the deuterium-burning birthline (Palla & Stahler, 1991), and followed the evolution through the pre-main sequence and main sequence phases.
We are interested in collision products which would show up in the blue straggler region of the colour-magnitude diagram at the current time, or in the recent past. We assume that the typical mass of turnoff stars in globular clusters is 0.8 M⊙. From our evolutionary models, the age of a 0.8 M⊙ star at hydrogen core exhaustion is 13.7 Gyr, so we choose this value to be a typical age of a globular cluster.
In previous work (e.g. Sills et al., 1997), the parent stars were assumed to have the current age of the cluster. In other words, all collisional blue stragglers were formed from parents whose composition profile was that of a 13.7-Gyr-old star. However, collision products can live on the main sequence for quite a long time – up to an additional 10 Gyr for a low-mass collision product of 0.8 or 0.9 M⊙. Therefore, we should be including collision products whose parents collided quite some time ago, and whose structure was that of a much younger star. The thermodynamic and physical structure does not change much on the main sequence, but the chemical composition profile of the star is modified by nuclear burning. For the 0.4 M⊙ models, this effect is not very strong since they have completed only a small fraction of their main sequence lifetime. However, the 0.8 M⊙ models have significantly different amounts of helium in their cores if we look at the models at an age of 10 Gyr compared to 13.7 Gyr. The younger star has Y=0.855 at its centre, compared to Y=0.998 in the older turnoff star.
We chose 5 different ages of parents to investigate this effect: 0.03 Gyr (corresponding to the amount of time it takes a 1.0 M⊙ star to reach the zero-age main sequence from the birthline), 2 Gyr, 5 Gyr, 10 Gyr and 13.7 Gyr. We labeled these ages as A, B, C, D and E when discussing our collision products in the rest of the paper. The evolutionary tracks, and the positions of the parents at these ages, are show in figure 1.
In this paper, we looked at all collision products which could plausibly be seen in the colour-magnitude diagram of a globular cluster – those that could be on the main sequence, giant branch, horizontal branch or asymptotic giant branch at the current time. To determine which collision products to concentrate on, we estimated the main sequence lifetime of each product after the collision. If the sum of the time of the collision plus the main sequence lifetime of the product was 10 Gyr or longer, we included those stars in our investigation. For example, a collision between two 0.8 M⊙ stars at time B (2 Gyr after the cluster was formed) results in a collision product which is approximately 1.5 to 1.6 M⊙. The main sequence lifetime of a 1.5 M⊙ star is something like 4 Gyr, and so this particular collision product will not be around at the present time. In fact, the only collisions between two 0.8 M⊙ stars that could possibly be observed now are those which occurred at times D and E in this scheme. Collisions between two 0.4 M⊙ stars, on the other hand, produce stars with masses of 0.8 M⊙ or less, and all of those collision products should still be on or close to the main sequence.
The collisions that we will discuss in this paper are given in Table 1. We give the name of each collision, the masses of the two parent stars, the age of the parents at the time of collision, and the mass of the collision product.
| Collision Name | M1 | M2 | Time of Collision | Mtot |
|---|---|---|---|---|
| M⊙ | M⊙ | Gyr | M⊙ | |
| m04m04A | 0.4 | 0.4 | 0.03 | 0.78 |
| m04m04B | 0.4 | 0.4 | 2 | 0.78 |
| m04m04C | 0.4 | 0.4 | 5 | 0.78 |
| m04m04D | 0.4 | 0.4 | 10 | 0.78 |
| m04m04E | 0.4 | 0.4 | 13.7 | 0.78 |
| m04m06C | 0.4 | 0.6 | 5 | 0.98 |
| m04m06D | 0.4 | 0.6 | 10 | 0.98 |
| m04m06E | 0.4 | 0.6 | 13.7 | 0.98 |
| m04m08D | 0.4 | 0.8 | 10 | 1.18 |
| m04m08E | 0.4 | 0.8 | 13.7 | 1.18 |
| m06m06D | 0.6 | 0.6 | 10 | 1.17 |
| m06m06E | 0.6 | 0.6 | 13.7 | 1.18 |
| m06m08D | 0.6 | 0.8 | 10 | 1.37 |
| m06m08E | 0.6 | 0.8 | 13.7 | 1.38 |
| m08m08D | 0.8 | 0.8 | 10 | 1.57 |
| m08m08E | 0.8 | 0.8 | 13.7 | 1.58 |

2.2. The collision product and evolution to the Main Sequence
We used the code Make Me A Star (MMAS Lombardi et al., 2002) to calculate the structure and chemical profile of our collision products. MMAS takes the results of stellar evolution calculations (from YREC or other codes), and uses a method called “sort by entropy” to determine the structure and chemical profile of the collision product. It has been shown that the results of low-velocity stellar collisions can be readily approximated by determining the entropy of each shell in the parent star (using ) and then creating the collision product by sorting the shells of both parents stars so that entropy increases outward. This technique assumes that the collision does not shock-heat much of the material (thereby changing its entropy), and was based on the results of smoothed particle hydrodynamic simulations of stellar collisions.
We assumed that all collisions occurred with a periastron separation of 0.5 times the sum of the radii of the two stars. It has been shown that the mass and structure of the collision products does not depend strongly on the impact parameter, except that head-on collisions are different than off-axis collisions (Lombardi et al., 1996; Sills et al., 1997). Since head-on collisions are very rare, we chose to use a representative off-axis collision.
We used the method outlined in Sills et al. (1997) to take the collisions products and evolve them from the end of the collision to the main sequence. For this portion of the evolution, we used YREC. In this stage, and throughout the paper, we neglect any rotation of the collision product in our evolution. We stopped the evolution when the energy generation due to hydrogen burning was larger than that due to gravitational contraction, and the star had reached the faintest luminosity in that region of the CMD. This is equivalent to the definition of the Zero Age Main Sequence for a normal pre-main sequence evolutionary track. This post-collision stage lasted between and years, depending on the mass of the collision product.
2.3. Evolution from the Main Sequence
We wish to follow these collision products on the main sequence and giant branch, onto the horizontal branch and then to the asymptotic giant branch. These products are low mass stars, and so they will undergo the helium flash at the tip of the giant branch. YREC, like most stellar evolution codes, cannot follow the evolution of a star through the helium flash because of the very short timescales involved and large helium burning luminosities, up to , depending on the initial mass and .
The Monash stellar evolution code, however, can evolve stars through the core helium flash (e.g., Karakas et al., 2002)111Lattanzio (1986) created zero-age horizontal branch models instead of evolving through the flash.. This is because the code has been specifically adapted (Lattanzio, 1986, 1991; Frost & Lattanzio, 1996) to model the evolution of AGB stars and the conditions during instabilities of the He-burning shell (Schwarzschild & Härm, 1965) are similar, though not as extreme, as found in the cores of low-mass stars during He ignition.
Neutrinos losses are also an important component when modeling the core helium flash because they move the temperature maximum, and hence the ignition point, outward from the stellar center. Neutrinos losses included in the Monash code are described in detail in Lattanzio (1986). Note that the maximum stellar mass that experiences the core helium flash decreases as a function of metallicity; this is because these models are hotter owing to a lower opacity; at this mass is M⊙ compared to 2.25 M⊙ at . We stress that although we can use the Monash evolution code to evolve models through the core helium flash, the models should only be considered as crude approximations, given that the details of the evolution depend critically on the assumptions made about convective energy transport, that is clearly not one dimensional in nature. A thorough understanding about this complicated phase will require detailed multi-dimensional hydrodynamical modeling, see Dearborn et al. (2006) for recent efforts.
We converted the results of the YREC calculations into the format required by the Monash code. We assumed that the star was initially fully convective. The Monash code determines which shells of the star are convective before doing any subsequent mixing or evolution, so this assumption was purely for simplicity. To calculate the internal energy, we assumed that the equation of state was that of an ideal monatomic gas plus radiation pressure, which is a good approximation to main sequence low mass stars. The mass, radius, luminosity, pressure, temperature, density and compositions of H, 3He, 4He, C, N, O and Z were taken from the YREC models directly. These new models were then used as starting models, and the collision products were evolved from the main sequence until the asymptotic giant branch. In some cases, the evolution continued through the thermal pulse phase and onto the post-AGB and white-dwarf cooling track.
In the Monash evolution code we included mass loss using the Reimers (1975) formula
| (1) |
where and are the stellar luminosity, radius and mass, respectively, and the parameter varies between 0.4 4, although values as high as 10 have been used (Straniero et al., 1997). We set the parameter on the RGB and on the AGB. To test the effect of mass loss on the AGB lifetime in the collision-product runs, we also used the Vassiliadis & Wood (1993) formulation on the AGB, that relates the fundamental pulsation period of the star to the mass-loss rate, and includes a superwind phase once the period increases above 500 days. We assumed instantaneous mixing, and used the same mixing length as used in YREC, . For more details of the input physics used in the Monash evolution code we refer the reader to Lattanzio (1986); Frost & Lattanzio (1996) and and Karakas & Lattanzio (2007).
3. Results

3.1. Comparison to Normal Stars
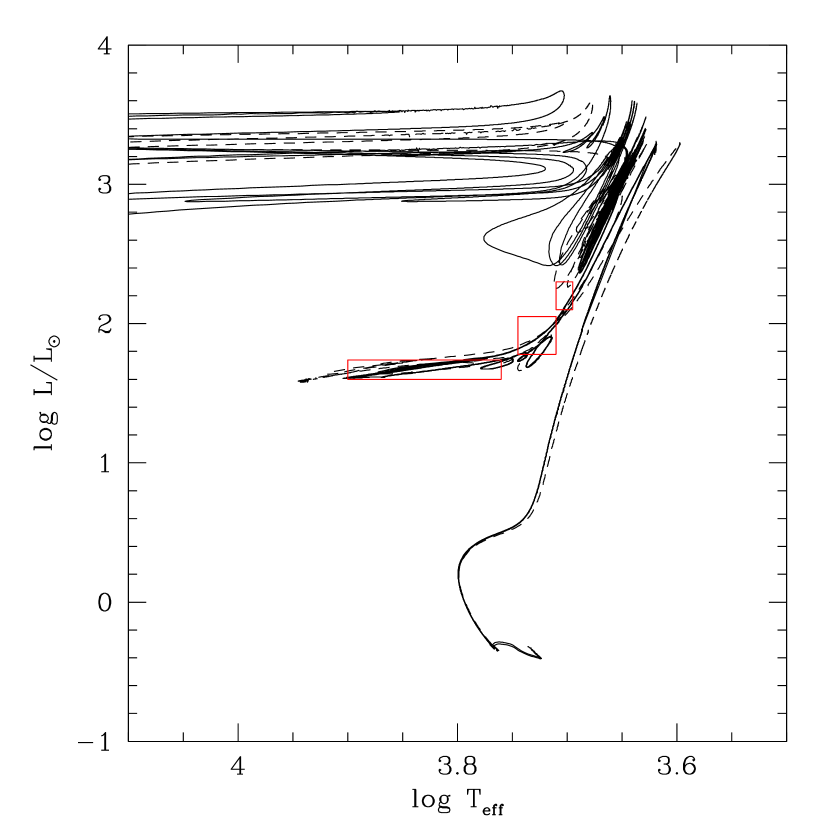
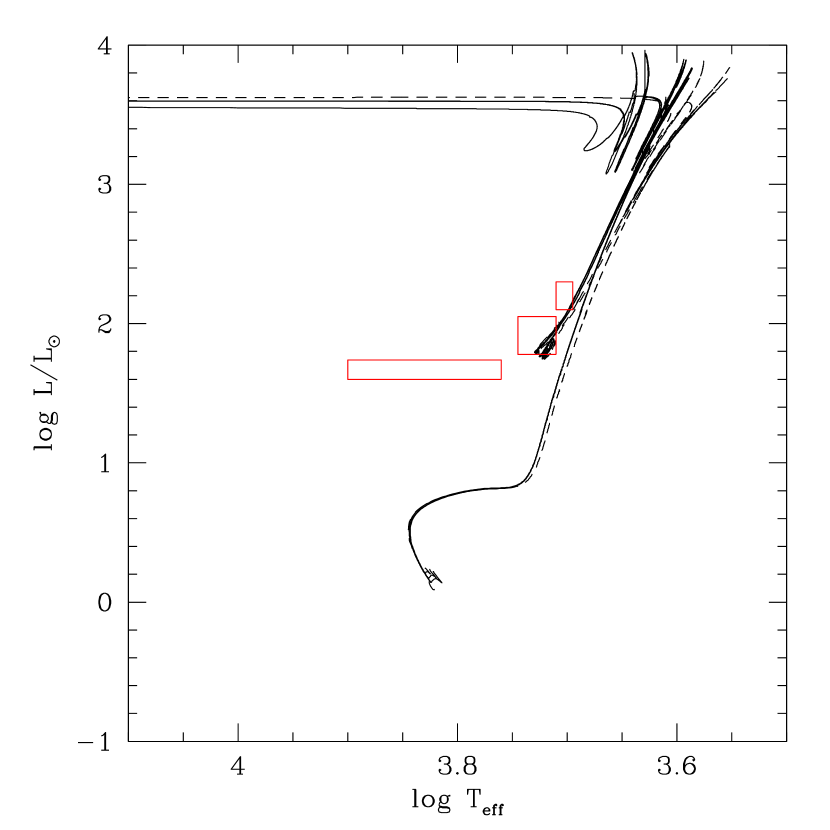
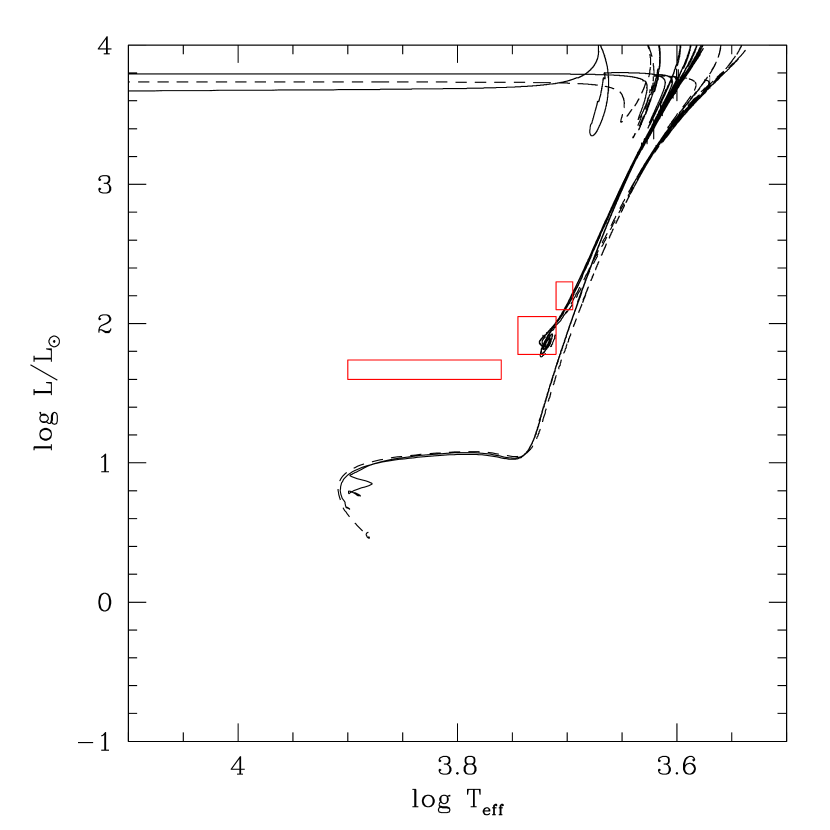
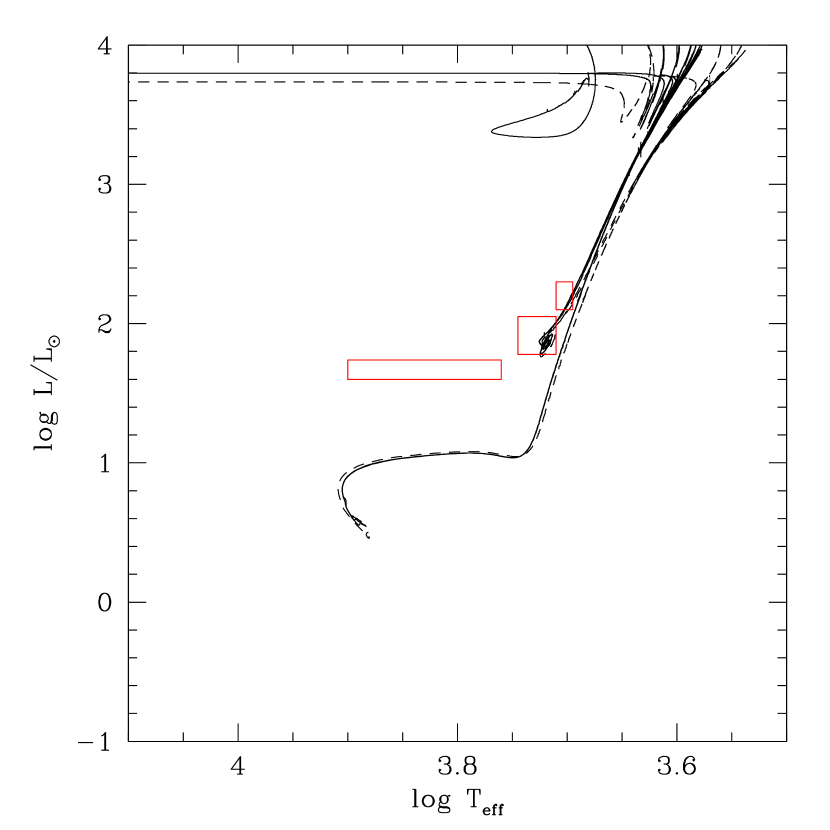
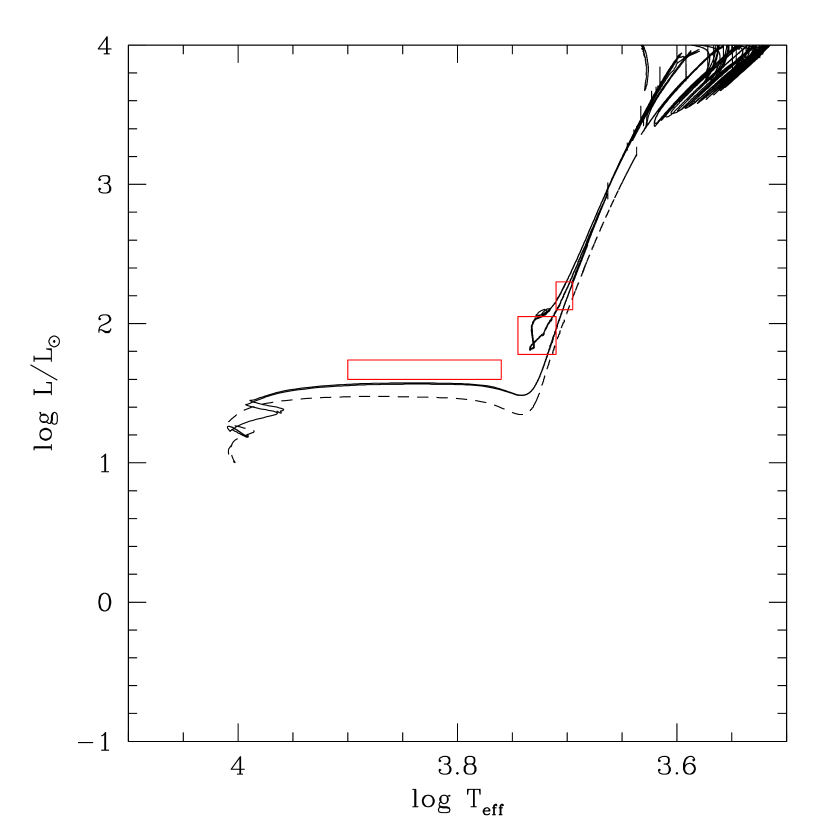
In figures 2 – 7, we present evolutionary tracks of each of our collision products. Each figure corresponds to a different choice of parent star masses. The different lines correspond to the different ages at which the parent stars collided. We also present evolutionary tracks of normal stars of similar masses to our collision products, shown in the figures as dashed lines. The normal stars have a uniform chemical composition throughout the star at the Zero Age Main Sequence, with 0.001 and 0.232, the same as our parent stars.
In all these figures, we have marked the approximate position of the observed “E-BSS” stars, as well as the horizontal branch and the base of the asymptotic giant branch (where these stars are most likely to be found observationally). The HB was defined by the evolutionary track of the m=0.78 M⊙track, and lies at a luminosity of . The AGB box was chosen to lie just above the start of the AGB (as defined below ) for most of our tracks.
The E-BSS stars are, observationally, found somewhere between 0.2 and 1 magnitudes brighter than the horizontal branch (Bailyn, 1994; Ferraro et al., 1997a, 1999), and just to the blue of the RGB. Because we are working in the theoretical plane, we need to convert from magnitude differences to luminosity differences: one magnitude is equal to a difference of 0.4 in . Therefore, our E-BSS box goes from to , and we chose the temperature extent to begin just blueward of the RGB and extend for a few hundred degrees.
The main sequence position of each track in the CMD is very similar in each figure. Choosing a different time of collision for the parent stars makes a small difference to the position of the collision product in the CMD. The evolutionary tracks are also very similar to their normal main sequence counterpart. As has been shown in previous work (Sills et al., 1997), the collisions involving lower-mass parents show less effect on the main sequence. The lower-mass parents are less evolved overall. The 0.8 M⊙ stars are at the turnoff at time ‘E’, whereas the 0.4 M⊙ stars are simply a few more Gyrs along in their 40 Gyr evolution.
The post-main sequence evolution of the normal stars and the collision products is very similar. There is some slight colour difference between the normal stars and collision products on the giant branch, with the normal stars being slightly redder. The difference is usually a few tens of degrees at a given luminosity, and is probably not observable. The largest different is 300 degrees at the tip of the giant branch in figure 2, and even this will be difficult to observe since there should be essentially no blue stragglers in that evolutionary state in most clusters.
The location of the core-helium-burning phase for higher-mass stars is consistent with the nominal observed position of the E-BSS stars in the CMD. For all the collision products except the m04m04 series, the E-BSS box covers the majority of the track during core-helium-burning.
3.1.1 Horizontal Branch Evolution
 |
In the CMDs for both normal stars and collision products, we see some loops in the CMD on the early part of the horizontal branch, see figure 8. These loops are a product of taking the star through the helium flash, rather than stopping the evolution at the tip of the giant branch and restarting it with a zero-age horizontal branch model, as is done by a number of groups (Charbonnel et al., 1996; Castellani et al., 1992; Stancliffe et al., 2005). The timescale for these loops is very short ( years), and they occur at the end of the helium flash but before stable core helium burning has begun.
 |
 |
The loops are caused by successive oscillations of the core as it settles down after the core He-flash. In figure 9(a) we show the surface and helium-burning luminosity from the m04m04B collision model during the core helium flash. Illustrated are successive flashes of lessening intensity, these occur because the core helium flash is off center to begin with, and each successive flash moving inward (in mass) and removing degeneracy. This is similar to the degenerate carbon ignition found in 8 to 11 M⊙ stars (Siess, 2006). In figure 9(b) we see the change to the effective temperature from the tip of the GB to the beginning of quiescent core helium burning. The effective temperature first increases when the flash begins, followed by short timescale, small amplitude oscillations caused by the whole star expanding and contracting from the successive core flashes. Once the star begins quiescent core helium burning the effective temperature stays approximately constant. We do not assume any extra mixing, convective overshoot, etc. from the border of the core during this phase.
3.2. Lifetimes and Possible Evolved Blue Straggler Stars
We are interested in how many post-main sequence blue stragglers we might expect. One easy way to approximate this is to look at the timescales of each of the different stages in the CMD, and to equate the relative number of objects in each stage to the ratio of the lifetimes. First we need to clearly define each stage. We took the “zero age” main sequence to be the start of the calculation using the Monash code. At this point, the stars have come into hydrostatic equilibrium, and are burning hydrogen in their cores. We define the end of the main sequence (Terminal Age Main Sequence) to be the age at which the central helium mass fraction has reached 0.99. We are also interested in the age that defines the beginning of the horizontal branch, which we take to be the age at which drops to 0.97 after the TAMS. The end of the horizontal branch phase occurs when the central drops to zero, and we also take this to be the start of the asymptotic giant branch phase.
Mass loss terminates asymptotic giant branch evolution when the envelope mass is reduced to 0.01M⊙(Blöcker, 2001), or when with approaching unity as the star evolves to the white dwarf (WD) cooling track (Schoenberner, 1979). We choose to define a star to have left the AGB track when the effective temperature, , increases by on the CMD (Karakas & Lattanzio, 2007). From figure 10 we can approximate the location of the AGB to be . Some models evolved to the WD cooling track, so to obtain an accurate estimate of the AGB lifetime, we needed to remove the time spent during the post-AGB (usually short, years) plus on the WD cooling track. For other models, convergence difficulties ended the calculation before all of the envelope mass was lost and the model did not move away from the AGB. For all the collision models, however, and all final envelope masses are few times M⊙or less (maximum is 0.034M⊙). In particular, all Reimer’s models had except the m08m08D model, that had and an envelope mass of 0.016M⊙. For models that had their evolution halted by convergence difficulties, the final envelope mass was small enough that we can assume that no more thermal pulses would occur, and that the final timestep is an excellent approximation to the final AGB time. This is further justified because the thermally-pulsing phase is itself a small fraction of the total AGB lifetime. For example, the total AGB lifetime of the 1.58M⊙, normal model is 488.6 Myr, much longer than the thermally-pulsing AGB lifetime of only 2.1 Myr. The final envelope mass was M⊙, which would be lost in much less than the time taken between successive shell flashes.
In figure 10, we show a few evolutionary tracks, with these important points marked with solid symbols. The duration of each phase for all our collision products is given in table 2, and for the normal stars in table 3. In all cases, the mass loss on the AGB was calculated using the Reimer’s formalism. The first column of each table identifies the star or collision product. The next three columns give the main sequence, horizontal branch, and asymptotic branch lifetime in Gyr. The final two columns give the ratio of main sequence to horizontal branch lifetime, and the main sequence to asymptotic giant branch lifetime. These last two columns are an indication of the ratio of the numbers of those kinds of stars, under the assumption of a constant formation rate.
| Collision | MS | HB | AGB | MS/HB | MS/AGB |
|---|---|---|---|---|---|
| Gyr | Gyr | Gyr | |||
| m04m04A | 14.1 | 0.095 | 0.017 | 148.8 | 846.3 |
| m04m04B | 14.1 | 0.095 | 0.017 | 148.3 | 855.2 |
| m04m04C | 14.3 | 0.097 | 0.016 | 146.6 | 906.5 |
| m04m04D | 14.4 | 0.095 | 0.016 | 150.8 | 889.7 |
| m04m04E | 14.0 | 0.097 | 0.016 | 144.3 | 883.8 |
| m04m06C | 5.73 | 0.093 | 0.016 | 61.7 | 404.8 |
| m04m06D | 5.06 | 0.094 | 0.014 | 53.6 | 343.4 |
| m04m06E | 4.40 | 0.089 | 0.015 | 49.3 | 276.2 |
| m04m08D | 0.93 | 0.093 | 0.016 | 10.0 | 65.6 |
| m04m08E | 0.60 | 0.090 | 0.014 | 6.7 | 39.8 |
| m06m06D | 2.18 | 0.092 | 0.015 | 23.7 | 146.6 |
| m06m06E | 1.81 | 0.091 | 0.015 | 19.9 | 120.5 |
| m06m08D | 0.82 | 0.096 | 0.014 | 8.5 | 56.8 |
| m06m08E | 0.13 | 0.095 | 0.014 | 1.4 | 9.7 |
| m08m08D | 0.45 | 0.124 | 0.015 | 3.6 | 30.6 |
| m08m08E | 0.06 | 0.124 | 0.020 | 0.5 | 2.8 |
| Star | MS | HB | AGB | MS/HB | MS/AGB |
|---|---|---|---|---|---|
| Gyr | Gyr | Gyr | |||
| 0.78 | 15.1 | 0.097 | 0.016 | 156.5 | 924.5 |
| 0.98 | 6.50 | 0.091 | 0.016 | 71.6 | 416.7 |
| 1.18 | 3.19 | 0.092 | 0.015 | 34.6 | 212.7 |
| 1.38 | 1.81 | 0.094 | 0.014 | 19.3 | 128.5 |
| 1.58 | 1.17 | 0.095 | 0.013 | 12.3 | 90.0 |
The main sequence lifetimes of collision products are shorter than normal stars (as seen in previous studies Sills et al. (1997, 2001)), with the lower mass parents showing a smaller effect. This has already been pointed out in the evolutionary tracks, where the main sequence extent is shorter for collision products with more evolved parents.
For all our stars, the horizontal branch lifetime was very uniform – approximately years, regardless of parent star masses or age at the time of the collision. However, the main sequence lifetimes of these stars can change by 3 orders of magnitude, so the predicted number of HB stars for every BSS depends strongly on the kinds of BSS that are seen in clusters. All our collisions that resulted from two 0.4 M⊙ stars colliding will not show up as BSS, so they can be excluded from the comparison with data. Their progeny, as well, will be indistinguishable from the normal HB stars in the cluster.
The asymptotic giant branch lifetime was equally uniform, at about years. The normal stars also have the same horizontal branch and asymptotic giant branch lifetimes as each other and as the collision products. Post-main sequence evolution of low-mass stars is extremely robust and largely independent of initial mass, structure and composition profiles.
The observed ratios of E-BSS to BSS stars are usually less than . None of the normal star models have lifetime ratios that are in this range, although the highest mass star (m=1.58 M⊙) comes closest. We can exclude the m04m04 collision models as well, both because their main sequence to horizontal branch lifetime ratio is so high, and because we could not distinguish either the main sequence or horizontal branch stars as blue stragglers observationally. Most observers restrict themselves to ‘bright’ blue stragglers when constructing this ratio, which means stars more than magnitudes brighter than the main sequence turnoff, or a difference of 0.24 in . The m04m06 collision products can fall within this range, and so it is not clear if we should be considering them in our comparison with the observations. If we do, then the average ratio of main sequence to horizontal branch lifetimes is 17.7; if we only include the m04m08, m06m06, m06m08, and m08m08 collisions, our average better matches the observations at 9.3. We note that the observational data for M80, which is of higher quality than for the other clusters, gives a BSS to E-BSS ratio of 16 (Ferraro et al., 1999). Because of the higher quality, blue straggler selection was not an issue, and so the quoted ratio is for all blue stragglers, not only the bright ones. Therefore, our calculated average of 17.7 from all our models is in remarkably good agreement.
From these lifetime ratios, we can also conclude that blue stragglers must have short main sequence lifetimes. If they behaved like normal low-mass globular cluster stars, then we would expect on the order of 100 main sequence stars for every evolved, horizontal branch phase star. Since we see BSS for every E-BSS, our calculations point to higher mass collision parents and a late time of collision. Blue stragglers should have lifetimes of Gyr to match the observed population ratios in M3, M13, and M80, in accordance with our models.
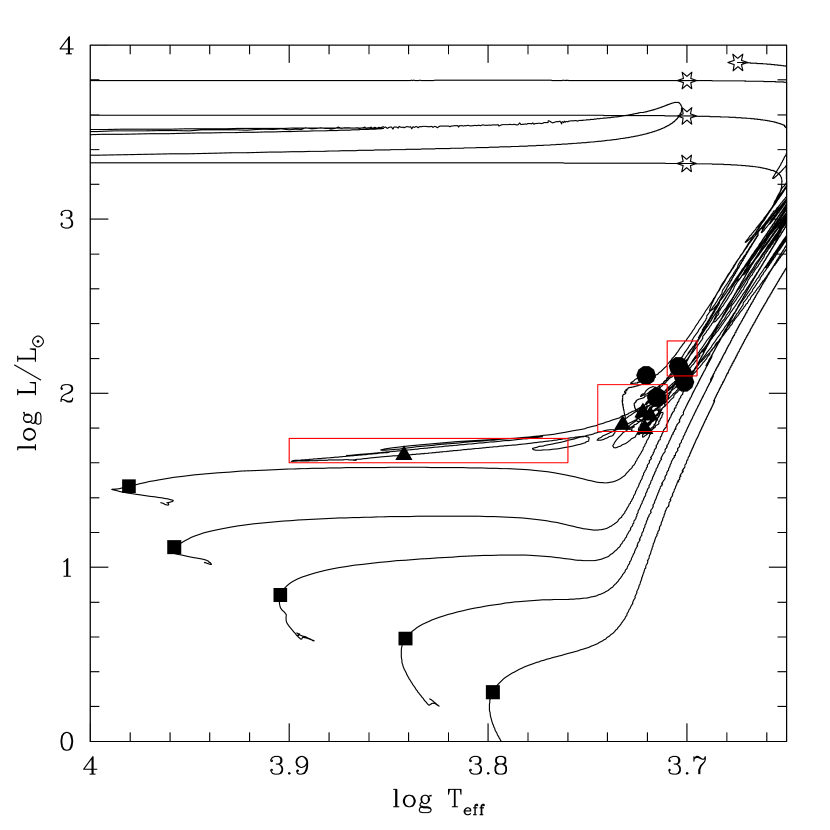
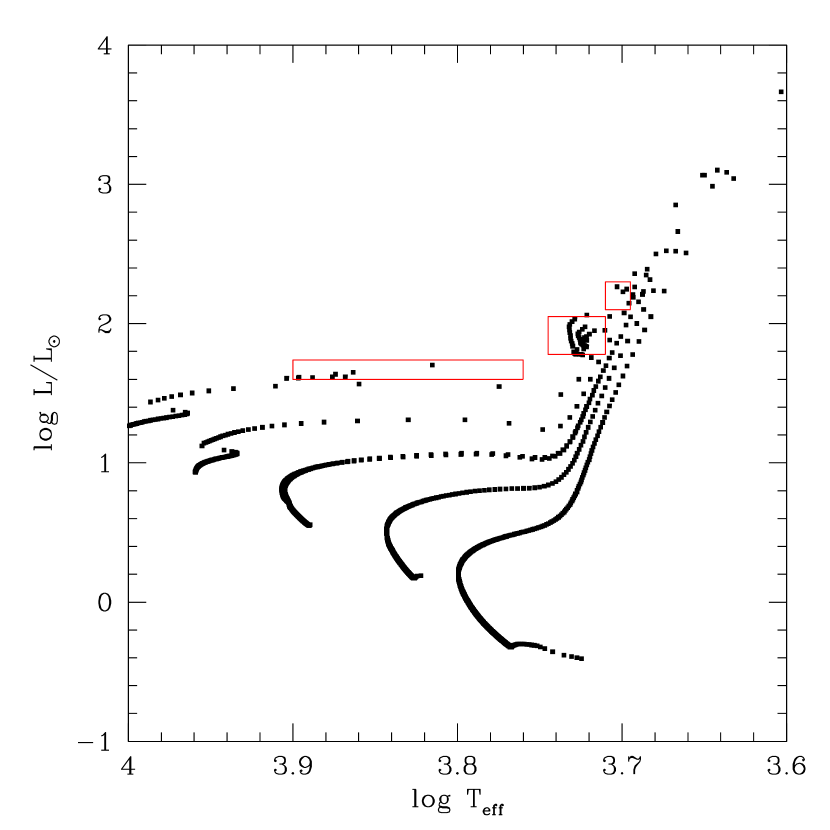
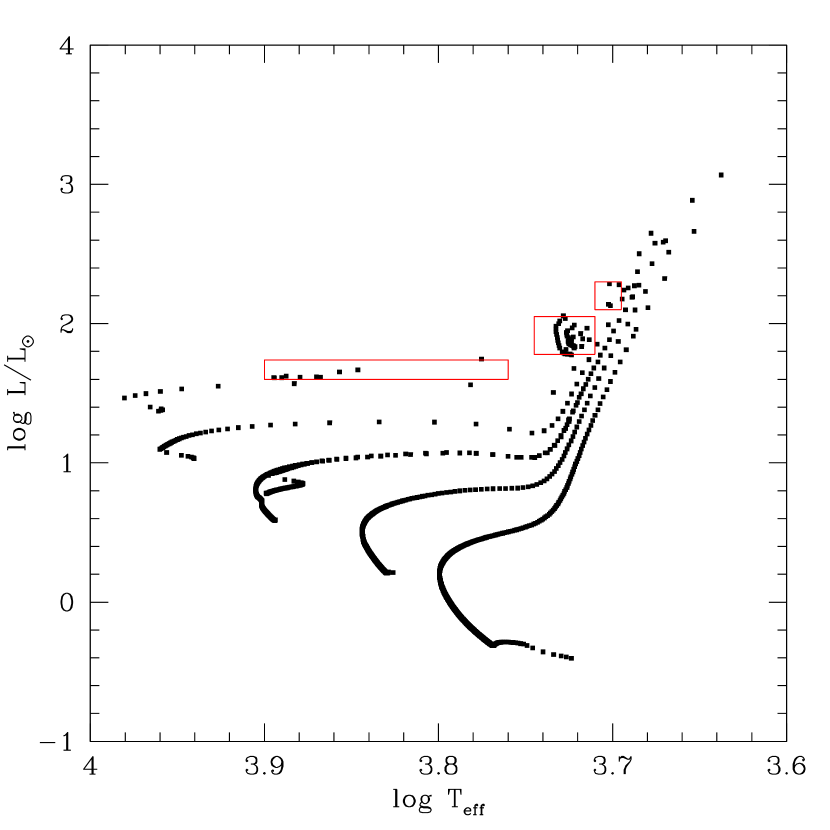
In figures 11 and 12, we show the evolutionary tracks for the collisions which occurred at times D and E, respectively. In these figures, the points are equally spaced at year intervals. By plotting the tracks in this way, it is easier to see where the stars would lie in a cluster’s CMD. The main sequence is very well populated, since it is a long-lived phase. The RGB coverage gets sparser towards the top, as the stars’ evolution speeds up. The core-helium burning phase is reasonably long lived, and then there are a scattering of points on the AGB, as expected. We see very few significant differences between these two CMDs. If we assume that blue stragglers are formed at a constant rate in clusters (at least over the past 3 Gyr), then the CMDs of real clusters should look something like these diagrams, and we will not be able to tell much about the formation rate except by looking at the bright end of the main sequence.
Clearly we have too many points on the main sequence – real clusters have a few tens to a few hundred blue stragglers per cluster, rather than the thousands of points seen in these figures. We are also showing an artificial concentrate of stars along the tracks we have chosen, when of course blue stragglers could be formed with any mass between 0.8 and 1.6 M⊙ in this scenario. However, it is interesting to note that the E-BSS stars all clump in the same region, regardless of mass. Therefore, the presence of E-BSS stars in a cluster will give us very little information about the masses of their progenitors on the main sequence, other than the fact that they are slightly more massive than the normal turnoff (greater than 1 M⊙ compared to 0.8 M⊙ in this work).
The effect of using the Vassiliadis & Wood (1993, hereafter VW93) mass loss during the AGB instead of Reimer’s results in % increases in the AGB lifetimes for some of the lower-mass collision models (e.g., m04m04A–D). This difference disappears in the more massive models, where the m06m06 and m08m08 models have essentially the same AGB lifetime regardless of the adopted mass-loss prescription. The small differences in AGB lifetimes support our conclusions that the post-main sequence evolution of E-BSS is fairly robust, with the numbers of stars on the AGB not overly dependent on input parameters such as mass loss.
The final core masses do depend on the choice of mass-loss law used during the AGB, with VW93 generally producing larger final core masses compared to the Reimer’s formula. For example, the m04m04 VW93 models had final core masses M⊙compared to M⊙for the Reimers models. The difference was largest in the m04m06 set, where the VW93 models resulted in core masses of 0.72M⊙compared to 0.58M⊙using Reimers. For the m06m08 and m08m08 sets of models the difference had essentially disappeared, with both mass-loss prescriptions giving similar core masses of 0.68M⊙, with the Reimers producing slightly larger final masses. This difference can be explained by noting that the VW93 formula gives low mass-loss rates (M⊙per year) until the pulsation period reaches 500 days, after which a superwind begins. In the models (e.g., m04m06) with the largest core masses, the superwind phase is never reached. The core keeps growing until the envelope mass is lost, as in all stars, but the timescale for envelope loss is much longer without the superwind. The final core masses can be compared to WD mass distributions for clusters (e.g., NGC 6397 Hansen et al., 2007). According to Fig. 25 from Hansen et al. (2007), core masses as high as 0.72M⊙for 1M⊙progenitors are possibly not realistic, although we note that the E-BSS will evolve somewhat differently to normal single stars. Deep observations of WD luminosity functions in globular clusters may be able to tell us something about the early blue straggler population in clusters. However, disentangling evolved blue stragglers from normal white dwarfs will be a challenge.
4. SUMMARY AND DISCUSSION
We calculated structural models of products of collisions between main sequence stars, and evolved those models along the main sequence, red giant branch, through the helium flash, on to the horizontal branch, and through the asymptotic giant branch phase.
We found that the models of evolved blue stragglers lie in the correct place in the CMD to account for the observed E-BSS stars identified by a number of groups over the past few decades. The lifetimes of these stars are consistent with the number of observed E-BSS stars compared to the number of blue straggler stars. We conclude that the stars identified as E-BSS by various authors are indeed the progeny of blue stragglers.
The ages of low-mass stars on the horizontal branch and asymptotic giant branch are independent of mass, collision history or lack thereof, and initial composition profiles. The main sequence lifetimes, on the other hand, are strongly dependent on these quantities. Therefore, the ratio of evolved to main sequence stars strongly constrains the main sequence lifetimes. Since we see approximately 10 blue stragglers for every E-BSS star, rather than the that are predicted from normal star models, we conclude that the main sequence lifetimes of blue stragglers are quite short, much shorter than their normal counterparts. This result has implications for the formation mechanisms of blue stragglers. For example, blue stragglers cannot be fully mixed on formation (which extends their main sequence lifetimes), and in fact must have very truncated lifetimes. This also has implications for determinations of formation rates. If blue stragglers are a relatively short-lived phase, they must be formed at a high rate. The observational identification of the E-BSS stars as high-mass, core-helium burning stars must be robust in order to make these inferences about blue straggler formation. Any observational work that can provide direct evidence about the properties of the E-BSS stars will be extremely helpful in this question. Also, any observations which can identify E-BSS on the AGB could potentially provide more constraints on the evolutionary status of blue stragglers, based on the models presented here.
Our results are dependent on our determinations of the main sequence and horizontal branch ages of all our models. While the main sequence ages are very robustly determined, the horizontal branch ages could depend on our treatment of the helium flash, or of the border of the convective core. However, any of these effects must be relatively small. First, our HB ages of normal stars are consistent with those found in the literature for low-metallicity stars. Secondly, the HB ages of both the normal and collisional models are very similar. Any error introduced by an incomplete treatment of the detailed stellar physics must be both small and constant across our models.
In this paper, we assumed that all blue stragglers were formed through direct stellar collisions. The alternative formation mechanism, that blue stragglers were formed through binary coalescence, may produce stars with different structures and chemical compositions. It is certainly expected that the main sequence evolution of a binary merger product will be different than that of a collision product. Post-main sequence evolution, however, is quite robust to disturbances early on the main sequence. Even for our collision products with different initial amounts of helium, or different convective structures, the post-main sequence evolution is almost identical. There are slight differences towards the end of the AGB phase and into the thermal pulses, but between the turnoff and the tip of the AGB, the tracks, and the timescales, are the same. This suggests that unless binary mergers result in a star with a significantly different structure or composition, the post-main sequence evolution will be the same as presented here. The differences in structure or composition will need to be quite extreme – for example, if a binary merger product loses a lot more mass for the same parent stars, significantly increasing the total helium content of the star. There are almost no models for blue stragglers formed during mass transfer. The only paper to address this issue in detail so far is the work of Tian et al. (2006), who look at mass transfer in systems appropriate to forming blue stragglers in the open cluster M67. While they do not compare their evolutionary tracks to normal stars, the tracks of the blue stragglers look quite normal after mass transfer ceases. Therefore, we expect that blue stragglers formed through binary coalescence will have post-main sequence evolution that is very similar to that shown in this paper, and will also populate the same position in the CMD.
On the other hand, the main sequence lifetimes of binary coalescence blue stragglers are uncertain. The total amount of helium in a binary coalescence blue straggler should be the same as that formed from a collision of the same parent stars. However, it could be distributed differently in the star, and could affect the main sequence evolution. If the lifetimes span the same range as the collision products in this paper, the number of E-BSS stars in the CMD will probably not distinguish between the different formation mechanisms, despite our greatest hopes. Further models of binary coalescence and the subsequent evolution of those blue stragglers will answer that question.
References
- Bailyn (1994) Bailyn, C. D. 1994, AJ, 107, 1073
- Bailyn & Pinsonneault (1995) Bailyn, C. D., & Pinsonneault, M. H. 1995, ApJ, 439, 705
- Blöcker (2001) Blöcker, T. 2001,Ap&SS, 275, 1
- Beccari et al. (2006) Beccari, G., Ferraro, F. R., Lanzoni, B., & Bellazzini, M. 2006, ApJ, 652, L121
- Castellani et al. (1992) Castellani, V., Chieffi, A., & Straniero, O. 1992, ApJS, 78, 517
- Charbonnel et al. (1996) Charbonnel, C., Meynet, G., Maeder, A., & Schaerer, D. 1996, A&AS, 115, 339
- Cox & Proffitt (1988) Cox, A. N., & Proffitt, C. R. 1988, ApJ, 324, 1042
- Dearborn et al. (2006) Dearborn, D. S. P., Lattanzio, J. C., & Eggleton, P. P. 2006, ApJ, 639, 405
- Ferraro et al. (1997a) Ferraro, F. R. et al. 1997, A&A, 324, 915
- Ferraro et al. (1997b) Ferraro, F. R., et al. 1997, ApJ, 484, L145
- Ferraro et al. (1999) Ferraro, F. R. et al. 1999, ApJ, 522, 923
- Frost & Lattanzio (1996) Frost, C. A. & Lattanzio, J. C. 1996, ApJ, 473, 383
- Fusi Pecci et al. (1992) Fusi Pecci, F., Ferraro, F. R., Corsi, C. E., Cacciari, C., & Buonanno, R. 1992, AJ, 104, 1831
- Guenther et al. (1992) Guenther, D. B., Demarque, P., Kim, Y.-C., & Pinsonneault, M. H. 1992, ApJ, 387, 372
- Hansen et al. (2007) Hansen, B. M. S., Anderson, J., Brewer, J., Dotter, A. , Fahlman, G. G., Hurley, J., Kalirai, J., King, I., Reitzel, D., Richer, H. B., Rich, R. M., Shara, M. M. & Stetson, P. B. 2007, ApJ, 671, 380
- Hut (1993) Hut, P. 1993, Blue Stragglers, 53, 44
- Iben (1986) Iben, I. J. 1986, Memorie della Societa Astronomica Italiana, 57, 453
- Karakas & Lattanzio (2007) Karakas, A. I. & Lattanzio, J. C. 2007, Publ. Astron. Soc. Aust., 24, 103
- Karakas et al. (2002) Karakas, A. I., Lattanzio, J. C., & Pols, O. R. 2002, Publ. Astron. Soc. Aust., 19, 515
- Lattanzio (1986) Lattanzio, J. C. 1986, ApJ, 311, 708
- Lattanzio (1991) —. 1991, ApJS, 76, 215
- Lombardi et al. (1996) Lombardi, J. C., Jr., Rasio, F. A., & Shapiro, S. L. 1996, ApJ, 468, 797
- Lombardi et al. (2002) Lombardi, J. C., Jr., Warren, J. S., Rasio, F. A., Sills, A., & Warren, A. R. 2002, ApJ, 568, 939
- McCarthy & Nemec (1997) McCarthy, J. K., & Nemec, J. M. 1997, ApJ, 482, 203
- Monkman et al. (2006) Monkman, E., Sills, A., Howell, J., Guhathakurta, P., de Angeli, F., & Beccari, G. 2006, ApJ, 650, 195
- Palla & Stahler (1991) Palla, F., & Stahler, S. W. 1991, ApJ, 375, 288
- Reimers (1975) Reimers, D. 1975, Circumstellar envelopes and mass loss of red giant stars (Problems in stellar atmospheres and envelopes.), 229–256
- Renzini & Fusi Pecci (1988) Renzini, A., & Fusi Pecci, F. 1988, ARA&A, 26, 199
- Sandage (1953) Sandage, A. R. 1953, AJ, 58, 61
- Sandquist et al. (1997) Sandquist, E. L., Bolte, M., & Hernquist, L. 1997, ApJ, 477, 335
- Schoenberner (1979) Schoenberner, D. 1979, A&A, 79, 108
- Schwarzschild & Härm (1965) Schwarzschild, M. & Härm, R. 1965, ApJ, 142, 855
- Siess (2006) Siess, L. 2006, A&A, 448, 717
- Sills et al. (1997) Sills, A., Lombardi, J. C., Jr., Bailyn, C. D., Demarque, P., Rasio, F. A., & Shapiro, S. L. 1997, ApJ, 487, 290
- Sills et al. (2000) Sills, A., Bailyn, C. D., Edmonds, P. D., & Gilliland, R. L. 2000, ApJ, 535, 298
- Sills et al. (2001) Sills, A., Faber, J. A., Lombardi, J. C., Jr., Rasio, F. A., & Warren, A. R. 2001, ApJ, 548, 323
- Stancliffe et al. (2005) Stancliffe, R. J., Izzard, R. G., & Tout, C. A. 2005, MNRAS, 356, L1
- Straniero et al. (1997) Straniero, O., Chieffi, A., Limongi, M., Busso, M., Gallino, R., & Arlandini, C. 1997, ApJ, 478, 332
- Tian et al. (2006) Tian, B., Deng, L., Han, Z., & Zhang, X. B. 2006, A&A, 455, 247
- Vassiliadis & Wood (1993) Vassiliadis, E. & Wood, P. R. 1993, ApJ, 413, 641
- Zinn & King (1982) Zinn, R., & King, C. R. 1982, ApJ, 262, 700
- Zinn & Searle (1976) Zinn, R., & Searle, L. 1976, ApJ, 209, 734