High-Temperature Superconducting Level Meter for Liquid Argon Detectors
Abstract
Capacitive devices are customarily used as probes to measure the level of noble liquids in detectors operated for neutrino studies and dark matter searches. In this work we describe the use of a high-temperature superconducting material as an alternative to control the level of a cryogenic noble liquid. Lab measurements indicate that the superconductor shows a linear behaviour, a high degree of stability and offers a very accurate determination of the liquid volume. This device is therefore a competitive instrument and shows several advantages over conventional level meters.
keywords:
Cryogenic detectors; Superconductive detectors; Control and monitor systems on-line1 Introduction
Research on fundamental physics can largely benefit from the use of instruments based on noble liquids, since they show several appealing features as detecting medium Doke . In fact, during the last years we have witnessed an increase on the interest and use of devices having liquefied noble gases as their sensitive material Fabjan . This innovative technique has a wide scope of application that spans from calorimeters for collider physics D0 ; H1 ; LHC to TPCs used for the study of neutrino properties t600 or direct dark matter searches Gaitskell ; WARP ; ArDM . To guarantee optimal and well-controlled running conditions, these detectors must be complemented with auxiliary instrumentation to gauge the temperature, pressure, purity and level of the liquid book1 ; book2 . Accurate measurements of the liquid height can be accomplished using different sorts of level meters Sawada ; Bruschi . Following the work done in Arkharov , we propose the use of a high-temperature superconducting material (SC) as an alternative to measure the level of a detector filled with liquid argon. The SC we have tested cannot be used in detectors that use xenon as the sensitive material, given the higher boiling point of this noble gas. For neon detectors a different sort of SC must be used to monitor the level.
In the following sections we describe the experimental setup, the performance of the level meter and the advantages it shows with respect to devices previously discussed in the literature.
2 Experimental setup
In Figure 1 we show the different elements of the experimental setup. They are:
- Cryostat
-
We use a vacuum-insulated AGIL-2 from Air Liquide AirL as external vessel. It is a cylindrical two-liter stainless-steel dewar, whose top is closed by a cork lid. Once the 9 cm vessel is filled with liquid nitrogen, the measured evaporation rate, mainly through the porous cork, amounts to 10 mm/hour. This is small enough to perform long time data-taking runs. However the fact that the top lid does not guarantee an optimal thermal insulation from the outside represents a clear disadvantage. In Section 3, we show that as the liquid nitrogen evaporates, the gradient of temperatures between the liquid surface and the top of the dewar is high enough to alter the behaviour of the SC. This spoils the accuracy of the level measurement in case long ( 3 cm) SC are used. This unwanted effect will be sensibly reduced in case a cryostat with a better thermal insulation is used us .
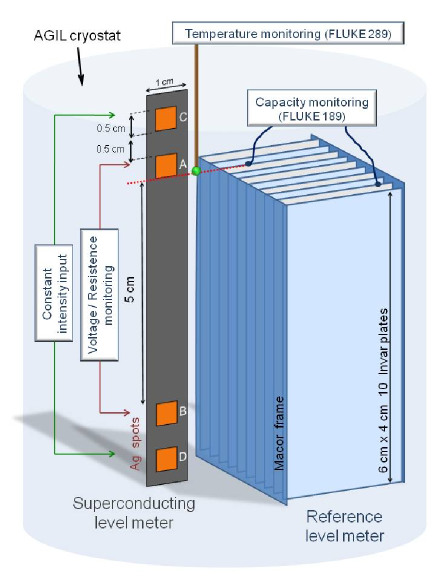
Figure 1: Schematic drawing of the setup used for the superconductor (SC) characterization. The reference capacity level meter, the temperature probe and the superconductor are aligned together at the level of the dotted line and immersed in a liquid nitrogen bath. The SC data are obtained by measuring between points A and B the resistance or the voltage. This last measurement requires the input of an external current. - The Coated Conductor
-
The superconducting level meter is a flexible THEVA DyBCO-tape THEVA . This coated conductor (CC) shows a layered structure (see top panel of Figure 2). The main substrate is made of a thin (90 microns thick) high-strength Hastelloy C 276 steel tape. A double MgO layer follows. The first one is an orientation layer deposited by inclined substrate deposition with a thickness of 3.7 microns; the second one is a high temperature cap layer of 0.3 microns. A 1.6 micron superconducting DyBCO layer is finally deposited by electron beam evaporation.
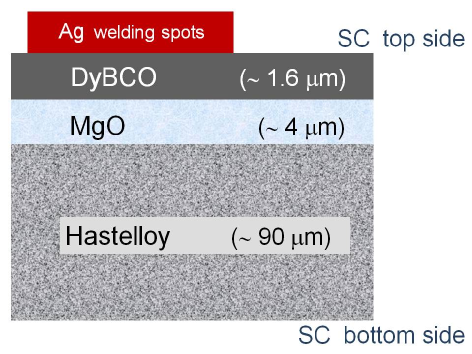
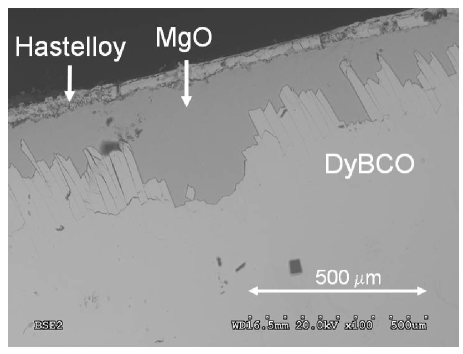
Figure 2: Top: Scheme of the coated conductor composition (Hastelloy tape substrate, MgO buffered tape and superconducting DyBCO layer -SC-). Some silver spots on top of it were added to allow copper cable welding for signal readout. Bottom: Magnified picture of a coated conductor sample taken with the Scanning Electron Microscope SEM/EDS technique. The light grey region corresponds to the DyBCO layer whereas the dark grey part below it is the MgO substrate. 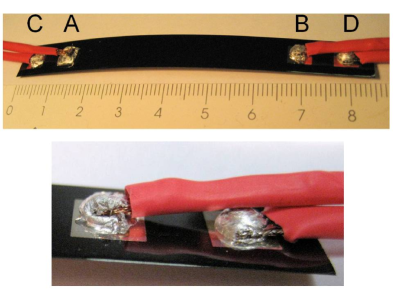
Figure 3: Top: Picture of a finished DyBCO coated conductor ready for testing. The two external copper cables are connected to a stable current source ensuring a constant intensity flux. The two internal ones are used for voltage readout or a direct measurement of the resistance. Bottom: Detail of the copper–indium–silver soldered joints. We have tested six SC level meters. Each of them is a stripe 8.5 cm long and 1 cm width (see top of Figure 3). From the mechanical point of view, this device is simpler than the capacitive level meter used as reference (see below). We have analyzed the chemical composition and spatial uniformity of the SC using a Scanning Electron Microscope (HITACHI S-3000N) coupled to an Energy Dispersive X-Ray Spectrometer (BRUKER XFlash 3001). The idea was to look for irregularities, fractures or any other sort of damage that could cause a potential failure of the SC. This scanning technique allows to examine and analyze samples at magnifications up to 300,000. The picture shown in the bottom panel of Figure 2 was taken from the top of the level meter and close to one of the borders. It covers an area of about 1 mm2. The three CC layers are clearly visible. Figure 4 shows an example of line scan analysis done on the superconducting surface. A chemical study of the substance reveals that, as expected, the Dy-Ba-Cu-O lines are dominant. The high magnification surface topography taken along the surfaces of the six manufactured SC level meters revealed a good uniformity in chemical composition and the absence of irregularities or fractures in the micro-structure.
To assess its performance, the SC level meter is carefully aligned to a multi-parallel-plate capacitor (previously calibrated and used as reference level meter) and a temperature probe. Those elements are immersed in a liquid nitrogen (LN2) bath ( -195 ∘C). The level of liquid nitrogen is inferred from the resistance value RSC of the SC layer, which increases when the LN2 level decreases. This requires two electrical connections on the SC (A and B in Figure 3) in case a multimeter is used to directly read RSC, and two more connections if it is obtained from the ratio of the measured voltage when a constant current runs between pins C and D. In the latter case, the SC is fed by a power supply (CPX200 from TTi TTI ). To guarantee an optimal and stable electrical contact between the measurement instruments and the superconducting layer, four 0.50.5 cm2 silver coated squares were deposited at symmetric positions on the SC edges (see bottom of Figure 3). Copper cables were finally soldered to the silver surface using indium (silver doped at 3).
All our tests have been performed using liquid nitrogen (boiling point: 77 K). The SC still retains its superconducting nature at temperatures as high as the argon boiling point (87 K). Therefore similar results will be obtained in case we use liquid argon. Moreover, the stripes appear to be robust and suitable for use in cryogenic detectors since we observed that the SC structure was unaltered after being operated in subsequent cycles of extreme temperature changes.
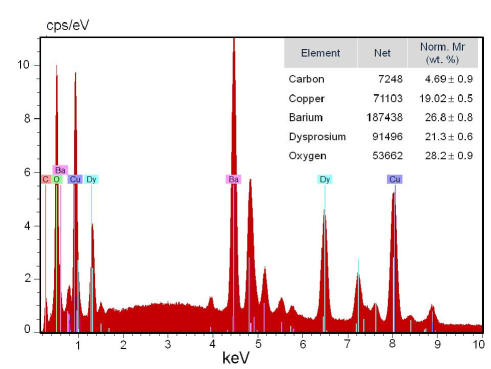
Figure 4: Line scan on the CC DyBCO surface.The counting rate per element and the corresponding relative abundance normalized to the molecular weight are shown. - Reference level meter
-
The level of liquid nitrogen inside the dewar is continuously monitored with a capacitive level meter Laffranchi . This custom-made device is a multi-parallel-plate capacitor composed of 10 Invar plates 40 mm (wide) 60 mm (high) and 1 mm thick (see Figure 5). The plates, spaced by 1.4 mm, are glued to a Macor supporting structure. They work as anode and cathode alternatively. The chosen structure aims at decreasing the errors in level measurement by increasing the capacitance signal. Since the dielectric constant of the liquid ( = 1.434) and gas (can be considered as 1) are different, the capacity changes linearly as a function of the area immersed inside the liquid (see top Figure 9).
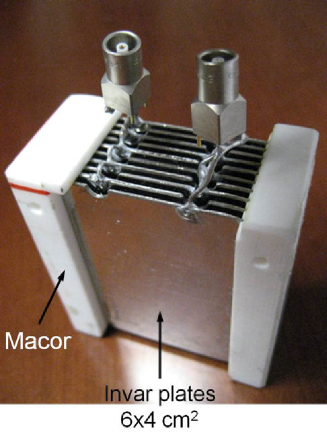
Figure 5: Picture of the reference multi-parallel-plate capacity level meter. The Invar plates (alternately connected) are supported by a Macor frame. The level meter is connected to a FLUKE 189 FLUKE multimeter to measure the capacity in intervals of five seconds. The capacity variation from initial conditions (level meter fully immersed in liquid nitrogen) to the final state (level meter in air) amounts to 441 pF. Combining the data from several runs, we obtain an average precision for the level measurement of 35050 microns Carmen .
- Sensors and data readout
-
Temperature variations inside the cryostat were monitored with a FLUKE 289 multimeter which uses a 80BK Integrated DMM Temperature Probe. This Type-K probe allows to measure temperatures down to -200 ∘C with 0.1 ∘C resolution. A second FLUKE 189 digital multimeter allows to measure the SC resistance and the levelmeter capacity, as well. A KEITHLEY electrometer (mod. 6514 Keithley ) measures the voltage between the SC pins while the external power supply is on. All these data are stored in a hard drive. Off-line analyses will allow to obtain the resistance of the SC in two different ways (see next Section).
3 Measurements and results
The working principle of the SC level meter is well known: While immersed in liquid nitrogen, the coated conductor retains its superconducting nature. As soon as it goes above -183.0 0.5 ∘C, the resistance increases causing the loss of the superconducting properties. Therefore a measurement of the SC resistance can be translated into a measurement of the liquid level inside the vessel. In this work, the SC resistance is measured using two different approaches:
-
•
Digital Multimeter (DM) mode: the digital multimeter is connected to the internal A–B pins and the resistance RAB read directly (0.001 resolution).
-
•
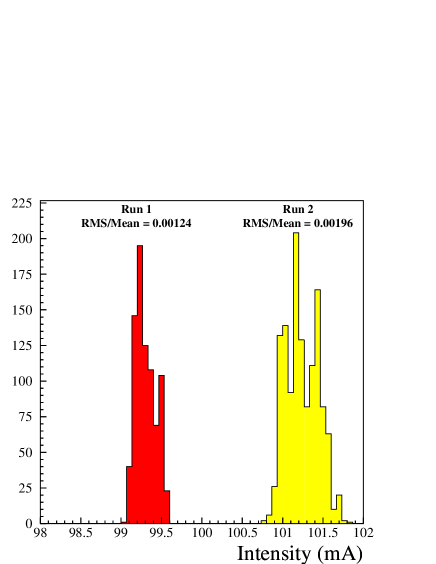
External Current (EC) mode: an external power supply is connected to pins C–D so that a constant current (ICD) runs through the SC layer. The voltage between pins A–B (VAB) is measured with an electrometer and the effective resistance computed (VAB/ICD). Measurements were taken for three different values of the current: 10, 50 and 100 mA. The measured ICD was stable with fluctuations below the 2 per mil level (see Figure 6). For a current of 50 mA, we observed a maximum resistance of 4 at the end of each data taking period.
The calibration of the SC level meter (namely, the conversion of the measured SC resistance into units of length) is done by means of a reference level meter. We believe this is a necessary step to be done prior to the installation of the SC in its final location. These two elements, together with a temperature probe, are carefully aligned (dotted line in Figure 1) and fixed to a frame to avoid displacements during the measurement. The three devices are read continuously in time slots of 5 seconds. Typical runs extend for about 10 hours, the time needed to evaporate a 9 cm column of liquid nitrogen.
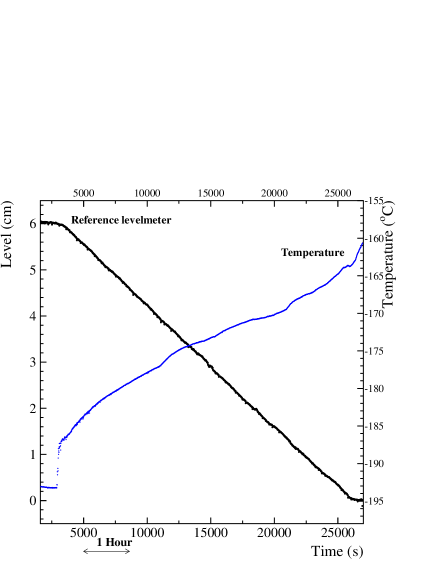
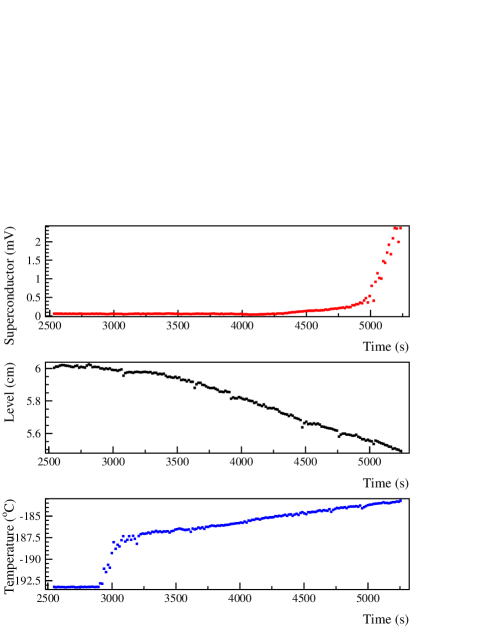
The behaviour of the reference capacitive level meter is well understood (see Figure 7): it shows two flat regions corresponding to the fully immersed condition (leftmost part of the time axis) and dry state (rightmost part of the abscissa). The central region corresponds to the liquid nitrogen evaporation phase. The change in capacity is linear, thus providing a direct, stable and precise indication of the liquid level.
The temperature probe also shows a smooth behaviour, increasing from -194 ∘C to -160 ∘C. The increased rate at high temperature (about 5.7 ∘C/cm) and the observed fluctuations with time are due to the poor thermal insulation offered by the cork lid.
The characterization of the six manufactured SC level meters was carried out immersing each of them tens of times in liquid nitrogen. Figure 8 shows a zoom of the top region of the experimental setup. The upper panel corresponds to the SC level meter. Its resistance remains stable and very low (0.18 ) while fully immersed in the liquid. It suddenly increases as the SC zone below pin A dries and warms up above the minimum superconductivity temperature. The delay with respect to the behaviour of the reference level meter has to do with the gradient of temperatures above the surface of the liquid nitrogen. The SC resistance only changes once its temperature is above -183 ∘C. From the average of several measurements the offset among the two level meters amounts to 3.90.3 mm. How the offset depends on the temperature gradient is being investigated and will be reported elsewhere us .
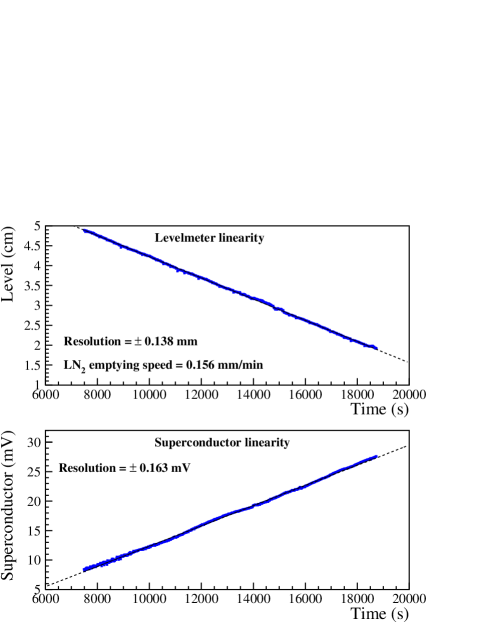
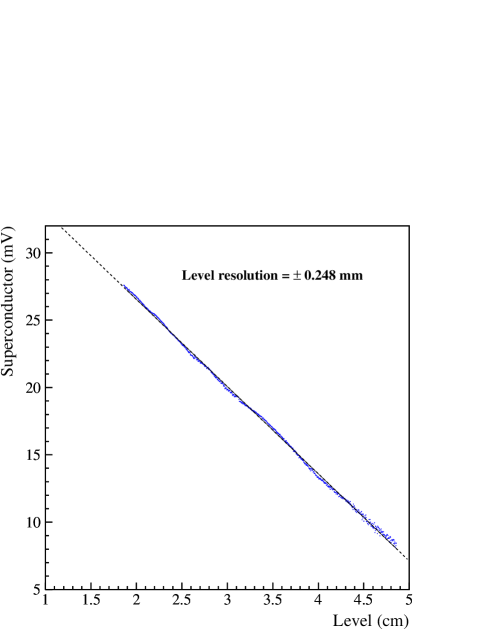
Figure 9 shows how the resistance of the SC level meter increases linearly for a long period of time (4 h). In our range of interest, the measured resistance grows up to 0.5 . The capacitive level meter shows a similar behaviour. The combination of the data from the two level meters allows to obtain a calibration for the SC (see Figure 10). The root mean square (RMS) from the line fit to the data gives the precision for the level measurement. For the run depicted in the figure it amounts to approximately 250 m.
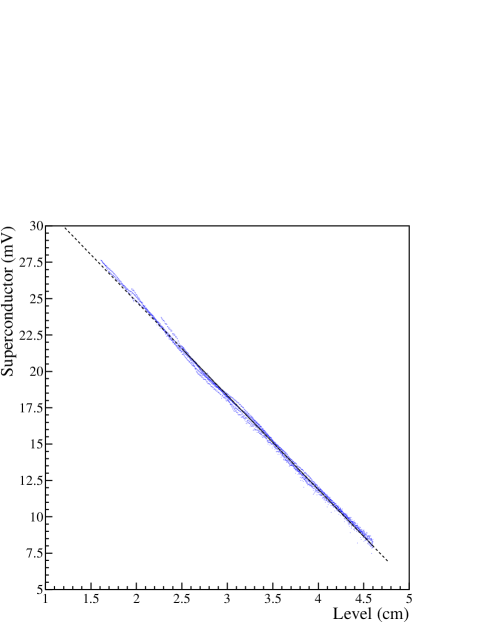
Run by run the reproducibility is good as can be seen from Figure 11. However when the gradient of temperatures inside the dewar is very high, the linear behaviour is lost. This seriously limits the range of applicability of our measurements. The poor thermal insulation forces us to restrict ourselves to just one third of the total length of the SC level meter. We hope that optimized experimental conditions will allow the use of longer SC level meters.
Despite the problems introduced by the high gradients of temperatures we have found, our results are encouraging. Restricting ourselves to a length of up to 2.5 cm, the outcomes are similar regardless of the sort of measurement performed (either DM or EC mode). For the EC mode, the computed resolutions do not exhibit a strong dependence with the intensity of the input current, as can be seen from Table 1, where we show the expected resolutions for data taken in DM mode and three different intensities (10, 50 and 100 mA) for the EC mode. The resolution is taken as the RMS from the line fit done to all the runs corresponding to a particular mode of measurement. The expected resolutions go from 280 m up to 370 m, and therefore are similar to the ones obtained with the capacitive level meter.
| Measurement | Resolution (m) |
|---|---|
| DM mode | 300 |
| EC mode (= 10 mA) | 370 |
| EC mode (= 50 mA) | 280 |
| EC mode (= 100 mA) | 365 |
4 Conclusions
We have shown that superconducting materials are a promising alternative to standard capacitive devices used to measure the level of cryogenic liquids. With a simple experimental setup, we have observed that the SC level meter is stable and linear in the range of a few centimeters. The measurements show a good reproducibility and the estimated precision is below 0.5 mm. We are confident that longer level meters will behave linearly when tested under conditions with better thermal insulation. Compared to capacitive level meters, superconducting ones have several advantages: they are cheaper, mechanically easier to mount and very simple electronics is needed to read them out.
5 Acknowledgments
This work has been carried out under the auspices of the Spanish Ministry of Education & Science (Grant FPA2006-00684). The study of the SC composition has been carried out thanks to the invaluable help provided by Agustín Bueno (U. Alicante). We thank A. Delgado (U. Granada) for useful discussions about superconductors.
References
- (1) T. Doke, 1981 Fundamental properties of liquid argon, krypton and xenon as radiation media Portugal Phys. 12 9.
- (2) M. Aleksa and C.W. Fabjan, Fundamental Physics with Noble Liquid Detectors presented at the 15th IEEE International Conference on Dielectric Liquids, Coimbra, Portugal; June 2005.
- (3) S. Abachi et al., 1994 The D0 detector Nucl. Instrum. Meth. A338 185.
- (4) B. Andrieu et al., 1993 The H1 liquid argon calorimeter system Nucl. Instrum. Meth. A336 460.
- (5) ATLAS LAr Collaboration, 1996 LAr Technical Design Report CERN-LHCC-96-041.
- (6) S. Amerio et al., 2004 Design, construction and tests of the ICARUS T600 detector Nucl. Instrum. Meth. A527 329.
- (7) R J Gaitskell, 2004 Direct detection of dark matter Ann. Rev. Nucl. Part. Sci. 54 315.
- (8) R Brunetti et al., 2005 WARP liquid Argon detector for dark matter survey New Astron. Review 49 265.
- (9) M Messina et al., A Status report of ArDM project presented at the 9th ICATPP Conference on Astroparticle, Particle, Space Physcis, Detectors and Medical Physics Applications, Como, Italy; Oct 2005.
- (10) G.K. White and P. Meeson, 2002 Experimental Techniques in Low-Temperature Physics, 4th Edition, Oxford University Press, New York.
- (11) F. Pobell, 2007 Matter and Methods at Low Temperatures, 3rd Edition, Springer-Verlag, Berlin.
- (12) R. Sawada et al., 2003 Capacitive level meter for liquid rare gases Cryogenics 43 449.
- (13) L. Bruschi, G. Delfitto and G. Mistura, 1999 Level meter for dielectric liquids Rev. Sci. Instrum. 70 1514.
- (14) I.A. Arkharov and V.Yu. Emel’yanov, 2000 High-Temperature superconducting level gauge for cryogenic liquid Chem. Petrol. Eng. 36 542.
- (15) AIR LIQUIDE, http://www.airliquide.com \hrefhttp://www.airliquide.com
- (16) The construction of a 50 liter cryostat, whose metal top lid is sealed to reduce to a minimum the heat transfer, is under way. It will be used to check, in optimal experimental conditions, the behaviour of long SC when immersed in liquid Argon. Results will be reported elsewhere.
- (17) THEVA, http://www.theva.com \hrefhttp://www.theva.com
- (18) Thurlby Thandar Instruments, http://www.tti-test.com \hrefhttp://www.tti-test.com
- (19) M. Laffranchi, 2005 Test of a Liquid Argon Time Projection Chamber in a Magnetic Field \hrefhttp://neutrino.ethz.ch/diplomathesis.html PhD. Thesis Diss. ETH No. 16002.
- (20) FLUKE, http://www.fluke.com \hrefhttp://www.fluke.com
- (21) M.C. Carmona, 2008 PhD. Thesis, University of Granada.
- (22) KEITHLEY, http://www.keithley.com \hrefhttp://www.keithley.com