Shubnikov-de Haas oscillations spectrum of the strongly correlated quasi-2D organic metal (ET)8[Hg4Cl12(C6H5Br)]2 under pressure.
Abstract
Pressure dependence of the Shubnikov-de Haas (SdH) oscillations spectra of the quasi-two dimensional organic metal (ET)8[Hg4Cl12(C6H5Br)]2 have been studied up to 1.1 GPa in pulsed magnetic fields of up to 54 T. According to band structure calculations, its Fermi surface can be regarded as a network of compensated orbits. The SdH spectra exhibit many Fourier components typical of such a network, most of them being forbidden in the framework of the semiclassical model. Their amplitude remains large in all the pressure range studied which likely rules out chemical potential oscillation as a dominant contribution to their origin, in agreement with recent calculations relevant to compensated Fermi liquids. In addition to a strong decrease of the magnetic breakdown field and effective masses, the latter being likely due to a reduction of the strength of electron correlations, a sizeable increase of the scattering rate is observed as the applied pressure increases. This latter point, which is at variance with data of most charge transfer salts is discussed in connection with pressure-induced features of the temperature dependence of the zero-field interlayer resistance.
pacs:
71.18.+yFermi surface: calculations and measurements; effective mass, g factor and 71.20.Rv Polymers and organic compounds and 72.15.GdGalvanomagnetic and other magnetotransport effects1 Introduction
Quantum oscillations spectra of quasi-two-dimensional (q-2D) multiband metals are known to contain many Fourier components. In addition to those that can be attributed to closed orbits, eventually induced by magnetic breakdown (MB), linear combinations of few basic frequencies that are not predicted by the semiclassical model Fa66 (1, 2) can nevertheless be observed. This frequency mixing phenomenon can be linked to both the q-2D nature of the dispersion relation which is liable to give rise to a field-dependent oscillation of the chemical potential mu (3) and to the Fermi surface (FS) topology that can be regarded as a network of orbits coupled by MB LLB (4). Despite both theoretical and experimental efforts, the latter being mainly focused on organic metals based on the ET molecule (where ET stands for bisethylenedithia-tetrathiofulvalene) with the FS originating from the hybridization of one orbit with an area equal to that of the first Brillouin zone (FBZ), quantitative interpretation of the data is still an open problem.
Networks of orbits can also result from the hybridization of two or more pairs of q-1D sheets as it is the case of the room temperature FS of numerous oxide bronzes. However hidden nesting properties Wh89 (5) lead to the condensation of a charge density wave which strongly modifies the FS at low temperature in most cases. As a result, quantum oscillations spectra observed e. g. in monophosphate tungsten bronzes Be00 (6) can hardly be reconciled with band structure calculations Fo02 (7). Analogous problematic can be observed in the q-2D organic metal ”-(ET)(TCNQ) Ya (8).
On the contrary, although the FS of the q-2D charge transfer salt (ET)8Hg4Cl12(C6H5Cl), noted hereafter as (Cl, Cl), originates from the hybridization of two pairs of q-1D sheets as well, it remains metallic down to the lowest temperatures. According to band structure calculations Ve94 (9), its FS is composed of two compensated orbits labelled in the following with an area of 13 % of the FBZ area. Shubnikov-de Haas (SdH) oscillations spectra of this compound Pr02 (10), which otherwise exhibit many frequency combinations, as discussed below, are in good agreement with this picture since the main Fourier component has a frequency Fa = 241.5 2 T that corresponds to 11 % of the FBZ area. This is also the case of the isostructural compound (ET)8[Hg4Cl12(C6H5Br)]2, noted hereafter as (Cl, Br), which has been even more extensively studied at high magnetic field Vi03 (11, 12) although its FS has not been reported up to now.
With respect to the interpretation of frequency combinations, applied pressure can be useful in order to tune both the transverse interactions (which are involved in the chemical potential oscillations) Ki02 (13) and the MB gaps. In a first step, band structure calculations of the (Cl, Br) compound at ambient pressure are reported which confirm that its FS can be regarded as a network of compensated orbits. In a second step, the temperature dependence of the interlayer resistance under pressure is considered. Finally, the pressure-induced change of the SdH oscillations spectrum, MB field, effective masses and scattering rate is investigated up to 1.1 GPa.
2 Experimental
The studied crystals were prepared by the electrochemical method reported in Ly91 (14). Tight binding band structure calculations, based on X-ray data collected at room temperature and ambient pressure, were performed using the same method as reported in Ve94 (9). The calculations use an extended Hückel effective one-electron Hamiltonian Wh78 (15). The off-diagonal matrix elements of the Hamiltonian were calculated according to the modified Wolfsberg-Helmholz formula Am78 (16). All valence electrons were explicitly taken into account in the calculations and the basis set consisted of double- Slater-type orbitals for all atoms, except hydrogen.
Interlayer zero-field resistance and magnetoresistance measurements were performed on crystals with approximate dimensions 0.50.50.1 mm3. Electrical contacts to the crystal were made using annealed platinum wires of 20 m in diameter glued with graphite paste. Alternating current (1 A, 77 Hz) and (5 to 10 A, 20 kHz) was injected parallel to the a* direction for measurements of the interlayer zero-field resistance and magnetoresistance, respectively. Hydrostatic pressure was applied up to 1.1 GPa in an anvil cell designed for isothermal measurements in pulsed magnetic fields Na01 (17). In the following, the pressure applied at room temperature is considered although a slight crystal size-dependent pressure loss on cooling cannot be excluded Vi06 (18). Magnetoresistance experiments were performed up to 54 T in pulsed magnetic field with pulse decay duration of 0.36 s, in the temperature range from 1.5 K to 4.2 K. Magnetic field was applied normal to the conducting (bc) plane. A lock-in amplifier with a time constant of 30 s was used to detect the signal across the potential contacts. Analysis of the oscillatory magnetoresistance is based on discrete Fourier transforms of the data, calculated with a Blackman window.
3 Results and discussion
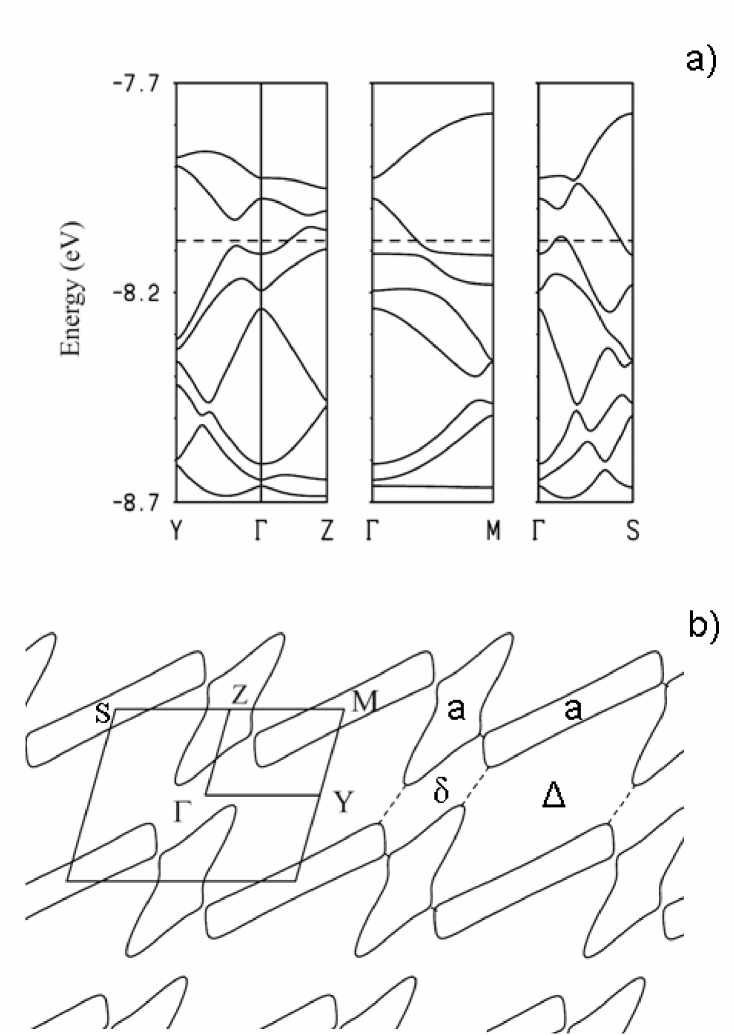
The band structure calculations and FS of the (Cl, Br) compound displayed in Fig. 1 are based on crystallographic data recorded at ambient pressure and room temperature. The repeat unit of the donor layer contains 8 ET molecules so that the band structure of Fig. 1a contains 8 bands mainly based on the highest occupied molecular orbitals of ET. With the usual oxidation states of Cl- and Hg2+, the average charge of the ET donors is +1/2. Consequently, two bands in Fig. 1a should be formally empty. Since the second and third bands from the top overlap, the system must be metallic and its FS must contain both electron and hole contributions with the same area. More precisely, as it is the case for (Cl, Cl) Ve94 (9), the FS (see Fig. 1b) originates from two pairs of crossing q-1D sheets and constitutes a network of compensated electron (around M) and hole (around Z) closed orbits elongated along the and directions, respectively. These orbits are both labelled a hereafter since they have the same area. Both the band structure and FS of Fig. 1 are very similar to those previously reported for the (Cl, Cl) compound Ve94 (9). For instance whereas the area of the closed orbits of the (Cl, Br) compound is 16.1 % of the FBZ area, according to data in Fig. 1, calculations for (Cl, Cl) using the same computational details as in the present case lead to an area of 16.7 % of the FBZ area. Although this is not surprising since the two compounds are isostructural, these results justify a posteriori the previous data analysis based on a FS topology analogous to that of the (Cl, Cl) compound Vi03 (11, 12, 19). Let us note that similar calculations led to a more substantial variation of the orbits area for the (Br, Cl) compound (9.6 % of the FBZ area). This suggests that replacement of Br by Cl in the anion layer has a considerably stronger effect on the FS than the same replacement in the solvent molecules. The small difference in orbits area between the (Cl, Br) and (Cl, Cl) compounds is in agreement with the experimental results. Nevertheless, a slight discrepancy between calculations and quantum oscillations spectra can be observed since the closed orbits area of (Cl, Br) amounts to 16.1 and 11 of the FBZ area in the former and latter cases, respectively.
Zero-field interlayer resistance and magnetotransport were studied on three crystals. Since they yield consistent results, we concentrate on the most extensively studied one in the following. It should be noted that all the features reported hereafter are reversible as the pressure is released.
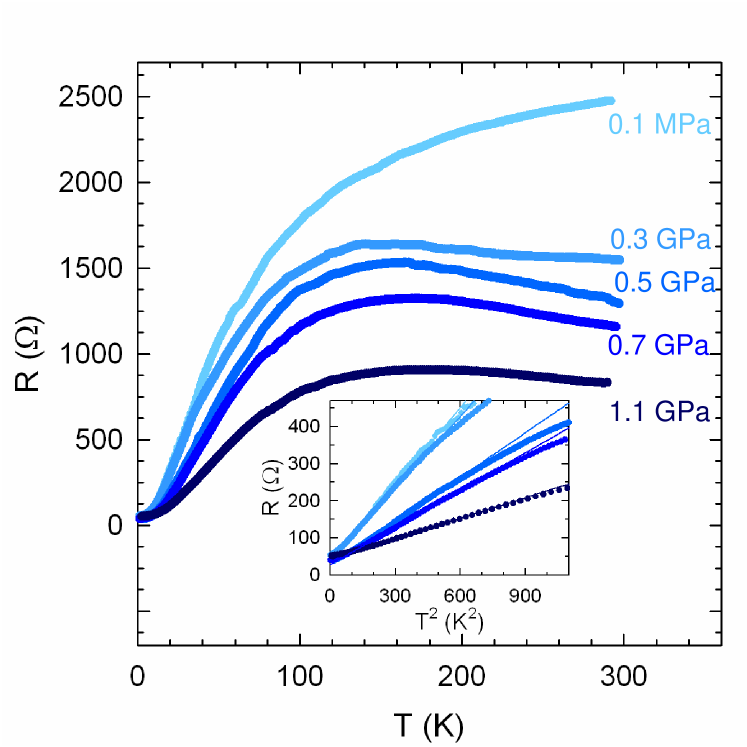
Temperature dependence of the zero-field interlayer resistance at various applied pressures is displayed in Fig. 2. The room temperature resistance decreases as the pressure increases (dlnR/dP = -1 GPa-1) while the low temperature value remains almost unaffected. As a result, the residual resistivity ratio (RRR) decreases monotonously by about a factor of 3 as the pressure increases up to 1.1 GPa. Whereas the resistance continuously decreases as the temperature decreases at ambient pressure, a resistance maximum is observed under pressure, the amplitude of which is maximum around 0.5 GPa. Data under pressure share similarities with the sample-dependent zero-field interlayer resistance of the high-resistance variant of -(ET)2Cu[N(CN)2]Br whose resistance increases as the temperature decreases down to about 100 K and strongly decreases at lower temperatures St05 (20). A similar temperature dependence is also observed for other charge transfer salts such as -(ET)2Cu(NCS)2 UrMu (21) or -(ET)2Cu[N(CN)2]Cl Li03 (22). As reported in Ref. St99 (23), the resistance maximum observed in -(ET)2Cu[N(CN)2]Br is certainly related to disorder and possibly to point defects. Indeed, due to a decrease of the Dingle temperature, the SdH oscillations amplitude increases as the amplitude of the resistance maximum decreases. It should be noted that the effect of pressure on the zero-field transport properties of this compound is at variance with that of Fig. 2 since the amplitude of the resistance maximum decreases continuously as the applied pressure increases in the former case. In other words, data in zero-field could suggest that, even though the scattering rate in -(ET)2Cu[N(CN)2]Br decreases under pressure, it increases in the case of the (Cl, Br) compound, at least up to 0.5 GPa. Oppositely, X-ray irradiation of -(ET)2Cu(NCS)2 lead to a decrease of the resistance maximum amplitude An06 (24). However, as far as -(ET)2Cu[N(CN)2]Cl is concerned, this behaviour is due to a significant irradiation-induced increase of the carrier concentration Sa08 (25) that cannot hold in our case. It should be also mentioned that a coherent-incoherent crossover of small polarons, driven by the strength of the electron-phonon coupling, can also lead to interlayer resistance maximum Lu03 (26, 27). Alternatively, electron correlations have been invoked in order to account for such resistance behaviour Li03 (22, 28). As a matter of fact, a T2 variation of the resistance (R = R0 + AT2) is observed at low temperature (see the inset of Fig. 2). Owing to the crystal dimensions, A ranges from 0.2 cmK-2 at ambient pressure to 0.05 cmK-2 at 1.1 GPa. Such a behaviour which is commonly observed both in charge transfer salts St05 (20, 22) and inorganic low dimensional compounds such as Sr2RuO4 Ma97 (29) is currently regarded as the signature of a strongly correlated Fermi liquid. This latter point and the above statement regarding the pressure dependence of the scattering rate are further discussed at the light of the magnetoresistance data reported hereafter.
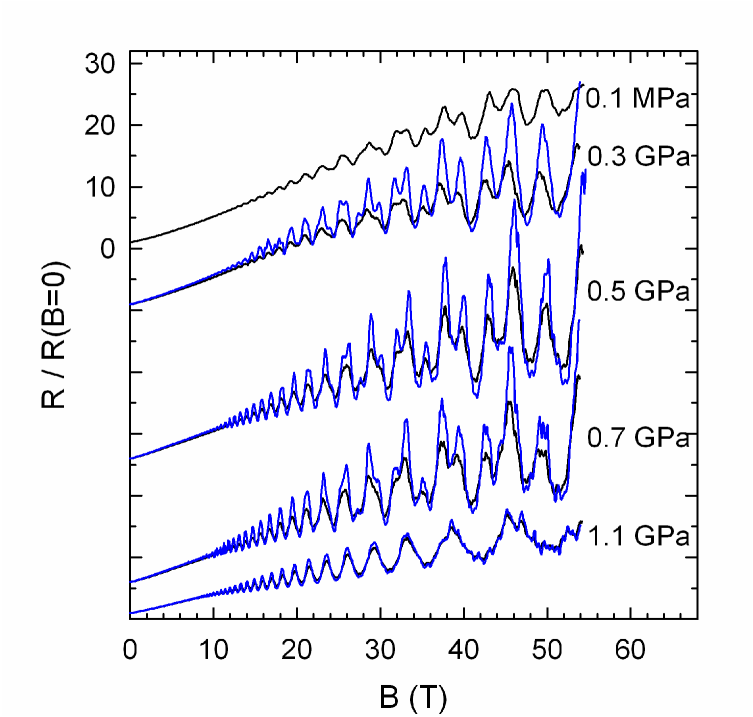
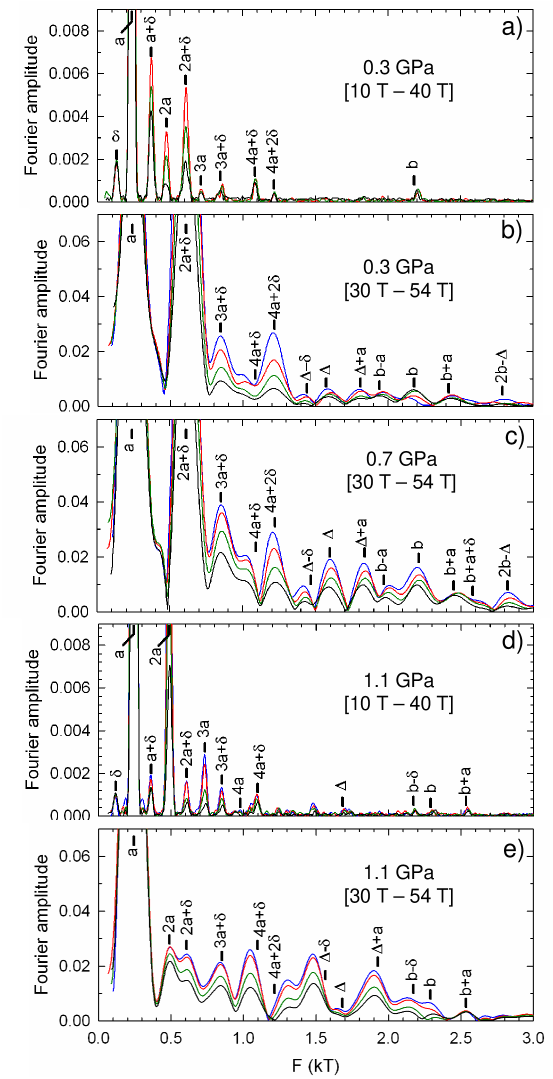
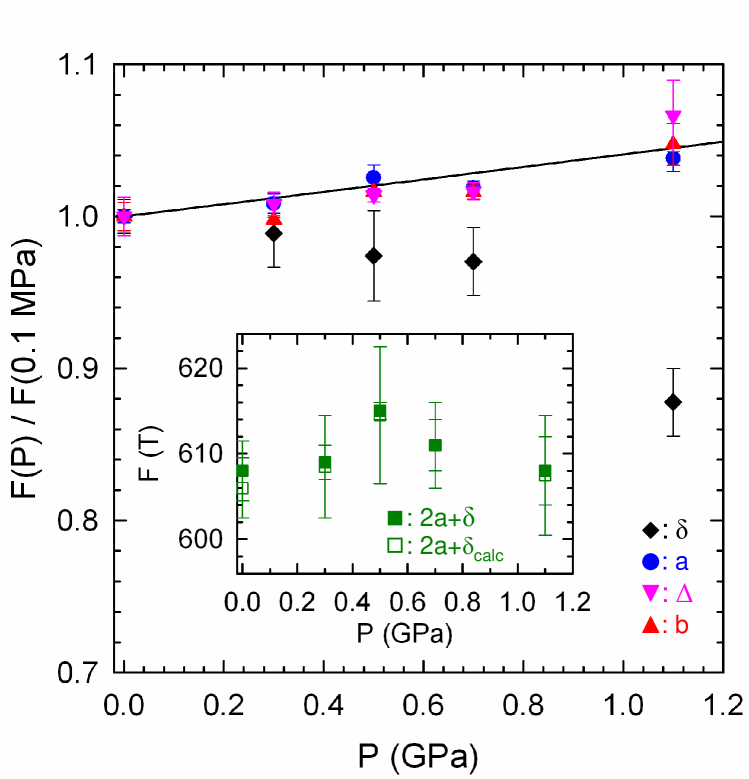
Fourier analysis of interlayer magnetoresistance data (few examples of which are given in Fig. 3) are displayed in Fig. 4. As previously reported for ambient pressure data Vi03 (11), many frequencies are observed in all the explored pressure range. Most of them are linear combinations of that linked to the compensated electron- and hole-type orbits (labelled in Fig. 1) and of the FS pieces located in-between (labelled and in Fig. 1). These two latter FS pieces correspond to so called ”forbidden orbits”111As reported in Ref. Vi03 (11), these FS pieces could correspond to MB-induced closed orbits or QI paths. However, the corresponding effective mass and MB damping factor would be much too large and small, respectively, to account for the data as it is the case of most of the observed frequency combinations. Oppositely, the Fourier component corresponds to a MB orbit while the frequency corresponds to QI paths involving an area equal to that of the FBZ (Fb = 2Fa + Fδ + FΔ) Pr02 (10, 11). At high field and (or) high pressure, shift of few frequency combinations (such as 4 + or - ) that could as well correspond to additional frequencies can be observed in Figs. 4(b) - (e). Although more data is needed in order to discuss the origin of these latter features, it can be inferred that they could arise from slight change of the FS. Nevertheless, most of the observed Fourier components remain linear combinations of the three basic frequencies reported above which allows for the study of their pressure dependence. As displayed in Fig. 5, Fb (i. e. the FBZ area) linearly increases in the explored pressure range. The pressure sensitivity (d[Fb/Fb(P = 0.1 MPa)]/dP = 0.04 GPa-1) is in good agreement with data of the FBZ area of numerous ET salts Ca94 (30, 31, 32). While the pressure dependence of Fa is the same as that of the FBZ area, Fδ strongly decreases as the pressure increases. This behaviour, which lead to the non-monotonous pressure dependence of F2a+δ reported in the inset of Fig. 5, could be understood assuming that the long and small axis of the a orbits elongates and shrinks, respectively, as the pressure increases. However, although this is actually the case of the orbits of -salts Ca94 (30), such a behavior should lead to an increase of the piece area steeper than observed in Fig. 5. The actual scenario is therefore certainly more complex.
The MB field (B0), effective mass (m∗) and Dingle temperature (TD = /2k, where is the relaxation time) can be extracted from the field and (or) temperature dependence of the oscillations amplitude. In the framework of the Lifshits-Kosevich model Sh84 (2), the amplitude of the Fourier component with the frequency Fi is given by A RTiRDiRMBiRSi, where the spin damping factor (RSi) depends only on the direction of the magnetic field with respect to the conducting plane. The thermal (for a 2D FS), Dingle and MB damping factors are respectively given by:
| (1) | |||
| (2) | |||
| (3) |
where = 2mekB/e ( 14.69 T/K). Integers and are respectively the number of tunnelling and Bragg reflections encountered along the path of the quasiparticle.
As discussed in Refs. Vi03 (11, 12), only Fourier components , (SdH) and (QI) can be analyzed on the basis of closed orbits or QI paths, the other being due to, or strongly affected by, the frequency mixing phenomenon. Therefore, we will mainly focus on these oscillations in the following.
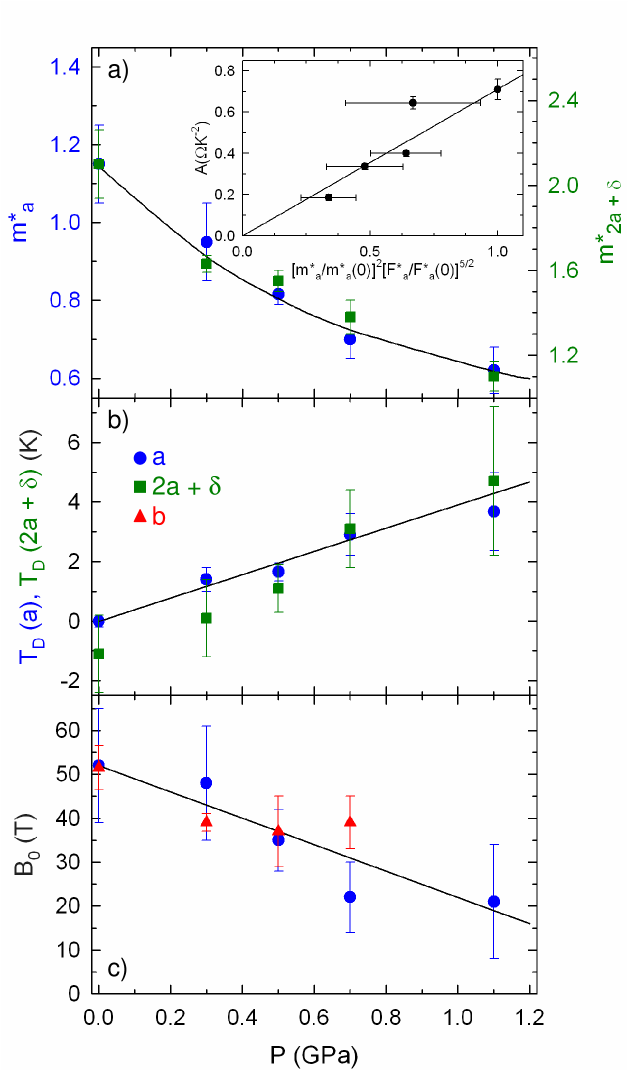
In the field range below 30 T, the amplitude of the Fourier component linked to remains temperature-independent up to 0.7 GPa (at 1.1 GPa, the signal-to-noise ratio is too small to derive a reliable temperature dependence). This feature is in agreement with the zero-effective mass value predicted for a symmetric quantum interferometer St71 (33), as reported for ambient pressure data Vi03 (11). Oppositely, m∗() and m∗() decreases by roughly a factor of 2 between ambient pressure and 1.1 GPa (see Fig. 6a). Remarkably, the ratio m∗() / m∗() remains pressure-independent and equal to 1.8. This value is close to 2 as expected from the semiclassical model of Falicov-Stachowiak Fa66 (1) for the considered coupled orbits networks Vi03 (11). The decrease of the effective mass as the applied pressure increases can be considered in the light of the T2 dependence of the zero-field resistance observed at low-temperature (see the inset of Fig. 2). Indeed, in the case of a strongly correlated Fermi liquid, the Kadowaki-Woods ratio (A / , where A and are the T2 coefficient of the resistivity and the electronic specific heat coefficient, respectively) should be proportional to the lattice parameter Mo95 (34). Assuming, as a rough approximation, that m∗() / Fa and, since the FBZ area varies as Fa under pressure, the relevant lattice parameter is proportional to 1 / (Fa)1/2, yield:
| (4) |
As can be observed in Fig. 6a, Eq. 4 accounts for the data within the error bars. Such a behaviour could suggest a reduction of electron correlations under pressure, in line with a Brinkman-Rice scenario Me00 (28). However, it should be mentioned that the product AT (where T0 is the coherence temperature, above which the T2 law is no more valid) should be roughly pressure-independent within this picture which is not the case. Indeed, according to the data of Fig. 2, it decreases by about a factor of two from ambient pressure to 1.1 GPa which suggests that electron correlations may not be the only contribution to the observed behaviour. A similar conclusion is derived from the data of -(ET)2Cu[N(CN)2]Br St05 (20).
Besides the effective mass, the two main ingredients entering the field dependence of the oscillation amplitude are the MB field and the Dingle temperature. Since the orbits only involve Bragg reflections, both TD and B0222Two different MB gaps are observed in Fig. 1. As discussed in Ref. Vi03 (11), only a value very close to their arithmetic mean, can be derived from the field-dependent data. can be derived from this component Vi03 (11, 12). The MB field value, consistently deduced from both the and components within the error bars, strongly decreases as the applied pressure increases as reported in Fig. 6c. This behaviour is consistent with the data relevant to the MB orbit reported for few charge transfer salts Ca94 (30, 31). TD has been derived from the and components, adopting the B0 value derived from in the latter case (see Fig. 6b). As already reported Vi03 (11), a slightly negative value is obtained at ambient pressure for . This can be due to a contribution of the frequency mixing phenomenon to this component. A lack of accuracy in the determination of B0 (large error bars are observed in Fig. 6c) can also contribute to this result since the orbits involves four tunnellings (t2a+δ = 4 in Eq. 3) which makes the deduced TD value very sensitive to B0. A sizeable increase of the scattering rate, deduced from the field dependence of both the a and 2a+ components, is observed under pressure. Indeed, TD which is close to 0 at ambient pressure increases up to about 4 K at 1.1 GPa which corresponds to = 0.3 ps. Pressure-induced defects seems the most plausible explanation for this behaviour. However, it must be recalled that this high value decreases back as the pressure is released which rules out any sample degradation due to the pressurization process. The increase of the scattering rate is in line with the pressure-induced resistance maximum observed in Fig. 2. However, as above discussed, the decrease of its amplitude above 0.5 GPa cannot be interpreted on this basis. An interplay between the pressure-induced decrease strength of the electron correlations and the increase of scattering rate, the latter being in this case assumed to be mainly controlled by electron-phonon interaction, could therefore be considered. Within this picture, it should also be assumed that the variations of the interlayer scattering rate, involved in the interlayer resistance, reflect that of the in-plane scattering rate which is probed by SdH oscillations. In any case, the observed pressure dependence of the Dingle temperature is at variance with the data of most ET-based salts for which TD remains unchanged under pressure Br95 (31, 35, 36).
Finally, let us examine the pressure dependence of the frequency mixing that correspond to so called ”forbidden orbits”. They could arise from both chemical potential oscillation mu (3) and MB-induced Landau level broadening LLB (4). As mentioned in Ref. Ki02 (13), applied pressure leads to an increase of the transverse interactions and therefore to a damping of the chemical potential oscillation. Oppositely, as can be observed in Fig. 4, the amplitude of some components such as or remains large, or even increases, as the applied pressure increases. This behaviour suggests that the field-dependent chemical potential oscillation is not the dominant contribution to the development of the observed frequency combinations. This point is in line with recent calculations Fo08 (37) which indicate that, contrary to the case of numerous ET salts which are uncompensated metals, chemical potential oscillation in compensated orbits systems is strongly damped. As a consequence, Landau level broadening is likely the main source of the observed frequency combinations in compensated orbits networks.
4 Summary and conclusion
The SdH spectra of the charge transfer salt (ET)8[Hg4Cl12(C6H5Br)]2 exhibits many Fourier components corresponding to linear combinations of three basic frequencies (Fa, Fδ and FΔ), in agreement with band structure calculations (see Fig. 1). Most of these frequency combinations, which correspond to ”forbidden orbits” in the framework of the semiclassical model, keep a large amplitude in all the studied pressure range. This feature likely rules out chemical potential oscillation as a dominant contribution to their origin.
The pressure sensitivity of the FBZ area is similar to that of most of the ET salts. The area of the piece and of the compensated orbits (a) follow the same pressure dependence as that of the FBZ area while the area of the piece decreases under pressure. The measured electronic properties are significantly modified as the applied pressure increases. Either additional frequencies or shifts in few of the frequency combinations are observed in the high pressure range. Therefore, some change of the FS topology as the pressure increases cannot be excluded. Higher pressures are needed to check this hypothesis.
The zero-field interlayer resistance follows a T2 behaviour at low temperature with a pressure-dependent prefactor A, in agreement with the predictions for a strongly correlated Fermi liquid Mo95 (34). Since it strongly decreases under pressure, it could be inferred that the effect of electron correlations, which are important at ambient pressure decreases, under pressure. This latter point is in agreement with data relevant to e.g. -(ET)2Cu[N(CN)2]Cl Li03 (22). However, within this picture, the amplitude of the resistance maximum should also continuously decrease as the applied pressure increases, which is not the case. Oppositely, it increases in the pressure range below about 0.5 GPa. In line with SdH data reported for -(ET)2Cu[N(CN)2]Br St99 (23), the increase of the amplitude of the resistance maximum in the low pressure range could be attributed to the sizeable increase of the scattering rate, deduced from the SdH data, as the applied pressure increases. Within this picture, the pressure dependence of the interlayer resistance would mainly result from the interplay between the pressure sensitivity of the scattering rate and of the strength of electron-correlations.
Acknowledgements.
This work was supported by Euromagnet under the European Union contract R113-CT-2004-506239, MEC-Spain (Project FIS2006-12117-C04-01, CSD2007-00041), Generalitat de Catalunya (Project 2005 SGR 683), the French-Russian exchange program between CNRS and RAS (number 21451) and by RFBR grants 09-02-00899 and 08-03-00480. We thank Jean-Yves Fortin, Sergei I. Pesotskii and Geert Rikken for interesting discussions.References
- (1) L. M. Falicov and H. Stachowiak, Phys. Rev. 147 505 (1966).
- (2) D. Shoenberg, Magnetic Oscillations in Metals (Cambridge University Press, Cambridge, 1984).
- (3) A. S. Alexandrov and A. M. Bratkovsky, Phys. Rev. Lett. 76 1308 (1996); Phys. Lett. A 234 53 (1997) and Phys. Rev. B 63 033105 (2001); T. Champel, ibid. 65 153403 (2002); J. Y. Fortin, E. Perez and A. Audouard, ibid. 71 155101 (2005).
- (4) A. B. Pippard, Proc. Roy. Soc. (London) A270 1 (1962); P. S. Sandhu, J. H. Kim and J. S. Brooks, Phys. Rev. B 56 11566 (1997); J. Y. Fortin and T. Ziman, Phys. Rev. Lett. 80 3117 (1998); V. M. Gvozdikov, Yu V. Pershin, E. Steep, A. G. M. Jansen and P. Wyder, Phys. Rev. B 65 165102 (2002).
- (5) M.-H. Whangbo and E. Canadell, Acc. Chem. Res. 22 375 (1989); M.-H. Whangbo, E. Canadell, P. Foury and J. P. Pouget, Science 252 96 (1991).
- (6) U. Beierlein, C. Hess, J. Dumas, R. Buder, D. Groult, E. Steep, D. Vignolles and G. Bonfait. Eur. Phys. J. B 17 215 (2000).
- (7) P. Foury-Leylekian, E. Sandré, S. Ravy, J.-P. Pouget, E. Elkaim, P. Roussel, D. Groult and Ph. Labbé, Phys. Rev.B 66 75116 (2002).
- (8) S. Yasusuka, C. Terakura, T. Yakabe, Y. Terai, H. M. Yamamoto, R. Kato, S. Uji, Synth. Metals 135-136 647 (2003); S. Yasusuka, S. Uji, K. Enomoto, T. Konoike, M. Nishimura, T. Terashima, D. Graf, E. S. Choi, J. S. Brooks, H. M. Yamamoto, R. Kato, K. Yokogawa and K. Murata, Synth. Metals 152 437 (2005).
- (9) L. F. Veiros and E. Canadell, J. Phys. I France 4 939 (1994).
- (10) C. Proust, A. Audouard, L. Brossard, S. I. Pesotskii, R. B. Lyubovskii and R. N. Lyubovskaia, Phys. Rev. B 65 155106 (2002).
- (11) D. Vignolles, A. Audouard, L. Brossard, S. I. Pesotskii, R. B. Lyubovskii, M. Nardone, E.Haanappel and R. N. Lyubovskaya, Eur. Phys. J. B, 31 53 (2003).
- (12) A. Audouard, D. Vignolles, E. Haanappel, I. Sheikin, R. B. Lyubovskiĭ and R. N. Lyubovskaya, Europhys. Lett. 71 783 (2005).
- (13) K. Kishigi and Y. Hasegawa, ibid. 65 205405 (2002).
- (14) R. N. Lyubovskaia, O. A. Dyachenko, V. V. Gritsenko, Sh. G. Mkoyan, L. O. Atovmyan, R. B. Lyubovskii, V. N. Laukhin, A. V. Zvarykina and A. G. Khomenko, Synth. Metals 42 1907 (1991).
- (15) M.-H. Whangbo and R. Hoffmann, J. Am. Chem. Soc. 100 6093 (1978).
- (16) J. Ammeter, H.-B. Bürgi, J. Thibeault and R. Hoffmann, J. Am. Chem. Soc. 100 3686 (1978).
- (17) M. Nardone, A. Audouard, D. Vignolles and L. Brossard, Cryogenics 41 175 (2001).
- (18) D. Vignolles, V. N. Laukhin, A. Audouard, T. G. Prokhorova, E. B. Yagubskii and E. Canadell, Eur. Phys. J. B 51 53 (2006).
- (19) R. B. Lyubovskii, S. I. Pesotskii and R. N. Lyubovskaya, JETP Lett. 62 37 (1995), R. B. Lyubovskii, S. I. Pesotskii, A. Gilevski and R. N. Lyubovskaya, J. Phys. I France 6 1809 (1996).
- (20) C. Strack, C. Akinci, V. Pashchenko, B. Wolf, E. Uhrig, W. Assmus, M. Lang, J. Schreuer, L. Wiehl, J. A. Schlueter, J. Wosnitza, D. Schweitzer, J. Muller and J. Wykhoff, Phys. Rev. B. 72 054511 (2005).
- (21) H. Urayama, H. Yamochi, G. Saito, K. Nozawa, T. Sugano, M. Kinoshita, S. Sato, K. Oshima, A. Kawamoto and J. Tanaka, Chem. Lett. 55 (1988); H. Müller, C.-P. Heidmann, A. Lerf, W. Biberacher, R. Sieburger and K.Andres, Springer Proceedings in Physics, Vol. 51, The Physics and Chemistry of Organic Superconductors, Springer-Verlag Berlin, Heidelberg 1990.
- (22) P. Limelette, P. Wzietek, S. Florens, A. Georges, T. A. Costi, C. Pasquier, D. Jérome, C. Mézière and P. Batail, Phys. Rev. Lett. 91 016401 (2003).
- (23) T. F. Stalcup, J. S. Brooks and R. C. Haddon, Phys. Rev. B. 60 9309 (1999).
- (24) J. G. Analytis, A. Ardavan, S. J. Blundell, R. L. Owen, E. F. Garman, C. Jeynes and B. J. Powell, Phys. Rev. Lett. 96 177002 (2006).
- (25) T. Sasaki, N. Yoneyama, Y. Nakamura, N. Kobayashi, Y. Ikemoto, T. Moriwaki and H. Kimura, Phys. Rev. Lett. 101 206403 (2008).
- (26) U. Lundin and R. H. McKenzie, Phys. Rev. B 68 081101 (2003).
- (27) A. F. Ho and A. J. Schofield, Phys. Rev. B 71 045101 (2005).
- (28) J. Merino and R. H. McKenzie, Phys. Rev. B 61 7996 (2000).
- (29) Y. Maeno, K. Yoshida, H. Hashimoto, S. Nishizaki, S. Ikeda, M. Nohara, T. Fujita, A. P. Mackenzie, N. E. Hussey, J. G. Bednorz and F. Lichtenberg, J. Phys. Soc. Jap. 66 1405 (1997).
- (30) J. Caulfield, W. Lubczynski, F. L. Pratt, J. Singleton, D. Y. K. Ko, W. Hayes, M. Kurmoo and P. Day, J. Phys.: Condens. Matter 6 2911 (1994).
- (31) J. S. Brooks, X. Chen, S. J. Klepper, S. Valfells, G. J. Athas, Y. Tanaka, T. Kinoshita, N. Kinoshita, M. Tokumoto, H. Anzai and C. C. Agosta, Phys. Rev. B 52 14457 (1995).
- (32) M.V. Kartsovnik, W. Biberacher, K. Andres and N.D. Kushch, JETP Lett. 62 905 (1995) [Pis’ma Zh. Éksp. Teor. Fiz. 62 890 (1995)].
- (33) R. W. Stark and C. B. Friedberg, Phys. Rev. Lett. 26 556 (1971).
- (34) G. Moeller, Q. Si, G. Kotliar, M. Rozenberg and D. S. Fisher, Phys. Rev. Lett. 74 2082 (1995); R. H. McKenzie, arXiv:cond-mat/9802198.
- (35) J. Hagel, J. Wosnitza, C. Pfleiderer, J. A. Schlueter, J. Mohtasham and G. L. Gard, Phys. Rev. B 68 104504 (2003).
- (36) D. Vignolles, A. Audouard, V. N. Laukhin, M. Nardone, E. Canadell, N. G. Spitsina and E. B. Yagubskii, Synth. Met. (2008), DOI: 10.1016j.synthmet.2008.06.026
- (37) J. Y. Fortin and A. Audouard, Phys. Rev. B 77 134440 (2008).