Complex Agent Networks explaining the HIV epidemic
among homosexual men in Amsterdam
Abstract
Simulating the evolution of the Human Immunodeficiency Virus (HIV) epidemic requires a detailed description of the population network, especially for small populations in which individuals can be represented in detail and accuracy. In this paper, we introduce the concept of a Complex Agent Network(CAN) to model the HIV epidemics by combining agent-based modelling and complex networks, in which agents represent individuals that have sexual interactions. The applicability of CANs is demonstrated by constructing and executing a detailed HIV epidemic model for men who have sex with men (MSM) in Amsterdam, including a distinction between steady and casual relationships. We focus on MSM contacts because they play an important role in HIV epidemics and have been tracked in Amsterdam for a long time. Our experiments show good correspondence between the historical data of the Amsterdam cohort and the simulation results.
keywords:
Multi-Agent Systems(MAS) , Complex Network(CN) , HIV epidemics , scale-free , Men who have Sex with Men(MSM)1 Introduction
Understanding the underlying dynamics in Human Immunodeficiency Virus (HIV) epidemics is a crucial public health issue, unfortunately however addressing specific problems in small populations is difficult because individuals need to be modelled with detailed social behavior. Traditional mathematical methods greatly simplify both the disease dynamics and the population networks, however extending them to more detailed models is intractable.
In particular, whether such methods also apply to networks of small size, and thus to many real-world biological or epidemiological applications, is still an open question[1]. Many networks of relevance to epidemiology may be of relatively small size, among which social contact networks on sexually transmitted diseases for a small group (e.g. men who have sex with men, namely MSM, within a city or town) are representative.
Modelling the HIV epidemic is difficult because the true incidence111Incidence is a measure of the risk of developing some new condition within a specified period of time. In this paper we use the incidence rate to denote the number of new cases per unit of person-time at risk. of the HIV/AIDS-epidemic is uncertain since many people may be unaware of their infection. Secondly, HIV progression has a very long asymptomatic period which makes studies of the actual infection spreading a very complicated task [2]. Finally, the various routes of infection and the inhomogeneity of the involved population pose additional challenges to understanding the underlying knowledge of HIV epidemics.
Multi-agent systems (MAS) and complex networks (CN) are often used separately to model and simulate epidemics; however, whether existing models, which typically focus on large populations, can address epidemics among small groups () are still questionable and seemingly need further validation. In terms of agent-based modelling, Teweldemedhin developed an agent-based bottom-up modelling approach for estimating and predicting theX spread of the HIV in a given population [3]; Xuan developed an extended Cellular Automata simulation model to study the dynamical behavior of HIV/AIDS transmission by incorporating heterogeneity into agents’ behavior [4]. In terms of complex network modelling, Bai discussed a sexual network spreading model for HIV epidemics [5]; Sloot proposed a new way to model HIV infection spreading through the use of dynamic complex networks, with the time evolution of the network vertices modelled by a Markov process [2].
In this paper we present the CAN approach for simulating epidemics in small networks to great detail. The CAN is a hybrid approach in which multi-agent systems and complex networks are the basic methods of modelling epidemics on individual and population scales respectively. Using the CAN approach, we simulate a relatively detailed model of the HIV endemic among MSM in Amsterdam. This model includes a distinction between steady and casual relationships, which is regarded as an important aspect by others [e.g. 6]. We compare the results to the Amsterdam Cohort Study (ACS) historical data.
2 Complex Agent Network
The CAN approach takes the MAS and CN as basic methods for modelling and simulating epidemics on individual and population scales. Agents contain specified personal information on an individual scale, whilst complex networks emphasize the relationship dynamics among the agents on a population scale. We review both concepts and the combination of them in this section.
2.1 Multi-agent Systems
A MAS is a system composed of multiple interacting intelligent agents, and can manifest self-organization and complex behavior even when the individual strategies of all the agents are simple. Heylighen defined self-organization as “the spontaneous emergence of global coherence out of the local interactions between initially independent components” [7].
The agents in a multi-agent system have several important characteristics [8]: Autonomy: the agents are at least partially autonomous. Local views: no agent has a full global view of the system, or the system is too complex for an agent to make practical use of such knowledge. Decentralization: there is no controlling agent (or the system is effectively reduced to a reductionistic system) [9].
Applied to HIV epidemics, a MAS represent a specified human community and viruses propagate along social contacts. Each individual has his own progression of infection and simple rules to choose partners. Each agent only knows the information about himself and his partners instead of epidemiological statistics. There is no dominating agent in the community to control the spread of viruses.
2.2 Complex Networks
The study of complex networks is inspired largely by the empirical study of real-world networks such as computer networks and social networks. A network is a set of items, which we call vertices, with connections between them, called edges [10]. In the context of network theory, a complex network is a network with non-trivial topological features that mostly do not occur in simple networks such as lattices.
The complex network theory aims to do three things[10]. Firstly, it aims to find and highlight statistical properties, such as path lengths and degree distributions, that characterize the structure and behavior of networked systems, and to suggest appropriate ways to measure these properties. Secondly, it aims to create models of networks that can help us to understand the meaning of these properties, how they came to be as they are, and how they interact with one another. Finally, it aims to predict what the behavior of networked systems will be, on the basis of measured structural properties and the local rules governing individual vertices.
For HIV epidemics, an at-risk population can be depicted as a network with vertices representing persons and edges representing social contacts. Over these relationships, viruses are propagated from one individual to another and thus give rise to the epidemic prevalence. Findings in sociology or epidemiology suggest that social contact networks are scale-free networks [11]. Therefore we create networks with vertices following power-law degree distributions, and then simulate HIV propagation by evolving networks temporally and spatially.
2.3 Complex Agent Networks
The benefits of combining a MAS and a CN is twofold.
Firstly, the edge forming and rewiring mechanism of a complex network with a non-trivial topology can regulate the interactions among agents in a MAS. In this way we can keep these interactions from being either purely regular or purely random as we usually see in a MAS. Furthermore, the recent development of statistical methods for quantifying complex networks is a way to analyze the influence of network topologies on epidemics [e.g. 12].
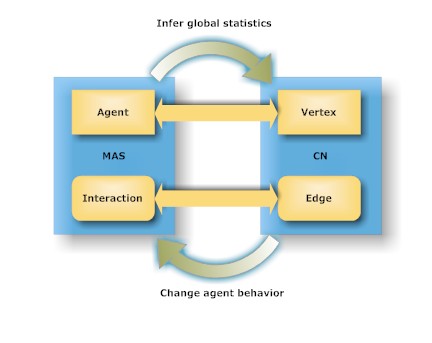
Secondly, local agent information can be combined to infer global statistics which can be fed back into the simulation dynamically, resembling real-world epidemics more closely. For example, if the HIV prevalence becomes very high, individuals may be less prone to unsafe sexual interactions with other individuals whose serostatus they do not know.222Here we assume that individuals somehow find out such global statistics, e.g. through media. This interaction of both the individual and population levels is depicted in Figure 1.
To combine the MAS and CN we map agents and their interactions in a MAS to vertices and edges in a CN, respectively, as shown in Fig. 1. Agents provide personal heterogeneity and local infection progression on an individual level; networks benefit from continuously distilling values of epidemic-related parameters from individuals and then mimic the virus propagation on a population level.
2.4 Application of CAN to HIV epidemics
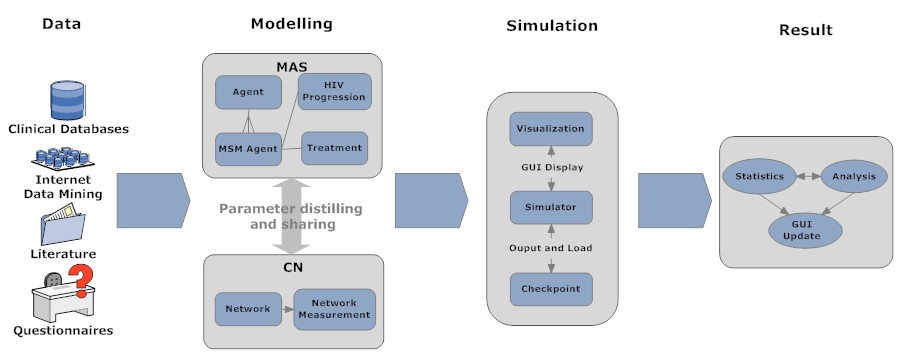
Fig. 2 shows an application reference procedure of applying the CAN approach to HIV epidemics, which consists of four steps, i.e. data collection, modelling, simulation and result manipulation.
The CAN-based HIV epidemic studies commence with data collection from e.g. Clinical Databases, Internet Data Mining, Literature and Questionnaires.
Fed with the data, models are constructed by utilizing the features of both the MAS and CN, which are depicted by two composite blocks. The “MAS” composite block deals with societal individuals and their infection details. An Agent stands for an individual and supports specialized inheritance. As shown in Fig. 2, an inherited block MSM Agent manages MSM’ infection properties and status transitions by using HIV Progression and Treatment blocks. A MSM Agent also support inferring values of parameters for a “CN”. The Treatment block considers factors related to HIV ART or HAART333ARV, Anti-Retroviral Therapy; HAART, Highly Active Anti-Retroviral Therapy, is the combination of at least two different classes of antiretroviral drugs. (e.g. drug types, patients’ adherence and drug resistances [13]). The “CN” composite block manipulates network initializing, reshuffling and measuring through the Network and Network Measurement blocks. In addition, the “CN” provides network rendering support for the Visualization block of simulation.
The Visualization and Checkpoint blocks can be invoked by the Simulator according to specified purposes, to enhance interactive exploration of simulations.
The Statistics and Analysis blocks are applied to simulation results and then enforce the GUI Update of network rendering and parameter plotting.
3 Modelling HIV Epidemics
3.1 Progression of HIV infection
The progression of HIV infection from seropositive to AIDS can broadly be divided into three stages: primary infection (PI), asymptomatic period (AP) and AIDS. Although there are much variations amongst patients, on average, transmissibility is the highest during the primary infection which is believed to be associated with high plasma HIV RNA levels and continued risky sexual activities [14, 15].
Correspondingly each agent representing an at-risk individual, possesses a disease manager to conduct its HIV infection progression temporally. The manager conducts an irreversible “negative PI AP AIDS” order. Note that, we exclude the case that an individual with AIDS can with the right treatment go back to the asymptomatic phase, because in general patients are most likely diagnosed and treated before reaching the AIDS stage.
3.2 Construction of contact networks
HIV is transmitted mainly through sexual contacts, intravenous drug uses (IDU), mother-to-child transmissions and transfusion of contaminated blood products. In this paper we focus on MSM contacts which play an important role in HIV epidemics and have been tracked in Amsterdam for a long time [e.g. 16, 17]. We model these contacts as an undirected, scale-free complex network.
The sexual contact network starts with MSM, each of which is assumed to be sexually active with an age between 15 and 65 based on the age limits of the ACS samples [17]. The network is assumed to be scale-free [11, 18], whilst the degree of each vertex follows a degree distribution to represent his yearly number of partners. Let us choose
| (1) |
where and are constants and is a normalizing factor.
After obtaining the degree sequence of vertices, edges(partnerships) are formed by using the so-called configuration model [10]. A degree sequence is a set of values of the degrees of vertices , from the given power-law distribution. According to the configuration model, the probability that a vertex is chosen as an end of a random edge is proportional to .
3.3 HIV propagation in networks
The HIV propagation in networks can become considerably difficult when more details are taken into account. We provide a formula of calculating the transmission probability, considering risk behavior, treatments, (steady or casual) partnerships and transmissibility at different infection stages.
Similar to the commonly used Susceptible-Infected-Removed (SIR) epidemiological model, our model sets individuals in three discrete states, i.e. susceptible, infected or removed (caused by deaths). The infected state comprises primary infection, asymptomatic period and AIDS stages (see Section 3.1) which are related with different statistical transmission probability () per action. These per action are represented by , and for PI, AP and AIDS stages, respectively. Individuals at stage AIDS are assumed to have no contacts, so that .
Each individual has partners, among whom at most one steady partner is allowed. This steady partnership lasts for years based on statistical data. With the presence of a steady partner, an individual is likely to reduce his risk behavior with all other casual partners, and this possible reduction is represented as a partnership factor. Two steady partners have many actions per year, while two casual partners have one action per year.
For a vertex , the statistical transmission probability per action is denoted by . Then this transmission probability per action is adjusted according to the stage an individual is currently at, and the treatment reduction factor which is derived from treatment effectiveness.
For an edge as a partnership connecting and , the risk behavior factor is denoted by , which is related to the partners’ attitude towards risk; the number of actions per year over this partnership is denoted by ().
In addition, the partnership factor denoted by is subjected to whether the individual has a steady partner, and it will influence all incident casual partnerships.
Then the transmission probability from to per action is given based on parameters aforementioned
| (2) |
Because the PI stage lasts around 3 months (0.25 year) and falls short of one time step of a year, we divide into and as two transmissibility at PI stage. Hence if is at the PI stage, we also divide into and , and into and . Then
,
.
The transmission probability from to per year is
| (3) |
The probability of infected by positive partners per year is
| (4) |
where is the number of partners of .
Note that , and are varying with the status of and time, and so are and with the status of and time. Therefore each susceptible vertex gets infected with a probability given by Equation 4 at each time step, which contributes to the dynamics of HIV propagation.
3.4 Demographic influences
In this section, we discuss the demographic principles that regulate the conservation or deletion (substitution) of individuals and relationships.
The vertices in networks are initialized randomly with an age from a range of 15 to 65, according to the age limits of the ACS samples [17]. Each edge is initialized with an expected duration according to the statistical real-world partnership duration. At each time step, an individual gets an increment of age and a partnership gets an increment of duration, mimicking the reality.
If one of the following three conditions applies, then an individual will be removed from a network:
(1) The individual’s age exceeds 65, the upper age limit of the ACS samples.
(2) The infection has developed to the AIDS stage (the individual will be removed at the next time step).
(3) In case of geographic migration (a fraction of randomly selected individuals will be removed from a network. This fraction is left as tunable, e.g. 1% assumed in our model.).
Susceptible individuals will be added to the network as substitutes for the removed individuals at each time step, to keep the population size constant. All these newly added individuals will join the epidemic contact network according to the principles given in Section 3.2.
An edge will be kept for the next time step if:
(1) It is a steady partnership and has not expired.
(2) A previous casual partnership is likely to be conserved with a probability (e.g. 0.2 assumed in our model).
4 Simulation Implementation
We implement specific functionalities of the HIV epidemics simulation, such as an advanced scheduling mechanism and interactive visualization, using the JUNG[19] and MASON[20] libraries.
4.1 Functionality
The specific functionalities of the CAN simulation contains the following components:
(1) Model interpretation
The model described in Section 3 is interpreted into an executable simulation supporting the population and individual scales.
On a population scale, the formation and reshuffle of the edges are driven by the dynamics of the networks. An edge is formed based on the degrees and local status of two potential partners, as well as the (steady or casual) type and duration of their partnership.
On an individual scale, heterogenized agents are described with different HIV progression stages (Susceptible, PI, AP and AIDS) which are influenced per time step by the disease progression, risk behavior and treatment.
Furthermore, the interpreted executable simulation consists of modules which we call operators (see Section 4.2). We embed these operators into either agents or networks, and then schedule them using a simulator.
(2) Simulator
We implement a flexible scheduling mechanism, interactive visualization and a checkpoint mechanism into the simulator. The scheduling mechanism is double-precision discrete-event-and-priority driven and supports complicated user interactions with the simulator. This gives support to interactive exploration of the running simulations and, for instance, allows checkpoint/restart of long running simulations.
(3) Statistics and analysis
We can take specific epidemic-related statistics and analyze their results, besides general statistical properties e.g. path lengths. For example, we take incidence per person-year as a measure of HIV epidemics in Section 5, by dividing the number of newly infected persons every year by the population size.
4.2 Operators
The simulation operators with their annotated priorities are shown in Table 1. These operators are invoked at each time step to evolve a network where is the time step.
| Operator | Scale | Priority | Description |
|---|---|---|---|
| Infection Operator | Population | 0 | Infect susceptible individuals and propagate HIV. |
| Local Progression Operator | Individual | 1 | Advance HIV disease progression of individuals. |
| Demographic-Reshuffling Operator | Population | 2 | Enforce demographic and reshuffling influences on network evolutions. |
| Statistics and Visualization | Population | 3 | Statistics approaches and visualization updates can be added and configured according to pre-specified outputting rules. |
The Infection Operator basically deals with virus propagation on a population scale. For simplification, we disseminate its calculation to individuals by using Equations 2-4 in Section 3.3. Algorithm 1 gives the details.
The Local Progression Operator and Demographic - Reshuffling Operator are presented in Algorithms 2 and 3 respectively.
4.3 Simulation scheduling
We design and implement a flexible scheduling mechanism with three main advantages.
Firstly, a double-precision discrete-event based scheduler is available. With this we can schedule special events, such as the Gay Parade Day444The Gay Parade Day is the national celebration day on the first weekend in August in the Netherlands. parties for MSM happening at fractional time steps.
Secondly, all agents and operators can be registered with predefined priorities. Vertices (agents) and edges (partnerships) are scheduled firstly, (demographical and reshuffling) dynamics of networks secondly, and statistics and GUI updates finally. In this way, the infection and local progression drives the dynamic evolution of networks and the collection of statistics.
Finally, the simulator can schedule, for special purposes, vertices and edges at predefined intervals. For example, we can collect incidence statistics every 2 years instead of 1 year.
4.4 Visualization
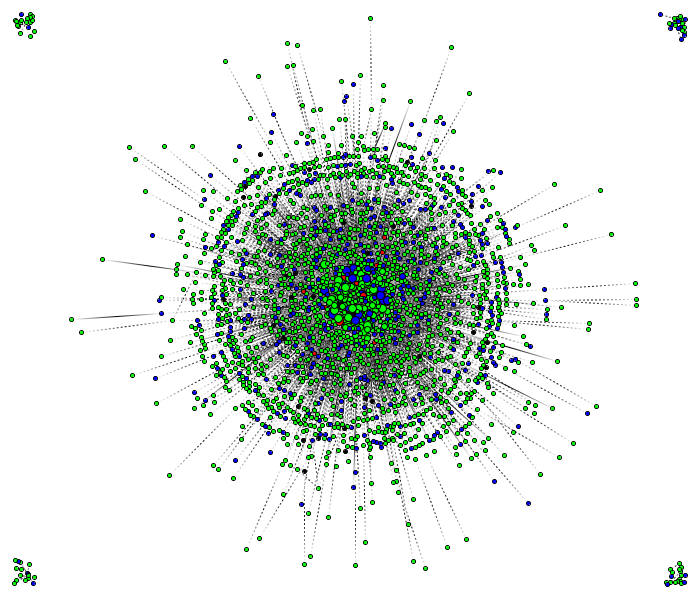
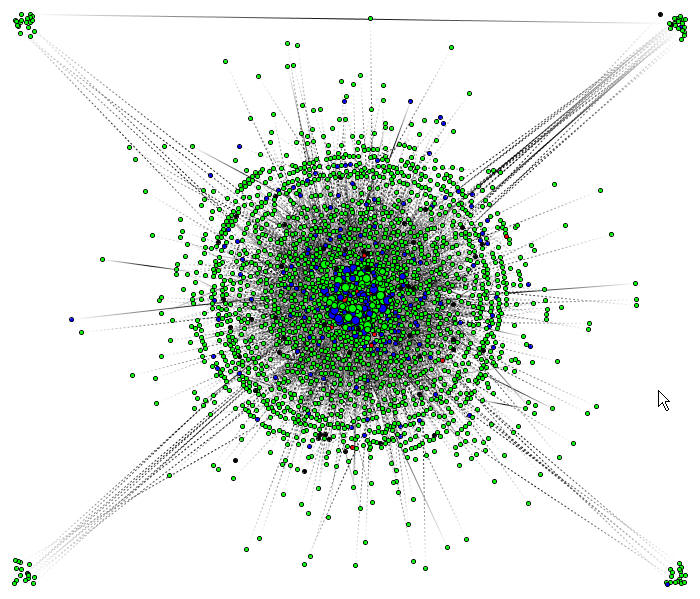
The visualization of contact networks can present an overview of the studied population, and explain details about a selected vertex or edge. The visualization serves the following purposes:
(1) To represent individuals in a population and (steady or casual) relationships.
(2) To arrange and display vertices and edges, in order to study the sorting, grouping and correlation of vertices and edges.
(3) To present detailed properties of selected vertices or edges.
Fig. 3 shows the visualization of the network after initialization and reshuffling.
5 Case Study: the HIV epidemic in the Amsterdam MSM cohort
We take the HIV epidemic among the Amsterdam MSM cohort as a case study.
5.1 Amsterdam cohort study
The Amsterdam Cohort Study (ACS) of HIV infection and AIDS among MSM was initiated in 1984. According to the report [16], 2299 MSM have been involved in the ACS until 2006. Of the 2299 MSM, 571 were HIV-positive at study entry and 192 seroconverted during follow-up. Yearly HIV inicidence for MSM over calendar years is reported in [17] to indicate the HIV prevalence trend among MSM.
5.2 Parameters and their values
5.2.1 On a population scale
Societal-related parameters for individuals and network-related initialization are discussed.
Schneeberger concluded in [11] that MSM population follows a power-law degree distribution with a value of in the interval between 1.5 and 2. We assume and a maximum degree . For initialization, the network size is , and the fraction of vertices with a degree of 0 is set to be because we assume a small portion of people in a population not having any contact.
Steady relationships among MSM have a higher contribution to HIV incidence in the era of HAART because more unprotected anal sex is likely to take place between steady couples other that casual ones, according to [15, 6, 21, 22, 23]. Thus the fraction of steady relationships in a network is regarded as an important parameter. Based on questionnaire results given by [6], approximately 50% of the ACS participants reported having a steady partner. So we estimate that a partnership is initialized as a steady one with a probability given by
| (5) |
where
is the size of a network, is the expected total number of edges in a network and is the expected degree of vertices. According to Equation 1 with given values of and , we get . Allowing for steady partnerships being kept until expired, the averaged fraction of steady relationships from our simulation results fluctuates between 0.047 and 0.055.
The duration of steady partnerships among Amsterdam MSM is reported to have an expected value of 1.5 years [6]. Thus we assume the duration of steady partnerships following a discrete uniform distribution .
Unlike the PI or AIDS stages with fixed durations, the duration of the AP stage can vary with the therapy effecitiveness. So we draw the duration of AP from a Poisson distribution with a mean value of 13 years for a failed treatment, and a mean value of 22 years for a successful treatment [6].
The transmission probability for sexual actions other than UAI555UAI, unprotected anal intercourse; URAI, unprotected receptive anal intercourse; UIAI, unprotected insertive anal intercourse is assumed to be negligible[24], also, the transmission probability for an UAI between serodiscordant666Serodiscordant (sero-discordant) is a term used to describe a couple in which one partner is HIV positive and the other is HIV negative (Smith, Raymond. Couples. Retrieved on 08-26, 2006.). Seroconcordant is the term used to describe a couple in which both partners are of the same HIV status (ie both are HIV positive or both are HIV negative). men is depending on whether the role of the HIV-negative man is receptive (URAI) or insertive (UIAI). We assume each partner of a couple takes randomly a receptive or insertive role in an action. The frequency of either URAI or UIAI between steady partners is 15 per year[6], for simplicity we assume that the frequency of sexual actions of MSM per year follows a Poisson distribution of . At the PI stage, the frequency within the first 3 months and the last 9 months is assumed to follow and , respectively.
5.2.2 On an individual scale
Epidemic parameters and the involved reduction factors are discussed.
Of the infected individuals at the asymptomatic stage, 42% know they are HIV positive[6]. Since the introduction of HAART in 1996, the fraction of individuals that has received any form of HAART therapy after diagnosis, is 81% in 2006 [16]. 70% of the individuals who received therapy will be successfully treated[6]. In other words, individuals get diagnosed with a probability of 0.42, and obtain a treatment with a probability of 0.81, and then get successfully treated with a probability of 0.7.
The value of (see Section 3.3) is related to the infection stage of an individual , given by , , or . According to [25, 26, 27], the probability of the transmission per URAI/UIAI act at stage PI and AP is 0.22/0.044 and 0.011/0.0022 respectively. Therefore, and with respect to the receptive or insertive role.
ART is assumed to reduce the transmissibility by 50-90% to a moderate extent in [28], so that in our simulations the treatment factor is set to follow a continuous uniform distribution . If an individual has a steady partner, the partnership factor is 0.84[see 6, Sec. 2], otherwise 1 which means no reduction.
The general use of ART leading to changes in risk behavior has sparked considerable concerns, for instance, Baggaley discussed in [15] that increases in risk behavior could result from increased optimism about HIV therapy due to the availability of HAART. In our simulations, the definition and estimated values of risk behavior factors is based on [29, 30], and the relative values are given in Table 2.
| 1985-1986 | 1987 | 1988-1991 | 1992-1995 | 1996 | 1997-1999 | 2000- | |
|---|---|---|---|---|---|---|---|
| negative | 3.50 | 1.50 | 0.80 | 0.90 | 1.30 | ||
| positive | 2.80 | 1.61 | 0.42 | 0.88 | 0.78 | 0.70 | 1.30 |
5.3 Results and discussion
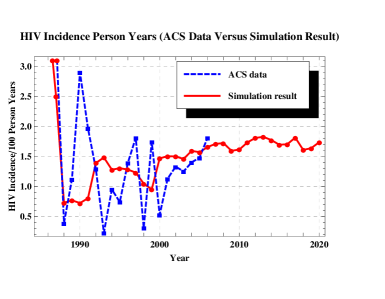
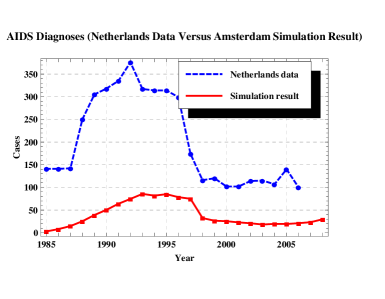
The simulation results illustrated in Figure 4 shows the HIV incidences (a) and AIDS diagnosis cases (b) over calendar years.
We used mainly the incidence for comparison and validation because of its relative dimension. Our simulated yearly incidences are consistent with the historical ACS data [see 17, Table 5], based on the conduct of a null hypothesis test where the simulation result of incidence does not differ significantly from the ACS data. Although the historical data (the dashed line in Figure 4a), got based on incomplete statistics (due to the involvement of subgroups of MSM related to substudies of ACS in years), was fluctuating tremendously, the hypothesis is accepted by using Chi-Square tests with a significance level of 0.05 (data not shown).
As a supplement, we compared the simulated AIDS diagnosis cases with the historical statistics in the Netherlands in the aspect of trend. Our result shows, even that it is based on a relatively small sample space with 2299 Amsterdam MSM, a similar trend to the statistical data in the Netherlands (including Amsterdam as one city) over calendar years [see 31, Table B.18]. Both the two curves in Figure 4b approximately show a continuous increase in AIDS diagnosis cases until 1996 and an acute decline in 1996-1998, and then keeps stable from 1999 on. In this study, our simulation suggests that the acute decline is most likely caused by the introduction of HAART in 1996. In the future, we could scale up the simulation of AIDS diagnosis cases from Amsterdam to the Netherlands, if and when the total numbers of MSM with different behavior features in different cities of Netherlands are available.
6 Conclusions
We proposed a flexible hybrid Complex Agent Network approach and validated experimentally its applicability by taking the dynamics of HIV propagation among Amsterdam MSM, a representative small population, as a case study. Our experiments showed good correspondence between the model results and the historical data of ACS, in addition, the results are robust with respect to small changes in the input parameters (data not shown). Therefore, the model can be adopted to predict the future trend of HIV prevalence among MSM in Amsterdam, whilst allowing for easy tuning the values of highly concerned parameters, such as the drug effectivity, diagnosis proportion and risk behavior factor.
7 Acknowledgments
The authors would like to acknowledge the financial support of the China Scholarship Council (www.csc.edu.cn) and the European ViroLab [32] (www.virolab.org) grant INFSO-IST-027446.
References
- Pautasso and Jeger [2008] M. Pautasso and M. J. Jeger, Ecological Complexity 5, 1 (2008).
- Sloot et al. [2008a] P. M. A. Sloot, S. V. Ivanov, A. V. Boukhanovsky, D. A. M. C. Van De Vijver, and C. A. B. Boucher, International Journal of Computer Mathematics 85, 1175 (2008a).
- Teweldemedhin et al. [2005] E. Teweldemedhin, T. Marwala, and C. Mueller (2005), Proceedings - HIS’04: 4th International Conference on Hybrid Intelligent Systems, pp. 154–159.
- Xuan et al. [2008] H. Xuan, L. Xu, and L. Li, Annals of Operations Research pp. 1–19 (2008), article in Press.
- Bai et al. [2007] W. . Bai, T. Zhou, and B. . Wang, International Journal of Modern Physics C 18, 1025 (2007).
- Xiridou et al. [2003] M. Xiridou, R. Geskus, J. De Wit, R. Coutinho, and M. Kretzschmar, AIDS 17, 1029 (2003).
- F. [2001] H. F., The science of self-organization and adaptivity (2001).
- Wooldridge [2002] M. Wooldridge, ed., An Introduction to MultiAgent Systems (John Wiley & Sons Ltd, 2002).
- Panait and Luke [2005] L. Panait and S. Luke, Autonomous Agents and Multi-Agent Systems 11, 387 (2005), 10.1007/s10458-005-2631-2.
- Newman [2003] M. E. J. Newman, SIAM Review 45, 167 (2003).
- Schneeberger et al. [2004] A. Schneeberger, R. Nat, C. H. Mercer, S. A. J. Gregson, N. M. Ferguson, C. A. Nyamukapa, R. M. Anderson, A. M. Johnson, and G. P. Garnett, Sexually Transmitted Diseases 31, 380 (2004).
- Goodreau [2006] S. M. Goodreau, Genetics 172, 2035 (2006).
- Sloot et al. [2005] P. M. A. Sloot, A. V. Boukhanovsky, W. Keulen, A. Tirado-Ramos, and C. A. Boucher, Journal of Clinical Monitoring and Computing 19, 263 (2005).
- Koopman et al. [1997] J. S. Koopman, J. A. Jacquez, G. W. Welch, C. P. Simon, B. Foxman, S. M. Pollock, D. Barth-Jones, A. L. Adams, and K. Lange, Journal of Acquired Immune Deficiency Syndromes and Human Retrovirology 14, 249 (1997).
- Baggaley et al. [2005] R. F. Baggaley, N. M. Ferguson, and G. P. Garnett, Emerging Themes in Epidemiology 2 (2005).
- ACS [2006a] The amsterdam cohort studies on hiv infection annual report 2006 (2006a), URL http://www.amsterdamcohortstudies.org/menu/reports/ACSannualr%%****␣submittedToMathAndComputerSimulation.tex␣Line␣1450␣****eport2006.pdf.
- ACS [2006b] Overview of the amsterdam cohort studies among homosexual men and drug users (2006b), URL http://www.amsterdamcohortstudies.org/menu/reports/ACSovervie%w2006.pdf.
- Reed [2006] W. J. Reed, Mathematical Biosciences 201, 3 (2006).
- O’Madadhain et al. [2005] J. O’Madadhain, D. Fisher, P. Smyth, S. White, and Y.-B. Boey, Journal of Statistical Software (2005).
- Luke et al. [2004] S. Luke, C. Cioffi-Revilla, L. Panait, and K. Sullivan, Proceedings of the 2004 SwarmFest Workshop (2004).
- Xiridou et al. [2004] M. Xiridou, R. Geskus, J. De Wit, R. Coutinho, and M. Kretzschmar, AIDS 18, 1311 (2004).
- Semple et al. [2003] S. J. Semple, T. L. Patterson, and I. Grant, AIDS Care - Psychological and Socio-Medical Aspects of AIDS/HIV 15, 3 (2003).
- Davidovich et al. [2004] U. Davidovich, J. B. F. De Wit, and W. Stroebe, AIDS Education and Prevention 16, 304 (2004).
- Caceres and Van Griensven [1994] C. F. Caceres and G. J. P. Van Griensven, AIDS 8, 1051 (1994).
- Leynaert et al. [1998] B. Leynaert, A. M. Downs, and I. De Vincenzi, American Journal of Epidemiology 148, 88 (1998).
- Vittinghoff et al. [1999] E. Vittinghoff, J. Douglas, F. Judson, D. McKirnan, K. Macqueen, and S. R. Buchbinder, American Journal of Epidemiology 150, 306 (1999).
- DeGruttola et al. [1989] V. DeGruttola, G. R. Seage Iii, K. H. Mayer, and C. R. Horsburgh Jr, Journal of Clinical Epidemiology 42, 849 (1989).
- Boily et al. [2004] M. C. Boily, F. I. Bastos, K. Desai, and B. Masse, Sexually Transmitted Diseases 31, 100 (2004).
- Dukers et al. [2001] N. H. T. M. Dukers, J. Goudsmit, J. B. F. De Wit, M. Prins, G. J. Weverling, and R. A. Coutinho, AIDS 15, 369 (2001).
- Bezemer et al. [2008] D. Bezemer, F. De Wolf, M. C. Boerlijst, A. Van Sighem, T. D. Hollingsworth, M. Prins, R. B. Geskus, L. Gras, R. A. Coutinho, and C. Fraser, AIDS 22, 1071 (2008).
- Veen et al. [2006] M. v. Veen, F. Koedijk, I. v. d. Broek, E. O. d. Coul, I. d. Boer, A. v. Sighem, and M. v. d. Sande, Sexually transmitted infections in the netherlands in 2006 (2006), URL http://rivm.openrepository.com/rivm/bitstream/10029/16495/1/2%10261003.pdf.
- Sloot et al. [2008b] P. M. A. Sloot, P. Coveney, M. T. Bubak, A.-M. Vandamme, B. . Nuallain, D. v. d. Vijver, and C. Boucher, Reviews in Antiviral Therapy 3 (2008b).