Comparison of relativistic iron line models
Abstract
The analysis of the broad iron line profile in the X-ray spectra of active galactic nuclei
and black hole X-ray binaries allows us to constrain the spin parameter of the black hole.
We compare the constraints on the spin value for two X-ray sources, MCG-6-30-15 and GX 339-4, with a broad iron line
using present relativistic line models in XSPEC — laor and kyrline.
The laor model has the spin value set to the extremal value , while the kyrline model enables
direct fitting of the spin parameter.
The spin value is constrained mainly by the lower boundary of the broad line,
which depends on the inner boundary of the disc emission where the gravitational redshift is maximal.
The position of the inner disc boundary is usually identified with the marginally stable orbit
which is related to the spin value. In this way the laor model can be used to estimate the spin value.
We investigate the consistency of the laor and kyrline models.
We find that the spin values evaluated by both models agree within the general uncertainties when applied on the current data.
However, the results are apparently distinguishable for higher quality data, such as those simulated for the
International X-ray Observatory (IXO) mission. We find that the laor model tends to overestimate the spin value
and furthermore, it has insufficient resolution which affects the correct determination of
the high-energy edge of the broad line.
Astronomical Institute of the Academy of Sciences, Prague, Czech Republic
Charles University, Faculty of Mathematics and Physics, Prague, Czech Republic
Astronomical Institute of the Academy of Sciences, Prague, Czech Republic
Introduction
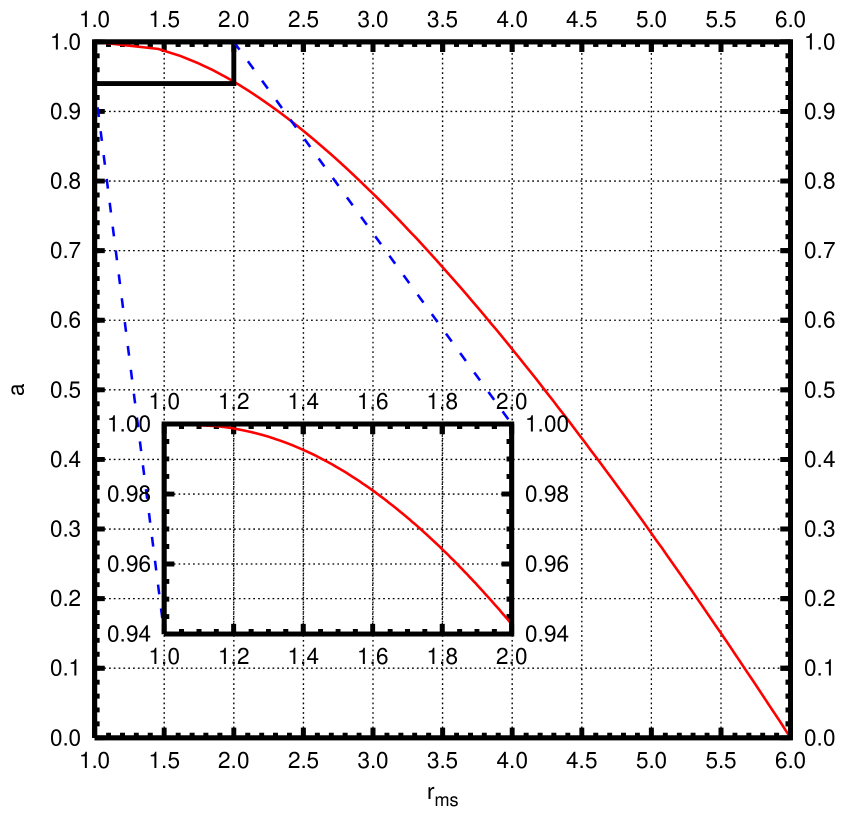
The broad emission iron lines are well-known features found in about two dozens of spectra of active galactic nuclei and black hole binaries. They are supposed to originate close to the black hole by the reflection of the primary radiation on the accretion disc. The spin of the black hole plays an important role in the forming of the line shape. Especially, it determines the position of the marginally stable orbit which is supposed to confine the inner edge of the accretion disc (see Figure 1). The innermost stable orbit occurs closer to a black hole with a higher spin value. However, the spin affects also the overall shape of the line.
Over almost two decades the most widely used model of the relativistic disc spectral line has been the one by Laor [1991], which includes the effects of a maximally rotating Kerr black hole. In other words, the laor model sets the dimensionless angular momentum to the canonical value of – so that it cannot be subject of the data fitting procedure. Dovčiak et al. [2004] have relaxed this limitation and allowed to be fitted in the suite of ky models. Other numerical codes have been developed independently by several groups (Beckwith and Done [2004], Čadež and Calvani [2005], Brenneman and Reynolds [2006]) and equipped with similar functionality.
However, the laor model can still be used for evaluation of the spin if one identifies the inner edge of the disc with the marginally stable orbit. In this case the spin is actually estimated from the lower boundary of the broad line. The comparison of the laor and kyrline model is shown in the right panel of Figure 1. The other parameters of the relativistic line models are inclination angle , rest energy of the line , inner radius of the disc , outer radius of the disc , emissivity parameters , with the break radius . The emissivity of the line is given by for and for . The angular dependence of the emissivity is characterized by limb darkening profile in the laor model. The kyrline model enables to switch between different emission laws. We used further two extreme cases, the kyrline with the same limb-darkening law as in the laor model and kyrline* with the limb-brightening law .
The aim of this paper is to compare the two models applied to the current data provided by the XMM-Newton satellite, and to the artificial data generated for the on-coming X-ray mission. For this purpose we have chosen two sources, MCG-6-30-15 and GX 339-4, which exhibit an extremely skewed iron line according to recently published papers (Vaughan and Fabian [2004], Miller et al. [2004]).
Observations and data reduction
We used the SAS software version 7.1.2 (http://xmm.esac.esa.int/sas) to reduce the XMM-Newton data of the sources. Further, we used standard tools for preparing and fitting the data available at http://heasarc.gsfc.nasa.gov (FTOOLS, XSPEC)
The galaxy MCG-6-30-15 is a nearby Seyfert 1 galaxy (). The skewed iron line has been revealed in the X-ray spectra by all recent satellites. The XMM-Newton observed MCG-6-30-15 for a long 350 ks exposure time during summer 2001 (revolutions 301, 302, 303). The spectral results are described in Fabian et al. [2002]. We joined the three spectra into one using the ftool MATHPHA.
The black hole binary GX 339-4 exhibited a strong broadened line in the 76 ks observation in 2002 (Miller et al. [2004]) when the source was in the very high state (for a description of the different states see Remillard and McClintock [2006]). The observation was made in the burst mode due to a very high source flux. The 97 of photons are lost during the reading cycle in this mode, which results into 2.25 ks total exposure time.111The broad iron line was also revealed in the analysis of the two 138 ks observations in spring 2004 by Miller et al. [2006], when the source was in the low-hard state. The EPIC pn camera was operating in the timing mode, MOS cameras in the full-frame mode. Using epatplot tool we found that it is not possible to avoid the pile-up by excluding the central part of the image of the source as described in the forementioned paper. Therefore we use only the very high state observation from 2002 in our analysis.
We rebinned all the data channels in order to oversample the instrumental energy resolution maximally by a factor of 3 and to have at least 20 counts per bin. The first condition is much stronger with respect to the total flux of the sources – erg cm-2 s-1 in 2–10 keV ( cts) for MCG-6-30-15 and erg cm-2 s-1 in 2–10 keV ( cts) for GX 339-4.
Iron line study of the MCG-6-30-15 spectrum
|
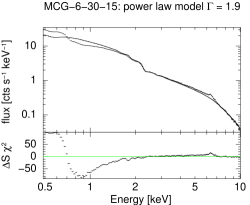
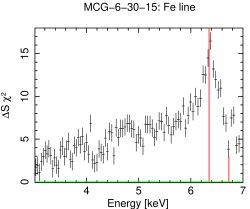
We used the same continuum model for the MCG-6-30-15 spectrum as presented in Fabian et al. [2002]: the simple power law component absorbed by neutral hydrogen with the column density cm-2. The overall spectrum with a detailed view of the iron line energy band is shown in Figure 2. The employed model is sufficient to fit the data above keV, which is satisfactory for our goal of the comparison of the relativistic line models.222Another components are needed to be added into the model in order to fully understand the spectrum. Several works have been done in this way, in the most recent one by Miller L. et al. [2008] the spectrum is characterized by an absorption in four different zones, which affects also the higher energy band where no broad line is needed any more. The value of the photon index is . The residuals are formed by a complex of a broad iron line and two narrow iron lines – one emission line at keV likely originating in a distant matter (torus) and one absorption line at keV which can be explained by a blueshifted absorption originating in an outflow. The rest energy of the broad line is keV, which corresponds to the helium-like ionized iron atoms.333The spectral complexity in the line band allows an alternative explanation – the model with two narrow emission lines at energies keV and keV. This alternative model leads to the presence of the broad line component at keV.
A good fit of the broad line was found with a broken power law line emissivity with a steeper dependence on the radius in the innermost region, which suggests a centrally localized corona. The goodness of the fit is constrained by the least squared method. The fit results in 2.5–9.5 keV are presented in Table 1. The values give comparable results for all employed models. The , where is the number of degrees of freedom which is related to the total number of energy bins and model parameters. The six independent parameters of the laor and kyrline models make the global minimum of rather wide with several local minima. Each model has a different tendency to converge to a different minimum. Hence, we did not compare only best fits of both models, but also the evaluated spin values by the kyrline and laor models when the other model parameters correspond to each other. The equivalent width of the line is eV. The errors in brackets presented in the table correspond to 90 confidence and are evaluated when the other parameters of the model are fixed. The realistic errors are higher because the model parameters further depend on the other parameters of the line and continuum models.
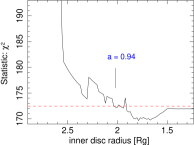
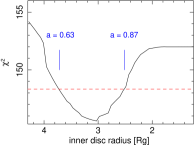
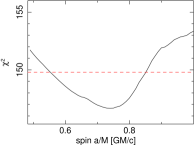
To catch up these relations we produce various contour graphs focusing on the determination of the spin value, taking into account the other parameters of the used model. The relations of the values on value of the spin (kyrline) or the inner disc radius (laor)
are shown in the left column of Figure 3. The x-axis is oppositely directed in the case of the inner disc radius as x-variable for an easier comparison with the kyrline results.
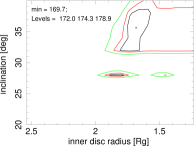
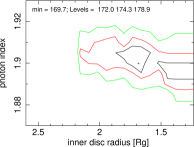
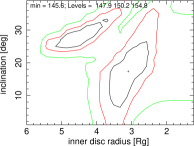
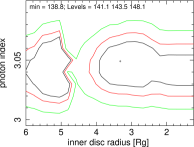
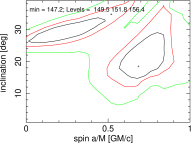
The contour graphs for the spin and the inclination angle are shown in the middle column of Figure 3. The underlying model was fixed in both cases. The plots in the right column of Figure 3 show the contours for the spin and the power law index.
Taking all of these into account, we obtain for the spin value:
| \@mkpreamc\@arstrut\@preamble | ||||
|---|---|---|---|---|
| parameter | kyrline | kyrline* | laor best | laor loc.min. |
| [deg] | ||||
| [keV] | ||||
| [eV] | ||||
 |
 |
 |
 |
 |
 |
 |
 |
 |
Iron line study of the GX 339-4 spectrum
|
The continuum of the X-ray spectrum of the black hole binaries is characterized by a power law and a multi-colour disc black-body component (powerlaw + diskbb in the XSPEC notation). The power law index suggested from the simultaneous RXTE measurements is (Miller et al. [2004]). However, we get an unacceptable fit with using the same model as in the analysis by Miller et al. [2004] or the re-analysis by Reis et al. [2008]. The difference of the results is likely due to a different grouping of the instrumental energy channels applied to the data. While we did not allow to oversample the instrumental energy resolution more than by factor of 3, in the previous works only the condition to have at least 20 counts per bin was used. This condition is very weak with respect to the total number of counts and the total number of energy channels in 2–10 keV and as a result, it practically does not force the data to be grouped. This leads to an excessive oversampling of the energy resolution, to large error bars in the flux and finally to an artificial decrease of the value. In the energy range 0.8–9 keV we get for the grouping with the only condition 20 counts per bin, and for the grouping taking the energy resolution into account. The value increased from to .
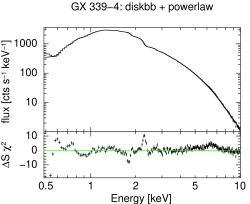
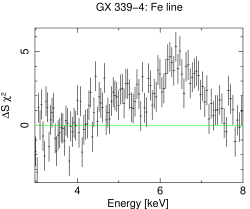
The absorption and emission features around keV have a significant effect on the goodness of the fit. These features can be linked with the Si and Au edges suggesting to be instrumental imprints. Hence, we added two gaussian lines into the model to improve the fit (). As a next step, we allowed the continuum parameters to float (and also removed the smedge model used in the previous works). The new model has in 0.8–9 keV and its parameter values are cm-2, and keV. We tried to add a reflection component into the model, as pexrav (pexriv) or refsch model, but without any improvements of the fit. The spectrum of GX 339-4 is shown in Figure 4 with a detailed view of the iron line band in the right panel. A broadened iron line feature is still present. However, due to different adopted value for the photon index of the power law the line is much weaker than the one presented in Miller et al. [2004].
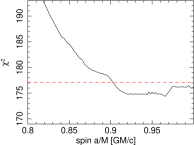
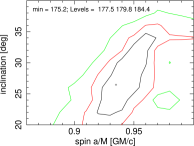
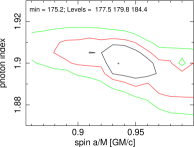
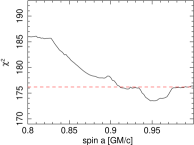
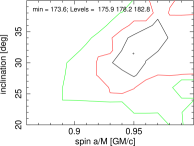
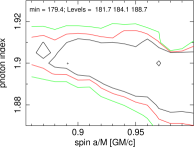
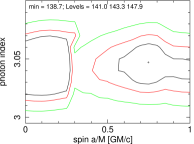
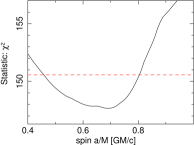
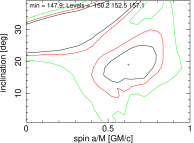
The fitting results of the line models in 3–9 keV are summarized in Table 2 and Figure 5. There are two minima found during the fitting procedure. We preferred the one which better corresponds to the results obtained by the independent radio and infrared measurements which constrained the inclination angle to be (Gallo et al. [2004]). The dependence of the goodness of the fit on the spin value is shown in the left column of Figure 5. The contour graphs for the spin and the inclination angle are depicted in the middle column, and for the spin and the power law photon index in the right column of Figure 5. The derived spin value is then:
 |
 |
 |
 |
 |
 |
 |
 |
 |
| parameter | kyrline | kyrline* | laor |
|---|---|---|---|
| [deg] | |||
| [keV] | |||
| [eV] |
| MCG-6-30-15 | GX 339-4 | |
| net cts/s | ||
| model cts/s | ||
| line cts/s | ||
| line cts | ||
| \@mkpreamc\@arstrut\@preamble | ||
| \@mkpreamc\@arstrut\@preamble | ||
 |
 |
 |
 |
Fitting of the simulated data of future X-ray missions
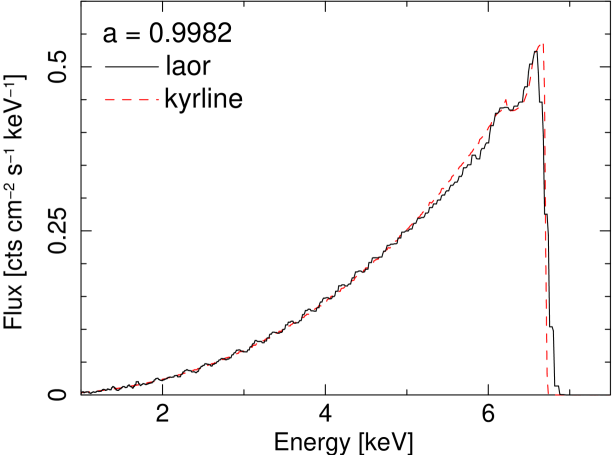
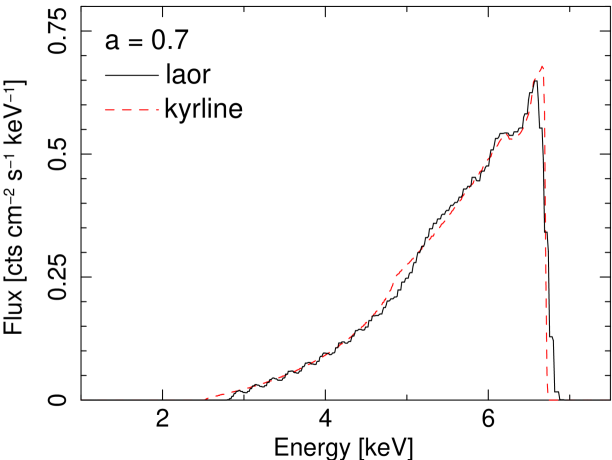
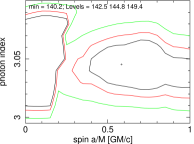
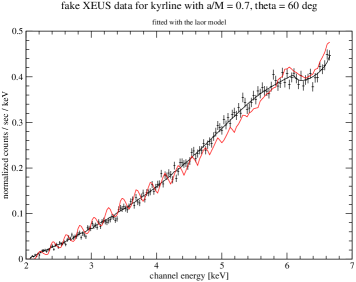
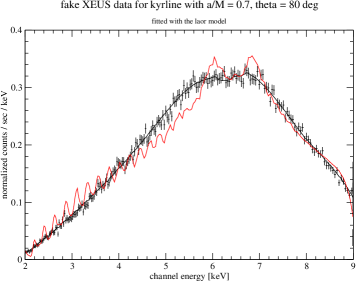
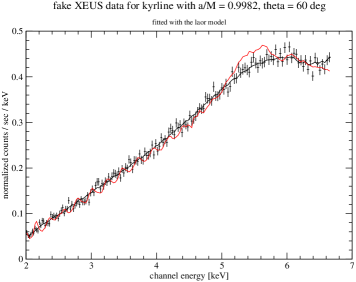
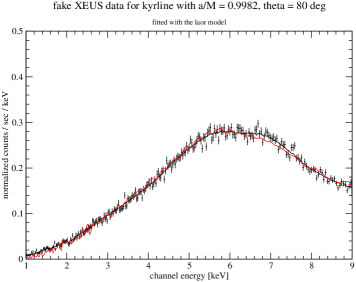
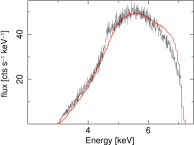
In this section we intend to apply the laor and kyrline models on the data with significantly higher quality supposed to be achieved by on-coming X-ray missions. The presently planned International X-ray Observatory (IXO) arised from the merging of the former XEUS and Constellation-X missions. Because the details of the IXO mission have not been fixed yet, we used a preliminary response matrix of the former XEUS mission (Arnaud et al. [2008]). We generated the data for a kyrline model with a rest energy of the line keV and radial disc luminosity that follows a power law with the index . We rebinned the data in order to have a resolution of eV per bin. We then fit the data in the 1–9 keV energy range with the laor model using the same initial values of the fitting parameters as for the data simulation. Due to insufficient resolution of the laor model, a significant problem appears at the high-energy edge of the broad line. This occurs because the next generation instruments achieve much higher sensitivity in the corresponding energy range. Therefore, we excluded the higher-energy drop of the lines from the analysis in order to reveal the differences in the overall shape of the line. We examined the artificial data for a grid of values of the angular momentum and the inclination angle. The results for , and , are shown in Figure 6. It is clearly seen from the figure that the effect of the spin on the shape of the line is sufficiently resolved by the higher quality data.
Further, we produced simulated data for the Seyfert galaxy MCG-6-30-15 and the black hole binary GX 339-4 using rather simplified models which were suitable to fit the current XMM-Newton data. For MCG-6-30-15 we used a power law model plus a kyrline model for the broad iron line, absorbed by neutral hydrogen: phabs * (powerlaw + kyrline). The parameters of the continuum are the column density cm-2, the photon index of the power law, and its normalization . The values of the line parameters are summarized in the KY value column of Table 4. The exposure time was chosen as ks and the flux of the source as erg cm-2 s-1 in the 2–10 keV energy range (i.e. cts).
For GX 339-4 we used phabs * (diskbb + powerlaw + kyrline) with cm-2, keV (), and (). The exposure time was chosen as ks, the flux of the source as erg cm-2 s-1 in the 2–10 keV energy range (i.e. cts).444The number of counts is two orders of magnitude higher than for the observation of the XMM-Newton satellite. The reason is due to the loss of 97% of the photons during the burst mode of XMM-Newton observation which eliminates the pile-up problem. The next generation X-ray missions are supposed to have a calorimeter instead of the CCD camera on-board which will get rid of such problems.
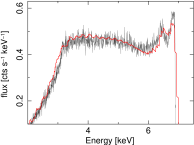
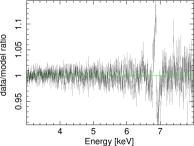
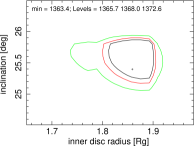
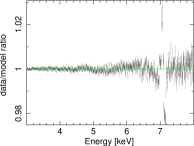
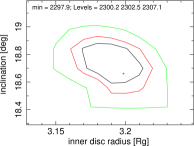
Prior to the spectral analysis we rebinned the data to have approximately a 5eV resolution (as it was planned for the XEUS instrument). We tested different grouping realizing that the discrepancies between the two models increase with larger grouping, but we can see apparent differences already for the most moderate rebinning. The results of the laor fit are shown in Table 4 and in Figure 7. The broad iron line component of the model is plotted in the left column. The continuum components of the model are not displayed there in order to clearly see the deflections of the laor model. The most prominent discrepancy appears at the higher-energy drop, which is clearly seen in the data/model ratio plot in the middle column of Figure 7. The model parameters are constrained with small error bars (see contours vs. in the right column of Figure 7), which clearly reveals a difference between the kyrline and the laor models.
The spin value derived from the analysis using the laor model is:
for MCG-6-30-15, while initially the spin value was , and
for GX 339-4, while initially the spin value was .
| \@mkpreamc\@arstrut\@preamble | ||||
|---|---|---|---|---|
| \@mkpreamc\@arstrut\@preamble | \@mkpreamc\@arstrut\@preamble | |||
| parameter | KY value | fitted value | KY value | fitted value |
| - | - | |||
| - | - | |||
 |
 |
 |
 |
 |
 |
Conclusions
We investigated the iron line band for two representative sources – MCG-6-30-15 (active galaxy) and GX 339-4 (X-ray binary). The iron line is statistically better constrained for the active galaxy MCG-6-30-15 due to a significantly longer exposure time of the available observations – for comparison of count rates of the sources see Table 3. The spectra of both sources are well described by a continuum model plus a broad iron line model. We compared modeling of the broad iron line by the two relativistic models, laor and kyrline. The kyrline model leads to a better defined minimum of for the best fit value. The confidence contour plots for versus other model parameters are more regularly shaped. This indicates that the kyrline model has a smoother adjustment between the different points in the parameter space allowing for more reliable constraints on . The laor model has a less accurate grid and is strictly limited to the extreme Kerr metric. The discrepancies between the kyrline and laor results are within the general uncertainties of the spin determination using the skewed line profile when applied to the current data. However, the results are apparently distinguishable for higher quality data, as those simulated for the XEUS mission. We find that the laor model tends to overestimate the spin value and furthermore, it has insufficient energy resolution which affects the correct determination of the high-energy edge of the broad line. The discrepancies in the overall shape of the line are more visible especially for lower values of the spin . As a side-product, we have found that the correct re-binning of the data with respect to the instrumental energy resolution is crucial to obtain statistically the most relevant results.
Acknowledgments. The present work was supported by the ESA Plan for European Cooperating States (98040).
References
Arnaud, M., Barcons, X., Barret, D., Bautz, M., Bellazzini, R., XEUS: the physics of the hot evolving universe, Experimental Astronomy, tmp, 24A, 2008
Beckwith, K., Done, C., Iron line profiles in strong gravity, Monthly Notices of Royal Astronomical Society, 352, 353, 2004
Brenneman, L. W., Reynolds, C. S., Constraining black hole spin via X-ray spectroscopy, Astrophysical Journal, 652, 1028, 2006
Čadež, A., Calvani, M., Relativistic emission lines from accretion discs around black holes, Monthly Notices of Royal Astronomical Society, 363, 177, 2005
Dovčiak, M., Karas, V., Yaqoob, T., An extended scheme for fitting X-ray data with accretion disc spectra in the strong gravity regime, Astrophysical Journal Supplements, 153, 205, 2004
Fabian, A. C., Vaughan, S. Nandra, K., Iwasawa, K., Ballantyne, D. R. et al., A long hard look at MCG-6-30-15 with XMM-Newton, Monthly Notices of Royal Astronomical Society, 335, L1, 2002
Gallo E., Corbel S., Fender R. P., A transient large-scale relativistic radio jet from GX 339-4, Monthly Notices of Royal Astronomical Society, 347L, 52G, 2004
Laor, A., Line profiles from a disk around a rotating black hole, Astrophysical Journal, 376, 90, 1991
Miller, J. M., Fabian, A. C., Reynolds, C. S., Nowak, M. A., Homan, J. et al., Evidence of Black Hole Spin in GX 339-4: XMM-Newton/EPIC-pn and RXTE Spectroscopy of the Very High State, Astrophysical Journal, 606, L131, 2004
Miller, J. M., Homan, J., Steeghs, D., Rupen, M., Hunstead, R. W. et al., A Long, Hard Look at the Low/Hard State in Accreting Black Holes, Astrophysical Journal, 653, 525, 2006
Miller, L., Turner, T. J., Reeves, J. N., An absorption origin for the X-ray spectral variability of MCG-6-30-15, Astronomy & Astrophysics, 483, 437, 2008
Reis, R. C., Fabian, A. C., Ross, R., Miniutti, G., Miller, J. M., Reynolds, C. S., A systematic look at the Very High and Low/Hard state of GX 339-4: Constraining the black hole spin with a new reflection model, arxiv:0804.0238, 2008
Remillard, R. A. and McClintock, J. E., X-ray Properties of Black Hole Binaries, Annual Review of Astronomy & Astrophysics, 49, 2006
Vaughan, S., Fabian, A. C., A long hard look at MCG-6-30-15 with XMM-Newton - II. Detailed EPIC analysis and modelling, Monthly Notices of Royal Astronomical Society, 348, 1415, 2004