An Intermediate Luminosity Transient in NGC 300: The Eruption of a Dust-Enshrouded Massive Star
Abstract
We present multi-epoch high-resolution optical spectroscopy, UV/radio/X-ray imaging, and archival Hubble and Spitzer observations of an intermediate luminosity optical transient recently discovered in the nearby galaxy NGC 300. We find that the transient (NGC 300 OT2008-1) has a peak absolute magnitude of mag, intermediate between novae and supernovae, and similar to the recent events M85 OT2006-1 and SN 2008S. Our high-resolution spectra, the first for this event, are dominated by intermediate velocity ( km s-1) hydrogen Balmer lines and Ca II emission and absorption lines that point to a complex circumstellar environment, reminiscent of the yellow hypergiant IRC+10420. In particular, we detect broad Ca II H&K absorption with an asymmetric red wing extending to km s-1, indicative of gas infall onto a massive and relatively compact star (blue supergiant or Wolf-Rayet star); an extended red supergiant progenitor is unlikely. The origin of the inflowing gas may be a previous ejection from the progenitor or the wind of a massive binary companion. The low luminosity, intermediate velocities, and overall similarity to a known eruptive star indicate that the event did not result in a complete disruption of the progenitor. We identify the progenitor in archival Spitzer observations, with deep upper limits from Hubble data. The spectral energy distribution points to a dust-enshrouded star with a luminosity of about L⊙, indicative of a M⊙ progenitor (or binary system). This conclusion is in good agreement with our interpretation of the outburst and circumstellar properties. The lack of significant extinction in the transient spectrum indicates that the dust surrounding the progenitor was cleared by the outburst. We thus predict that the progenitor should be eventually visible with Hubble if the transient event marks an evolutionary transition to a dust-free state, or with Spitzer if the event marks a cyclical process of dust formation.
Subject headings:
stars:evolution — stars:mass loss — stars:circumstellar matter — stars:winds, outflows1. Introduction
In recent years dedicated searches and serendipitous discoveries have uncovered several optical transients with luminosities intermediate between the well-studied classes of nova eruptions ( mag) and supernova (SN) explosions ( mag). As can be expected from the wide gap in luminosity, these intermediate luminosity optical transients (hereafter, ILOTs111We prefer the neutral designation intermediate luminosity optical transient for this class of events since it does not impose a bias on the discovery method and initial mis-classification (as in the case of the “SN impostors” designation Van Dyk et al. 2000), it avoids various observational cuts on the optical properties (e.g., based on color as in the case of the “luminous red nova” designation Kulkarni et al. 2007) which may also be due to extrinsic effects (e.g., extinction), it is less cumbersome and more intuitive than designations based on prototype events (e.g., V838 Mon-like, Car analogs), and perhaps most importantly, it makes no assumption about an eruptive versus explosive origin (as in the case of the “luminous red novae” or “SN impostors”).) appear to be diverse in their properties and origins. Some have been classified as low luminosity core-collapse SNe, with inferred energies and 56Ni masses that are at least an order of magnitude below typical SN events (e.g., Pastorello et al. 2004). Others, sometimes initially classified as type IIn SNe, have been subsequently tagged with the catch-all designation of “SN impostors” (e.g., Van Dyk et al. 2000), that includes events resembling luminous blue variable (LBV) eruptions. Finally, a small number of somewhat dimmer events have been recently grouped under the proposed name “luminous red novae” (LRNe; Kulkarni et al. 2007), based on their red optical colors; the origin of LRNe and their relation to each other remain unclear. Overall, the various groupings have been subject to debate, and there is no clear agreement about the nature of individual objects or the degree of overlap between the various designations.
Equally important, the connection between the different types of events and different classes of progenitors remains unclear. For example, some LBV eruptions have been initially classified as SNe (e.g., SNe 1961V and 1954J; Goodrich et al. 1989; Van Dyk et al. 2005). Similarly, the progenitor of the recent event SN 2008S, which was detected in archival Spitzer Space Telescope images, has been argued to be an extreme AGB star (Prieto et al. 2008; Thompson et al. 2008) or an LBV (Smith et al. 2008). The nature of the event itself is also unclear, with claims of a low mass electron-capture SN (Thompson et al. 2008) and an LBV-like outburst (Smith et al. 2008). The recent event M85 OT2006-1, and the possibly related eruptive object V838 Mon, have been speculated to possibly result from stellar mergers (Munari et al. 2002; Soker & Tylenda 2006; Kulkarni et al. 2007), but other possibilities have been proposed such as a low-luminosity SN for M85 OT2006-1 (Pastorello et al. 2007), and an AGB pulse, nova eruption from an embedded common envelope white dwarf, or planet capture for V838 Mon (e.g., Retter et al. 2006 and references therein).
Regardless of the exact interpretation, it is clear that the various proposed eruption/explosion scenarios mark important phases in the evolution of massive stars, possibly on the path to diverse types of SNe. Therefore, a mapping between ILOTs and their progenitors will provide important constraints on the initial conditions (i.e., progenitors and circumstellar properties) of SN explosions. The present uncertainty in this mapping highlights the need for detailed observations that can uncover the conditions both prior to and during the ILOT events. These include the identification of progenitors, a detailed study of the circumstellar environment, and measurements of the event properties across the electromagnetic spectrum. Such observations will also allow us to determine the connection between the various proposed categories of ILOTs, and to map the overall diversity of this seemingly heterogeneous class.
In this paper we present such a combination of observations for an ILOT discovered in the nearby galaxy NGC 300 on 2008 April 24 UT (hereafter, NGC 300 OT2008-1). For the first time for such an event, we combine multi-wavelength observations (UV, optical, radio, and X-rays), high-resolution echelle spectroscopy, and archival Hubble Space Telescope and Spitzer Space Telescope data to show that NGC 300 OT2008-1 was the result of an eruption from a M⊙ dust-obscured and relatively compact star, possibly in a binary system. Our high-resolution spectra, the first for this event, resemble the yellow hypergiant star IRC+10420 (see also Bond et al. 2009), suggesting that NGC 300 OT2008-1 may mark a transition to a similar evolutionary stage. A comparison to the recent events SN 2008S and M85 OT2006-1 shows that all three events may have originated from the same phenomenon, but with a scatter in the energy release and circumstellar properties, that may point to a range of progenitor masses.
2. Observations
NGC 300 OT2008-1 was discovered by Monard (2008) on 2008 Apr 24.16 UT in the outskirts of the nearby galaxy NGC 300 ( Mpc; Gieren et al. 2005) with an apparent brightness of 16.5 mag (unfiltered). Subsequent observations on May 14.14 UT revealed that the object had brightened to about 14.2 mag (Monard 2008). NGC 300 OT2008-1 was not detected in observations from 2008 Apr 17.1 UT, but only to a limit of 15.5 mag. It was also not detected in deeper observations taken on 2007 Dec 30.8 and 2008 Feb 8.75 UT to limiting magnitudes of 18.5 and 18.0 mag, respectively (Monard 2008). Since the transient was brightening at the discovery epoch, we adopt an event start time that is consistent with the most recent non-detection, Apr 17 UT but note that the actual start time may have occurred earlier.
A low resolution spectrum of NGC 300 OT2008-1 obtained by Bond et al. (2008) on May 15.4 UT revealed emission lines corresponding to H, H, the Ca II IR triplet, and the [Ca II] doublet (see also Bond et al. 2009). The marginally-resolved lines indicated velocities of km s-1, significantly lower than those of both classical novae and supernovae.
Following the announcement of the discovery and early spectroscopy, and given the unique opportunity to study a nearby ILOT in detail, we initiated observations across the electromagnetic spectrum, particularly high-resolution spectroscopy. In addition, we obtained archival Hubble Space Telescope and Spitzer Space Telescope observations at the position of the transient to search for a pre-discovery counterpart.
2.1. Astrometry
The original reported position of NGC 300 OT2008-1 was 00h54m34.16s, (J2000), measured relative to the core of NGC 300 (Monard 2008). As part of our initial spectroscopic observations we obtained an -band image of the field with the Low Dispersion Survey Spectrograph (LDSS-3) mounted on the Magellan/Clay 6.5-m telescope. Using 13 objects in common with the Naval Observatory Merged Astrometric Dataset (NOMAD), we measure the actual position of the transient to be 00h54m34.52s, (J2000) with an uncertainty of about in each coordinate. This position is west and south of the IAUC position. The revised coordinates allowed us to search for a progenitor in archival HST observations, and led Thompson et al. (2008) to identify a counterpart in archival Spitzer observations (see §6).
2.2. Optical Spectroscopy
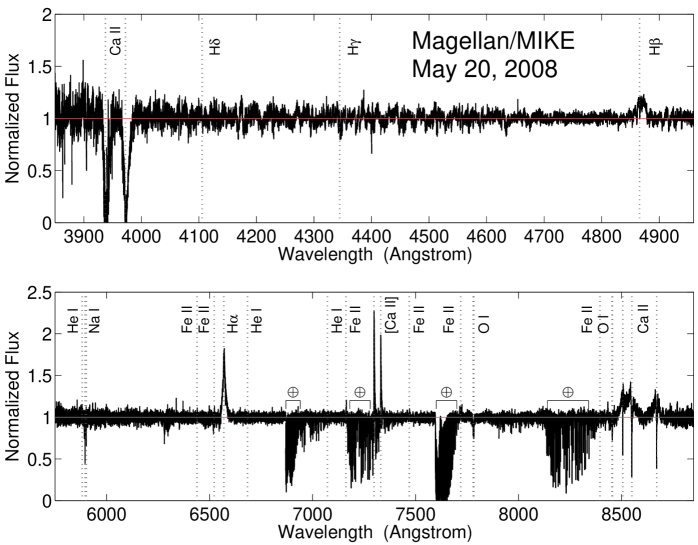
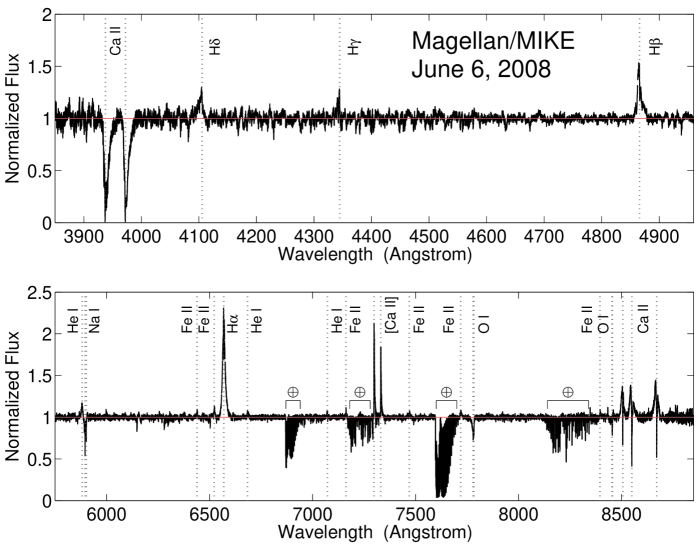
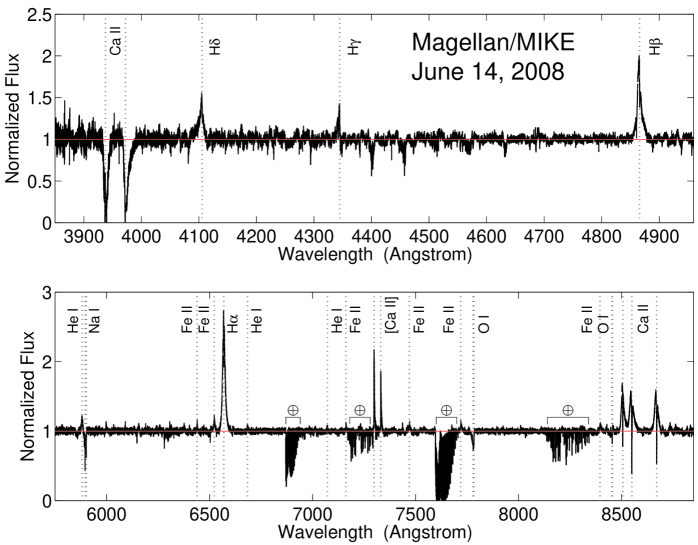
We obtained multiple low- and high-resolution optical spectra of NGC 300 OT2008-1 using LDSS-3 and the Magellan Inamori Kyocera Echelle (MIKE) spectrograph mounted on the Magellan/Clay 6.5-m telescope. A log of the observations, including the spectral coverage and resolution is provided in Table 1.
The LDSS-3 spectra were reduced using standard IRAF routines, while rectification and sky subtraction were performed using the method and software described in Kelson (2003). Wavelength calibration was performed using HeNeAr arc lamps, and air-to-vacuum and heliocentric corrections were applied. Flux calibration was performed using several spectrophotometric standard stars. The MIKE spectra were reduced using a custom reduction pipeline222http://www.ociw.edu/Code/mike written in Python. Wavelength calibration was performed using ThAr arc lamps, and air-to-vacuum and heliocentric corrections were applied.
2.3. Ground-based Optical Imaging
2.4. Swift Ultraviolet and Optical Imaging
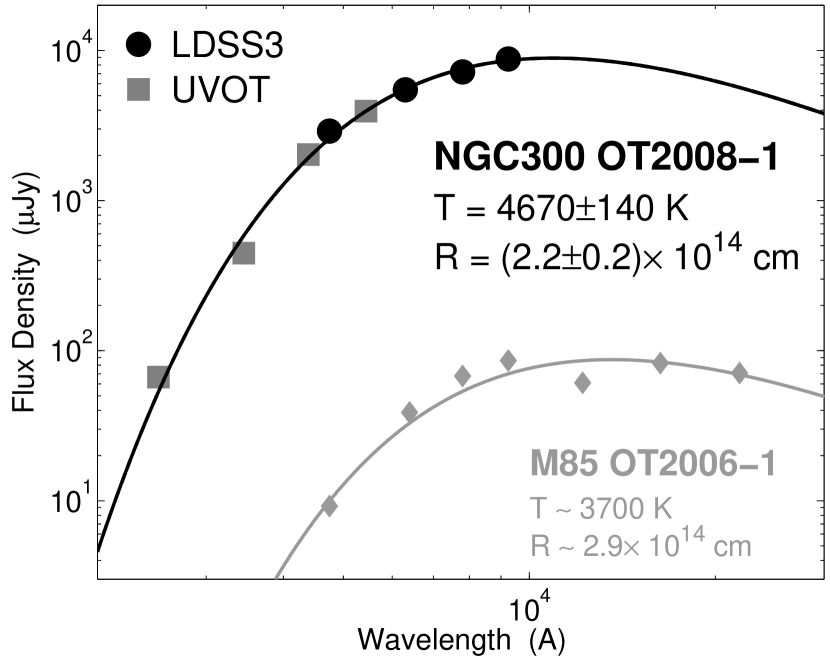
We obtained UV and optical observations with the Swift UV/optical telescope spanning from 2008 May 20 to October 15; see Table 2. The data were processed using standard routines within the HEASOFT package. Photometry of the transient in the UVW1 and images was performed using the standard aperture; the source was not clearly detected in the UVW2 images. The light curves are shown in Figure 2, and the spectral energy distribution at the epoch of the LDSS-3 observations is shown in Figure 1.
2.5. X-rays
Simultaneous with the Swift/UVOT observations, data were also collected with the co-aligned X-ray Telescope for a total exposure time of 20.01 ks. No source is detected at the position of NGC 300 OT2008-1 to a limit of erg s-1 cm-2, where we have assumed a keV thermal bremsstrahlung model and Galactic absorption, cm-2. A power law model with a photon index of leads to a similar limit of erg s-1 cm-2. The corresponding limit on the luminosity is erg s-1. This is lower by at least an order of magnitude than any X-ray detected supernova to date.
2.6. Radio
We observed NGC 300 OT2008-1 with the Very Large Array333The National Radio Astronomy Observatory is a facility of the National Science Foundation operated under cooperative agreement by Associated Universities, Inc.) beginning on 2008 May 21.65 UT. No coincident radio source was detected to a limit of Jy () at 8.46 GHz. Continued monitoring at frequencies between 4.86 and 22.5 GHz over the subsequent seven months revealed no radio emission, with the latest non-detection obtained on 2008 November 24 UT ( Jy at 8.46 GHz). The upper limits imply a radio luminosity erg s-1 Hz-1. This limit is at least two orders of magnitude below the least luminous radio SNe ever observed (type IIp SNe: Chevalier et al. 2006; type Ibc SN 2002ap Berger et al. 2002). It is also two orders of magnitude below the detected emission from the “SN impostor” SN 1961V (Stockdale et al. 2001).
3. Basic Properties of NGC 300 OT2008-1
The UV/optical spectral energy distribution (SED) on 2008 May 31 is shown in Figure 1. The data have been corrected for the low Galactic extinction, mag (Schlegel et al. 1998). We find that the SED is well fit by a blackbody spectrum ( for 5 degrees of freedom) with a temperature of K and a radius of cm. The best-fit value of the host galaxy extinction is mag, with a upper limit of mag. As we show below, the low intrinsic dust extinction is supported by our detection of weak interstellar Na I D absorption lines at the redshift of NGC 300, from which we infer negligible line of sight extinction, mag.
Using an event start date of April 17 and assuming a constant expansion rate, the inferred velocity is about 600 km s-1, in good agreement with our measured velocity width of the H emission line, km s-1 (see §4).
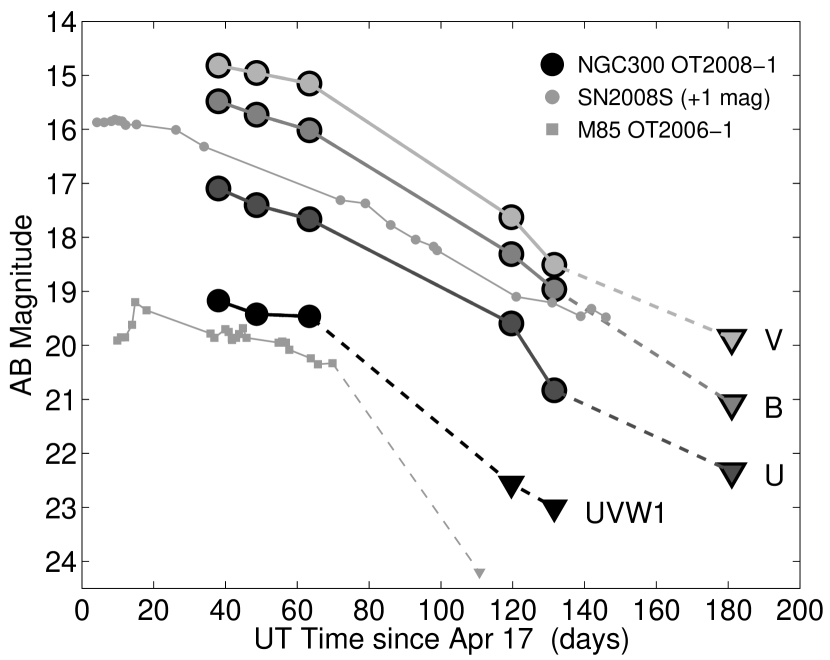
The optical/UV “bolometric” luminosity of NGC 300 OT2008-1 on May 31 is erg s-1, or mag. This is about 4 magnitudes brighter than typical novae, and about mag fainter than SNe (e.g., Kulkarni et al. 2007). The optical/UV emission fades slowly to d with a decline rate of about 0.02 mag d-1 (Figure 2). However, observations at d reveal significant steepening relative to the early decay rate, indicating a break in the light curves at d (detailed optical and near-IR light curves are presented in Bond et al. 2009). We return to this point in §8.
Using a roughly constant luminosity out to d, we find that the total radiated energy is about erg. Therefore, the outflow kinetic energy is at least as large, indicating an ejected mass of M⊙. The combination of low ejecta velocity and an intermediate luminosity suggest that NGC 300 OT2008-1 is not a true SN explosion. Indeed, its luminosity is nearly an order of magnitude lower than even the claimed low-luminosity core-collapse SNe 1994N, 1997D, 1999br, 1999eu, and 2001dc, with erg s-1 at d (Pastorello et al. 2004).
4. Spectroscopic Properties
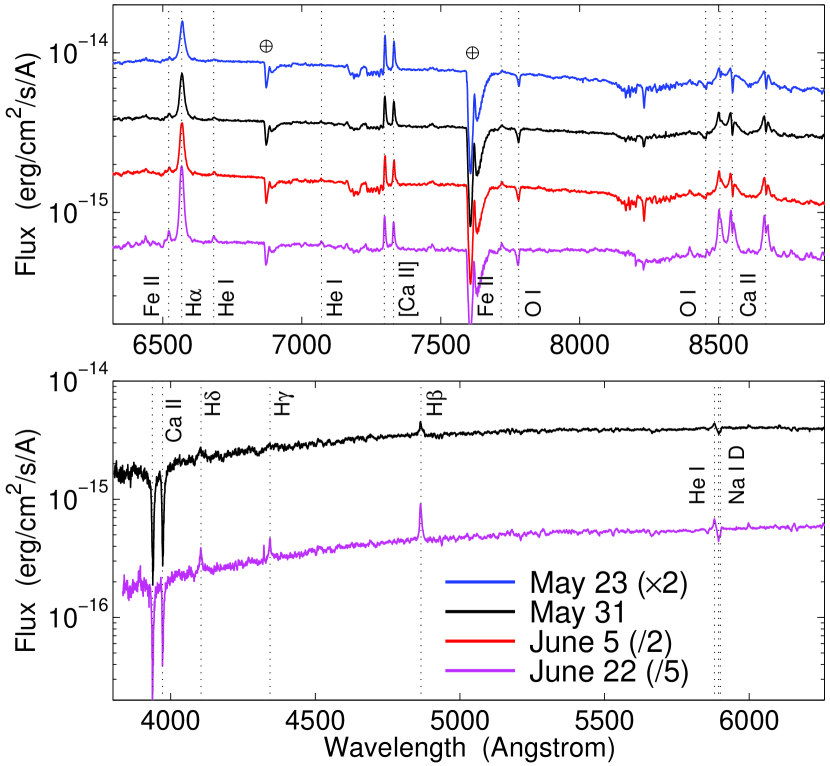
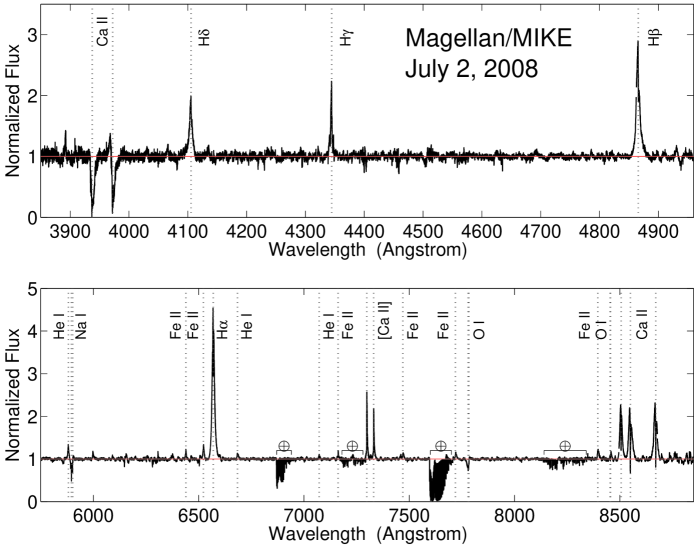
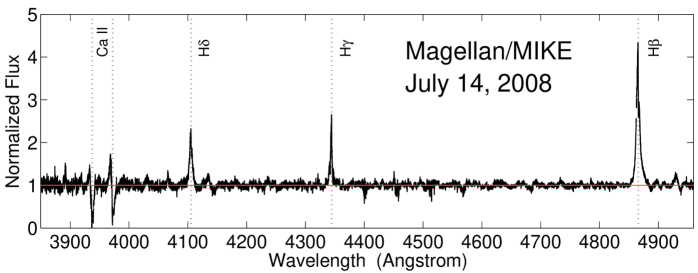
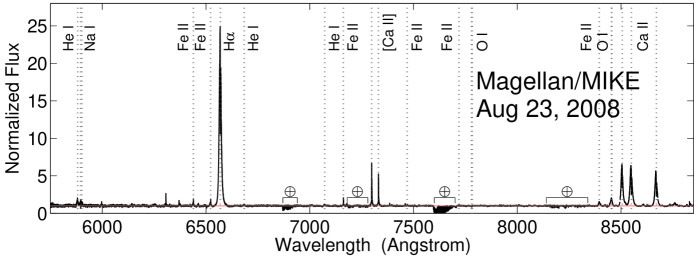
The low-resolution spectra of NGC 300 OT2008-1 are shown in Figure 3. Convolution of the spectrum from May 31 with the transmission functions of the filters indicates that the flux calibration across the full spectral range is good to better than . The most pronounced spectral features are the hydrogen Balmer emission lines, the [Ca II] doublet and the Ca II IR triplet in emission, and Ca II H&K in absorption. We additionally detect weak He I and Fe II emission lines, as well as O I and Na I in absorption. A full list of the lines detected at each epoch is provided in Table 4.
4.1. Hydrogen Balmer Lines
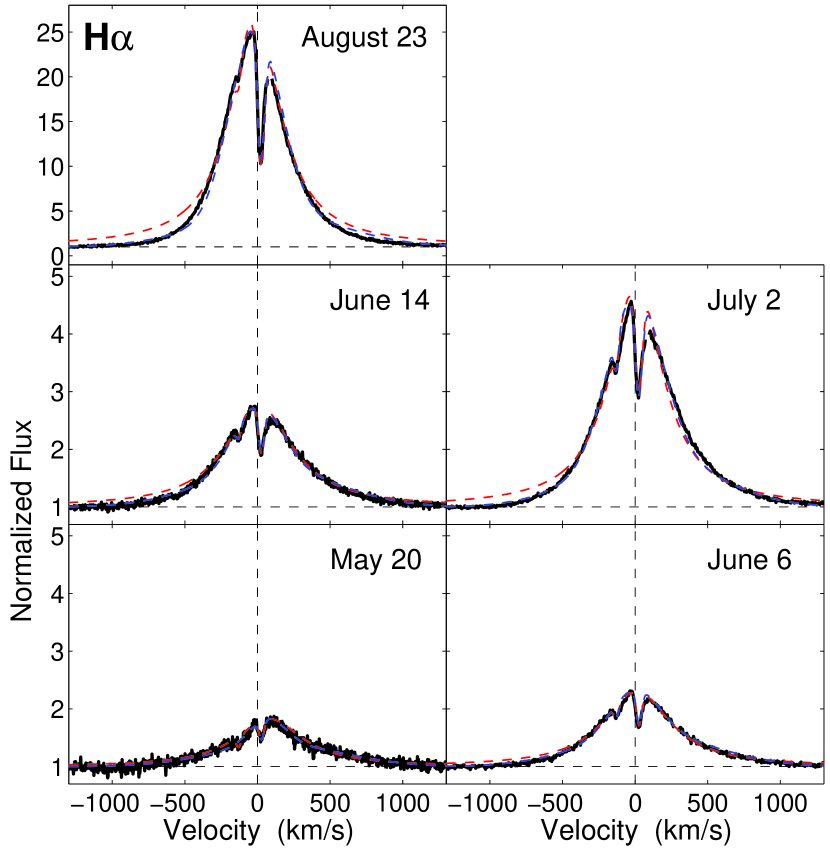
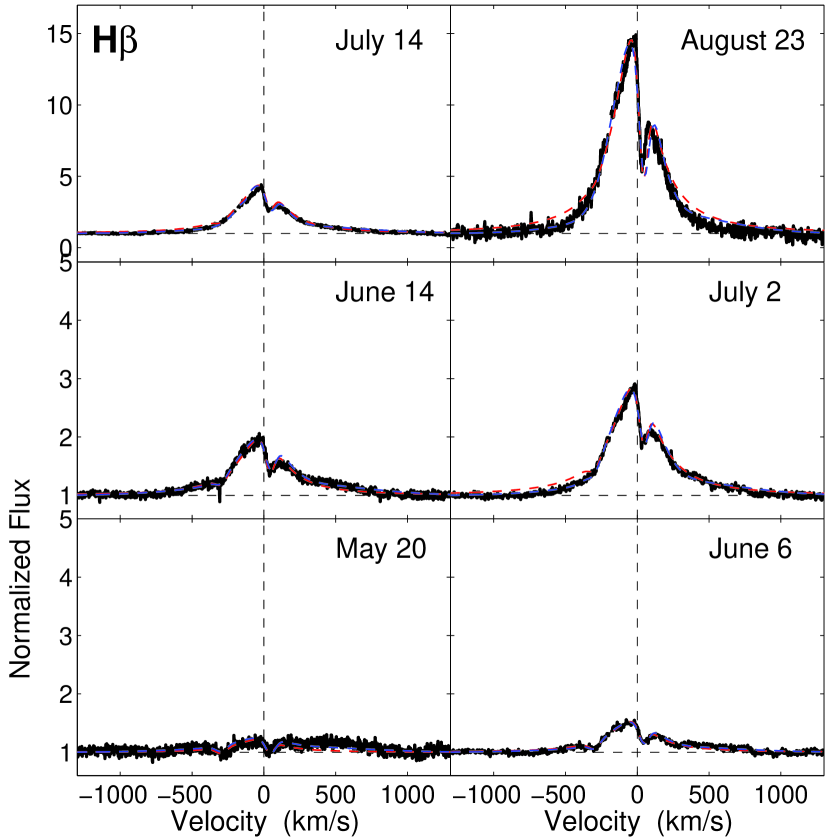
The H line is best fit by a Lorentzian profile with a velocity width (FWHM) of km s-1; see Figure 4. The full width at continuum intensity (FWCI) is km s-1. The width of the line is indicates an expansion velocity of about 600 km s-1, in good agreement with our size and eruption date estimates (§3).
The H flux remains relatively unchanged for the first 2 months, with erg s-1 cm-2. The H line flux is erg s-1 cm-2, leading to . This value is well in excess of expected for case B recombination (at K appropriate for the SED temperature of NGC 300 OT2008-1; §3). A large Balmer decrement may be due to dust extinction, but as we already showed above (and see also §5.1) the line of sight extinction to NGC 300 OT2008-1 is negligible. Instead, we conclude that the large Balmer decrement is due to interaction with a high density circumstellar environment, through a combination of Balmer self absorption and collisional excitation (Drake & Ulrich 1980). The observed ratio is indeed in good agreement with circumstellar interaction models (e.g., Chevalier & Fransson 1994).
Using the calculations of Drake & Ulrich (1980) for hydrogen emission at high electron densities, we find that the observed ratio requires a density of cm-3. At this range of densities we expect the H line to be suppressed to a minimum ratio of (compared to 0.45 for case B recombination). Our non-detection of H on May 31, with , and the detection on June 22 with support this conclusion. We note that the observed ratio (June 22) is somewhat higher than the expected value of about 0.1. We thus conclude that the Balmer lines arise from circumstellar interaction between the event ejecta and the pre-existing environment.
The H luminosity resulting from circumstellar interaction is given by erg s-1, where we have assumed a shell with and selected fiducial parameters for NGC 300 OT2008-1 as inferred above ( cm-3 and cm). Comparing with the observed H luminosity of erg s-1, we find that cm-3 and , in reasonable agreement with the values inferred from the Balmer line ratios and the blackbody fit to the SED. The shocked circumstellar material has an inferred mass of M⊙. For a uniform wind with a constant velocity, , this corresponds to a mass loss rate of M⊙ yr-1, where km s-1. As a sanity check, we find that the inferred Thomson optical depth for these parameters is low, .
To summarize, the hydrogen Balmer emission line properties, coupled with the optical/UV spectral energy distribution, are indicative of an interaction between a low mass shell traveling at about 600 km s-1 with a high density circumstellar medium, resulting from a progenitor mass loss rate of M⊙ yr-1.
4.2. Ca II Lines
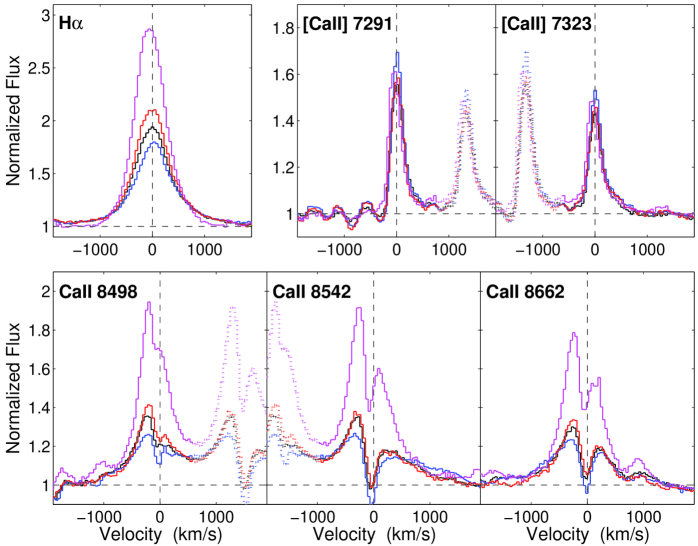
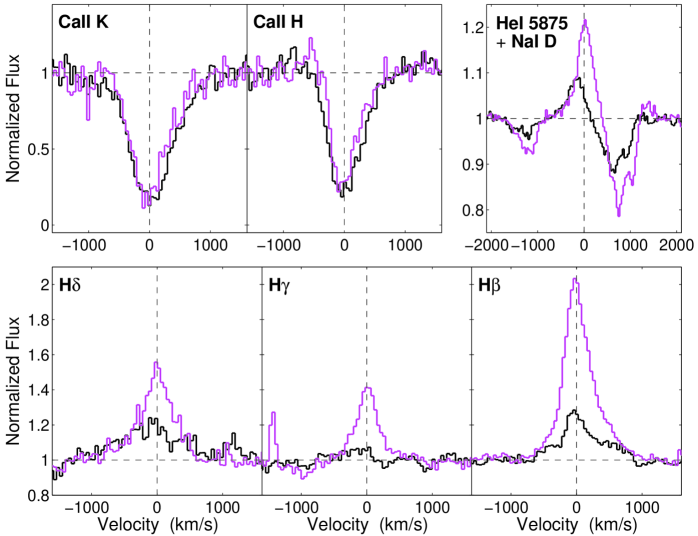
We next turn to an investigation of the unusual Ca II permitted and forbidden lines, which are not generally detected in SN spectra (particularly at early time). As shown in Figure 4, the [Ca II] lines are significantly narrower than the H line, with km s-1. Moreover, the lines are clearly asymmetric, ranging at continuum intensity from to km s-1. We do not find any clear evolution in the line brightness and profile between May 23 and June 22 UT.
The Ca II IR triplet lines also exhibit a complex structure, with an overall symmetric profile, marked by strong absorption near the line center. The observed brighter blue wing indicates that the center of the absorption feature is redshifted relative to the emission center. We measure this shift to be about 80 km s-1. The overall width of the lines is km s-1, while the (unresolved) absorption component has km s-1.
Finally, the Ca II H&K absorption lines exhibit an asymmetric profile with an extended red wing; see Figure 5. The overall velocity range at continuum intensity in the May 31 spectrum is to km s-1. The lines appear to be somewhat narrower in the later spectrum from June 22. The large velocity width of the lines indicates that they are not interstellar in origin, but instead arise in the circumstellar environment. However, the fact that we observe in absorption gas that is both inflowing (red wing) and outflowing (blue wing), indicates that the lines do not arise exclusively from an outgoing wind associated with the eruption; in that case we would expect only the outflowing (blue) component to be observed in absorption.
The existence of material inflowing along the line of sight to NGC 300 OT2008-1 at velocities of up to km s-1 can be explained as the result of: (i) gas infall from a previous eruption; or (ii) as the signature of wind outflow from a companion star impinging on the progenitor of NGC 300 OT2008-1. In the former scenario, the observed infall velocity, which we expect to be close to the progenitor’s escape velocity, points to a massive and compact star such as a Wolf-Rayet star or a blue supergiant; the velocity is much larger than would be expected for a red giant, a red supergiant, or an asymptotic giant branch (AGB) progenitor as proposed by Thompson et al. (2008) and Bond et al. (2009). In the latter scenario, the companion would have to satisfy the same constraints (massive and compact) in order to launch a wind with km s-1. However, as we show in §6, the total progenitor system mass is in the range of M⊙, making it difficult to accommodate an early-B or O star companion as required from the km s-1 wind velocity (Lamers et al. 1995).
5. High Resolution Spectroscopy
The general spectral properties outlined in the previous section are borne out in much greater detail and complexity in our high resolution spectra; see Figures 6–11. These are the first such observations available for NGC 300 OT2008-1. We further stress that neither M85 OT2006-1 nor SN 2008S, which appear to share similar properties, have been observed at high spectral resolution so this is the first chance to investigate the properties of an ILOT in detail.
5.1. Extinction from the Na I D Lines
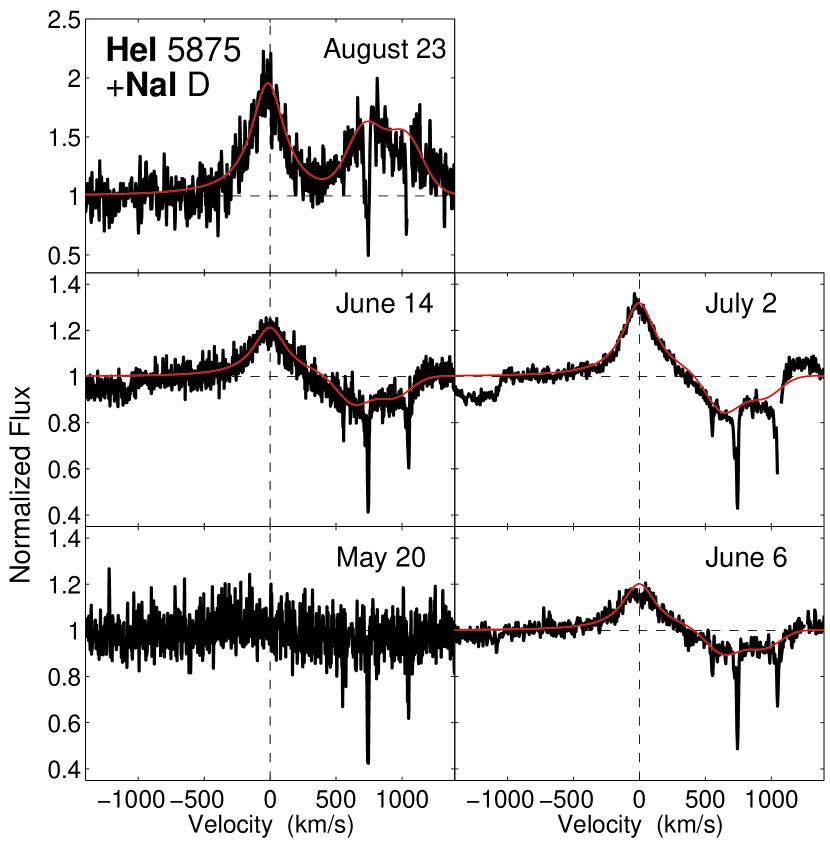
Before we proceed with an analysis of the broad lines associated with the event itself, we use the Na I D absorption lines to determine the line of sight extinction within NGC 300. In the May 20 spectrum we detect unresolved lines with the expected ratio of equivalent widths (0.17 and 0.08 Å), indicating that they are optically thin; see Figure 12. We find no evidence for variation in the line profiles between the various epochs. From the narrowness and lack of variability we conclude that the lines are interstellar in origin. The measured equivalent widths correspond to a negligible line of sight extinction of mag (Munari & Zwitter 1997). This inference is in good agreement with the lack of obvious extinction evidences in the optical/UV spectral energy distribution.
In the spectra between June 6 and July 2 we further detect broad Na I D absorption, with km s-1 (Figure 12). The lines are observed in emission in the spectrum from August 23 with a similar velocity width. The maximum absorption equivalent width is about 0.5 Å in the July 2 spectrum, close to the saturation limit of the relation between extinction and Na I D equivalent width. The allowed range of for this value is mag, in rough agreement with the upper limit of mag inferred from the SED of NGC 300 OT2008-1 (§3). We stress, however, that the relation between extinction and Na I D equivalent width is calibrated in the interstellar medium, and there is therefore no reason that it should equally hold in the complex circumstellar environment of NGC 300 OT2008-1, particularly in the presence of bright UV emission from the eruption itself. Indeed, as we show below, we find definitive evidence for dust destruction, which would undoubtedly alter the nature of the relation.
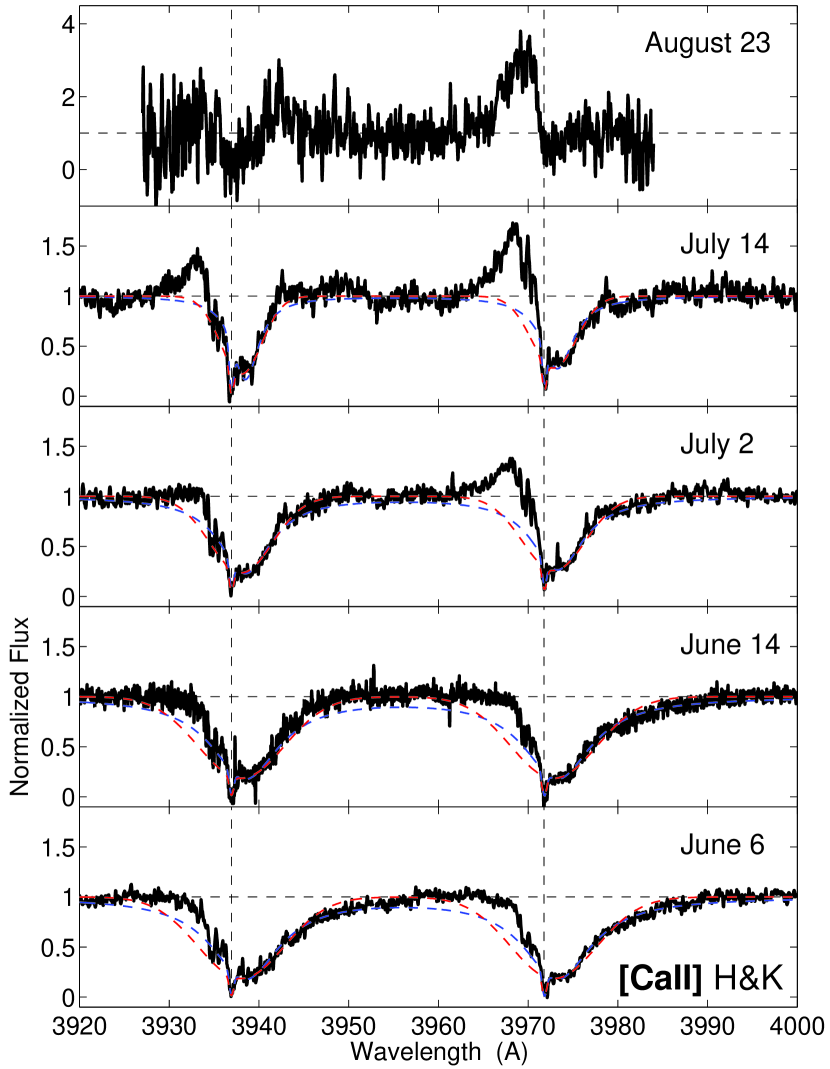
5.2. Ca II H&K Lines
The broad and asymmetric Ca II H&K absorption lines are perhaps the most striking aspect of the spectrum (Figure 13). From the high resolution spectrum obtained on June 6 we find that the red wing of the lines is best modeled with a Lorentzian profile centered at km s-1 relative to the narrow component (the systemic velocity), and with a width of km s-1; a Gaussian profile with km s-1 provides a reasonable fit to the red wing as well. An extension of these profiles to the blue wing of the H&K lines significantly over-estimates the line absorption (Figure 13). The blue wing itself is well fit by a Lorentzian with a width of km s-1.
It is unclear whether the two Ca II H&K absorption components (red and blue wings) arise in physically distinct regions (with the red side that corresponds to the blue component perhaps contributing to the red wing), or whether they arise from a kinematically asymmetric distribution of a single absorbing component. In the former case, we interpret the line profiles to arise from the presence of both outflowing and inflowing gas in the circumstellar environment due to distinct mass loss episodes, fragmentation of a previously ejected shell, or the prsenence of a binary companion wind. This scenario is similar to the model proposed by Humphreys et al. (2002) for the yellow supergiant star IRC+10420, in which recombined gas no longer responds to radiation pressure, leading to infall at roughly the escape velocity. The measured infall velocity of km s-1 is significantly higher than km s-1 for absorption features in IRC+10420 Humphreys et al. (2002), indicating that the progenitor has a higher escape velocity (i.e., it is significantly more compact).
Subsequent echelle spectra reveal significant evolution in the Ca II H$K line profiles. First, the red absorption wing becomes progressively narrower with time, from about km s-1 on June 6 to about km s-1 on July 14. At the same time, the blue absorption wing becomes narrower and eventually starts to be overtaken by emission with a FWCI width of about 500 km s-1 so that the overall line profile eventually resembles a reversed P Cygni profile. Both aspects of the line evolution can be explained as the result of recombination of Ca++ gas produced through shocking of the initially absorbing gas by the eruption’s outflowing material. In this scenario, the blue-shifted (outflowing) gas and the highest velocity inflowing gas are located physically closer to the progenitor, while the lower velocity infalling material will be eventually overtaken by the shock at a later time. A hint of this effect is seen in the low signal-to-noise spectrum from August 23, in which very little absorption in the red wing of the H&K lines is observed. The same process can also explain the shift from absorption to emission in the Na I D lines.
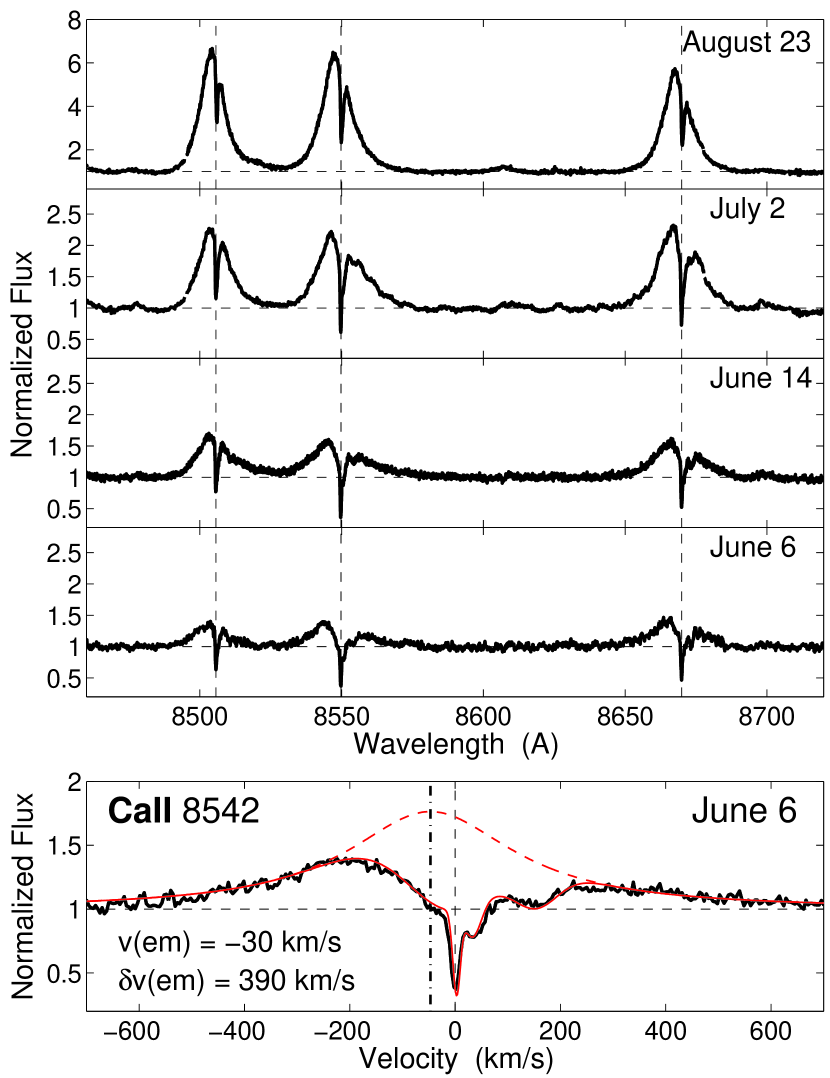
5.3. Ca II IR Triplet
The low-resolution spectra of NGC 300 OT2008-1 showed that the Ca II triplet emission lines are marked by broad absorption features offset to the red from the emission line center. At high resolution, the line profile is more complex, and the absorption is separated into multiple components; see Figure 14. In particular, in the June 6 spectrum there appear to be three distinct absorption components in addition to a narrow (interstellar) component, with velocity widths of 200, 100, and 40 km s-1. All three components are centered redward of the emission line peak, by 30, 200, and 80 km s-1, respectively. However, in our final spectrum from August 23, the line profiles become simpler, with just a single absorption component redshifted relative to the emission line center. This may again point to the presence of an initially complex circumstellar environment, which is partially overtaken and shocked by the outflowing ejecta.
The emission lines are symmetric and have a relatively constant width of km s-1 in the various epochs. Since the ionCa2 IR lines are produced through radiative de-excitation from an excited state that is populated through absorption in the Ca II H&K lines, we expect the overall kinematic profiles of the H&K lines and the IR lines to match. However, the situation appears to be more complex here since the broad red absorption wing of the H$K lines does not appear to have a clear emission counterpart in the IR lines.
5.4. [Ca II] Lines
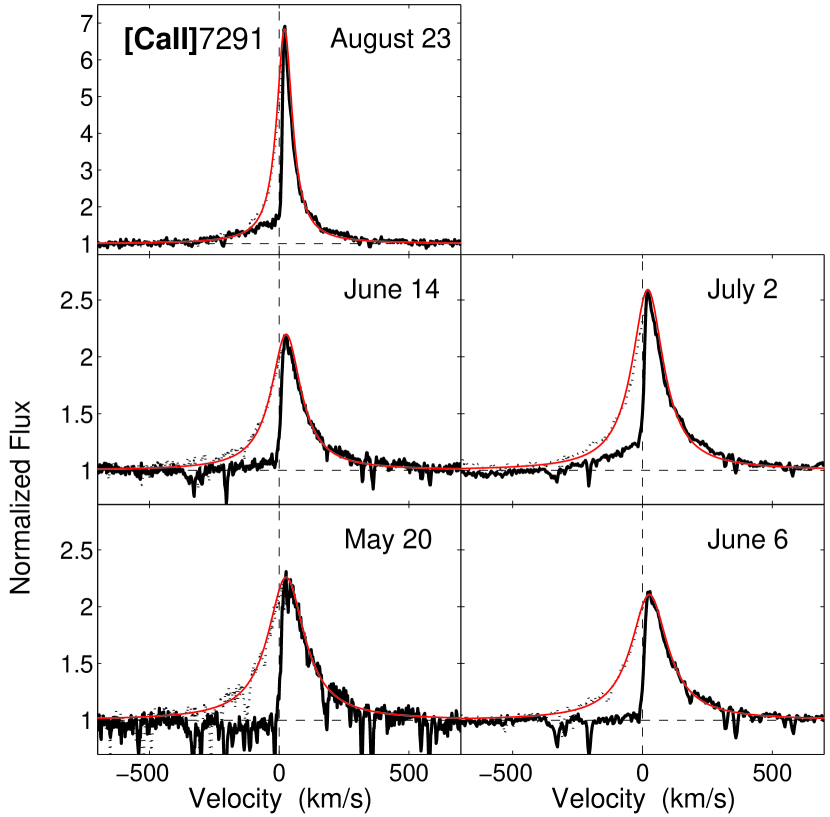
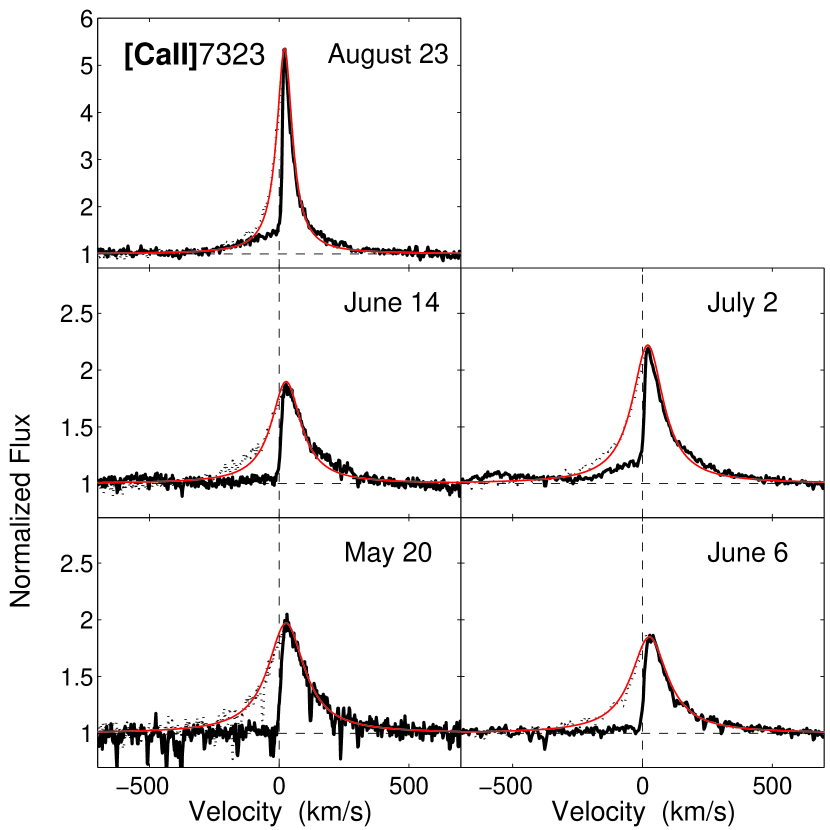
Another striking aspect of the echelle spectra is the strongly asymmetric profile of the [Ca II] lines, in which the blue wing is completely missing; see Figures 15 and 16. The red wing is best fit by a Lorentzian profile with a width of km s-1 in the May 20 and June 6 spectra, decreasing to km s-1 in the June 14 and July 2 spectra, and finally km s-1 in the August 23 spectra. These lines are therefore significantly narrower than the Ca II IR lines and exhibit a more pronounced decrease in width with time. This, along with the missing blue wing, indicate that the forbidden lines are produced in a physically distinct region from the IR lines. Indeed, to avoid collisional excitation and de-excitation out of the meta-stable excited state that is responsible for the [Ca II] emission, the lines need to be produced in a lower density environment compared to the IR lines and the hydrogen Balmer lines.
While the blue portion of the line is missing, we find no evidence for a P Cygni profile. Thus, the flux deficit is not due to absorption of the line emission by an optically thick outflow as generally observed for SNe. Instead, the line asymmetry may reflect an asymmetric distribution of the low density gas. In the context of the complex circumstellar environment inferred from the Ca II H&K and IR lines, it is likely that the red wing is produced in the low density outer layers of the inflowing gas, with the blue wing emission being absorbed by intervening material. This scenario also explains the lower velocity width compared to the H&K lines.
The spectra from July 2 and August 23 reveal the emergence of low level emission on the blue side of the forbidden lines. This increase coincides with the emergence of Ca II H&K emission on the blue side of the lines (§5.2), and it is likely due to the same process of Ca++ recombination.
Finally, as discussed in Chevalier & Fransson (1994), we note that the energy required to ionize Ca+ to Ca++ from the meta-stable excited state (which if left undisturbed would produce the [Ca II] doublet through radiative de-excitation) corresponds to 1218.9 Å, or about 3.2 Å above the Ly line. Thus, when the Ly line is broader than about 800 km/s, the [Ca II] doublet emission can be strongly suppressed by ionization. For narrow Ly emission this effect is inefficient and we expect stronger [Ca II] emission. This is indeed the case for NGC 300 OT2008-1, for which the typical lines widths are km s-1. As a result, we expect that events like NGC 300 OT2008-1 will generally exhibit strong [Ca II] emission lines.
5.5. Hydrogen Balmer lines
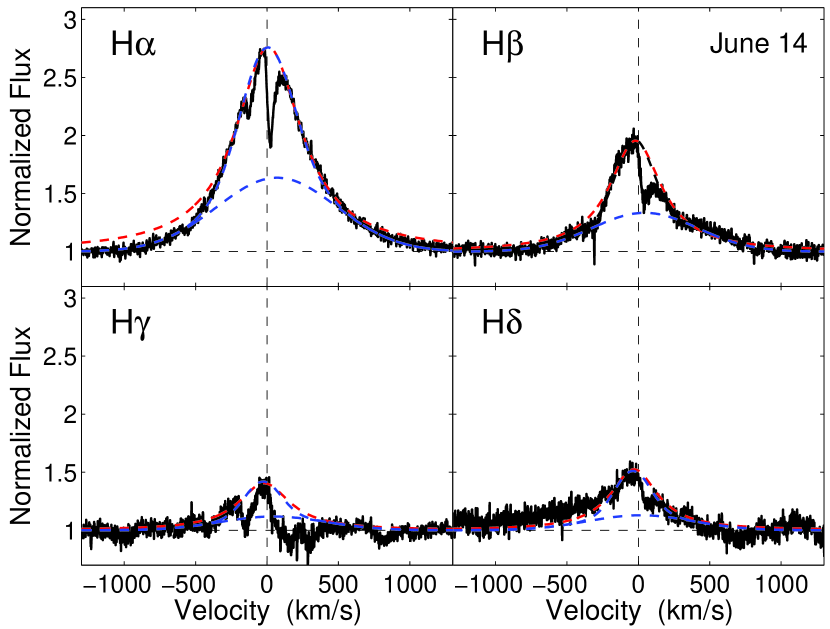
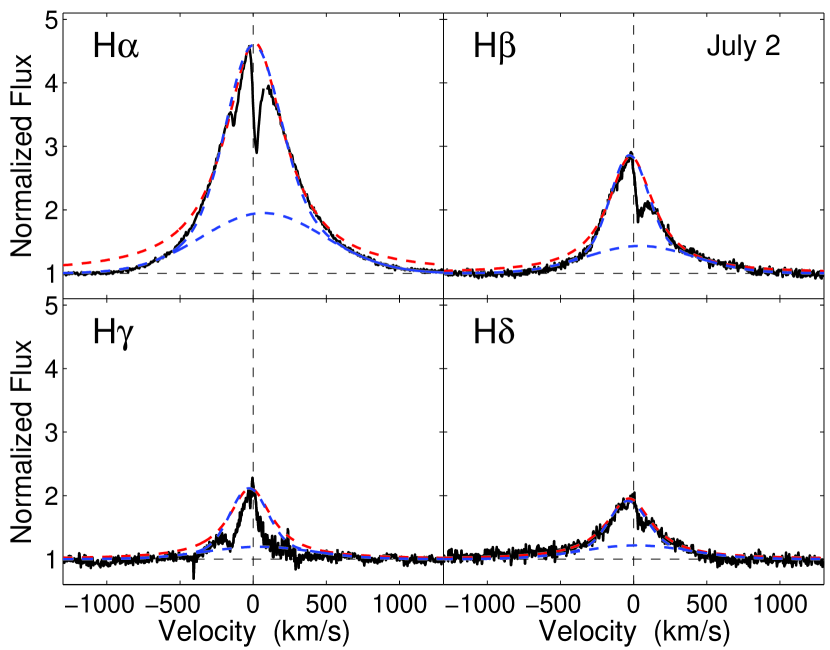
The H line, which appears to have a symmetric profile at low resolution, exhibits a more complex combination of emission and absorption when viewed at high spectral resolution; see Figure 17. At all epochs we find a narrow absorption feature close to the line center, with a width of km s-1. The absorption feature is redshifted by about 30 km s-1 relative to the interstellar absorption of the Ca II lines. A second, but weaker, absorption component with a similar velocity width is detected at a velocity of km s-1.
The overall emission profile can be fit with either a Lorentzian profile or a combination of narrow and broad Gaussian profiles, which are slightly offset in velocity. The motivation behind the latter model is that the broad wings of the line appear to be somewhat asymmetric, with a slight deficit in the blue portion of the line. In the Lorentzian case, the line width remains relatively unchanged between May 20 and June 14 with km s-1, and decreases mildly to km s-1 on July 2 and August 23. In the Gaussian model the narrow component appears to increase in width from about 295 km s-1 on May 20 to about 400 km s-1 in the spectra from June 6 to August 23. The broad component remains relatively unchanged with km s-1. With only a mild change in width, and an increase in brightness relative to the continuum level, the H equivalent width increases significantly with time, ranging from about 10 to 300 Å between May 20 and August 23.
The H line exhibits the same profile as H; see Figure 18. In the second epoch (which has a higher signal to noise ratio), the line is marked by a deep absorption feature with km s-1, which is centered about 80 km s-1 redward of the emission line center. This component is thus wider than its counterpart H absorber, and it also exhibits a more pronounced shift relative to the line center. The H line is again well fit by either a Lorentzian profile or a combination of narrow and wide Gaussians with offset line centers. In the former case, the line width remains unchanged with km s-1 until July 14, and decreases to about 330 km s-1 on August 23. In the Gaussian model, the line widths remain unchanged at and km s-1.
5.6. Additional Absorption and Emission Lines
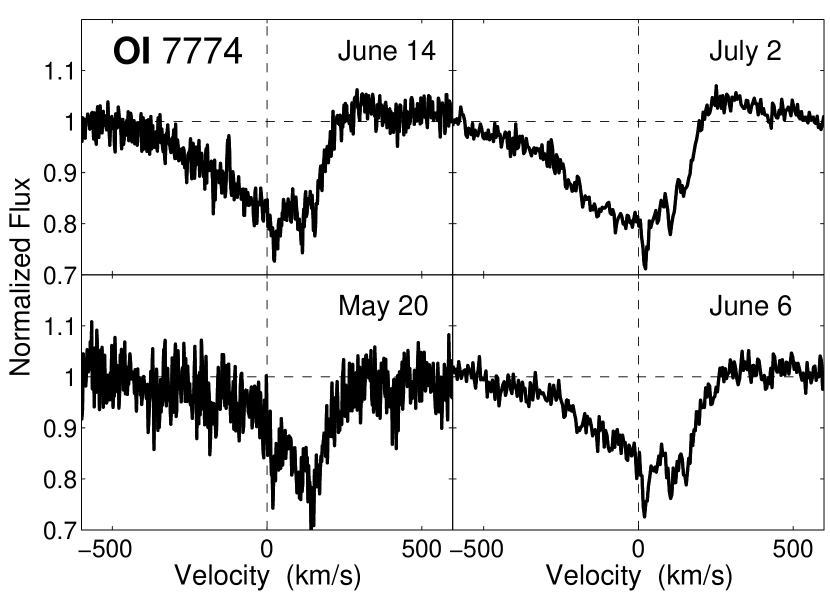
In addition to the strong hydrogen Balmer lines and Ca II lines, we also detect the He I emission line (Figure 12) and the O I triplets at 7774 and 8446 Å in absorption (Figure 21). In all cases the line widths are about 300 km s-1. Moreover, the O I lines are clearly asymmetric with broad blue-shifted absorption extending to about 300 km s-1. This is the opposite effect compared to the Ca II H&K lines, indicating that the absorption in these two species arises in distinct kinematic components.
In addition, we detect narrow absorption features of Ca II H&K, the Ca II IR triplet, and O I, with a typical width of km s-1. It is unclear whether these narrow features are interstellar in origin, or are due to previous mass loss from the progenitor of NGC 300 OT2008-1, with a much lower wind velocity (possibly during a preceding red supergiant phase).
6. The Progenitor of NGC 300 OT2008-1
Our precise astrometry of NGC 300 OT2008-1 (§2.1) enabled a search for the progenitor in archival Hubble Space Telescope and Spitzer Space Telescope observations (see also Thompson et al. 2008; Bond et al. 2009).
6.1. Archival Hubble Space Telescope
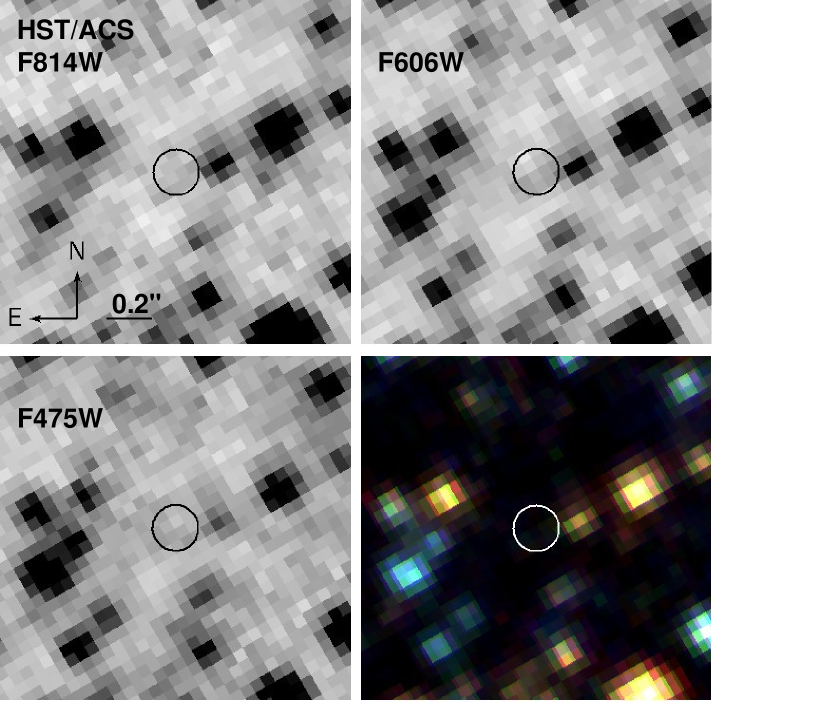
The location of NGC 300 OT2008-1 was observed with the Advanced Camera for Surveys (ACS) on 2006 November 8 UT in the F475W (1488 s), F606W (1515 s), and F814W (1542 s) filters as part of program 10915 (PI: Delcanton). We retrieved the drizzled images from the HST archive and performed an astrometric tie relative to our initial LDSS-3 image (§2.1). The resulting astrometry has an rms of 30 mas in each coordinate.
We do not detect any objects at the position of NGC 300 OT2008-1 to the following limits: mag (F475W), mag (F606W), mag (F814W). The nearest object to the position of NGC 300 OT2008-1 is located about away, or about 1.75 pc at the distance of NGC 300. Images of the field at the location of NGC 300 OT2008-1 are shown in Figure 22.
6.2. Archival Spitzer Space Telescope
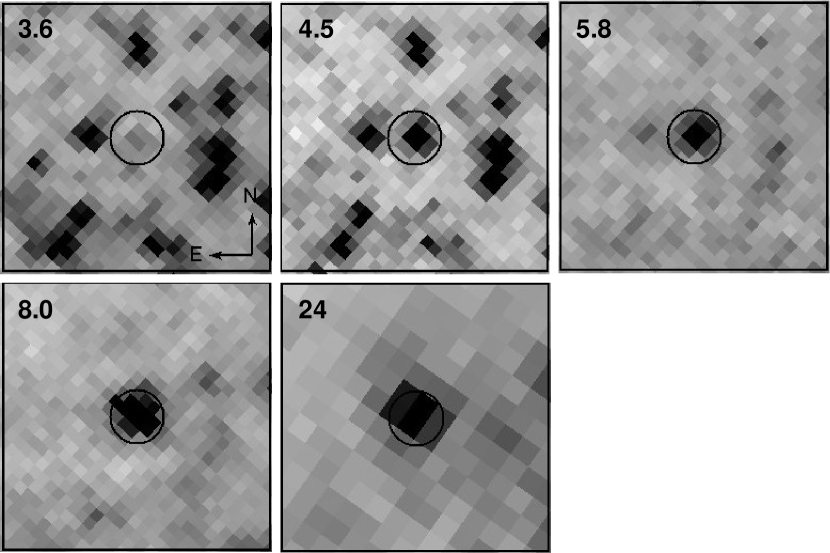
The location of NGC 300 OT2008-1 was observed with the Infra-Red Array Camera (IRAC) on 2007 December 28 UT, and with the Multiband Imaging Photometer for Spitzer (MIPS) on 2007 July 6 and 16 UT. We retrieved the post-BCD data from the Spitzer archive and performed an astrometric tie relative to our initial LDSS-3 image (§2.1). The resulting astrometry has an rms of in each coordinate. Images of the field at the location of NGC 300 OT2008-1 are shown in Figures 23 and 24.
As noted by Prieto (2008) based on our reported astrometry of the transient Berger & Soderberg (2008), a coincident object is detected in the Spitzer data (see also Thompson et al. 2008). We performed photometry of this object using a 2-pixel aperture on the 3.6 and 4.5 m images, and a 3-pixel aperture on the 5.8, 8.0, and 24 m images. The aperture size was selected to reduce contamination from nearby objects. We further used the standard zeropoints and aperture corrections provided in the Spitzer manual. The resulting spectral energy distribution of the coincident source, along with the HST upper limits, is shown in Figure 25.
6.3. Source Properties
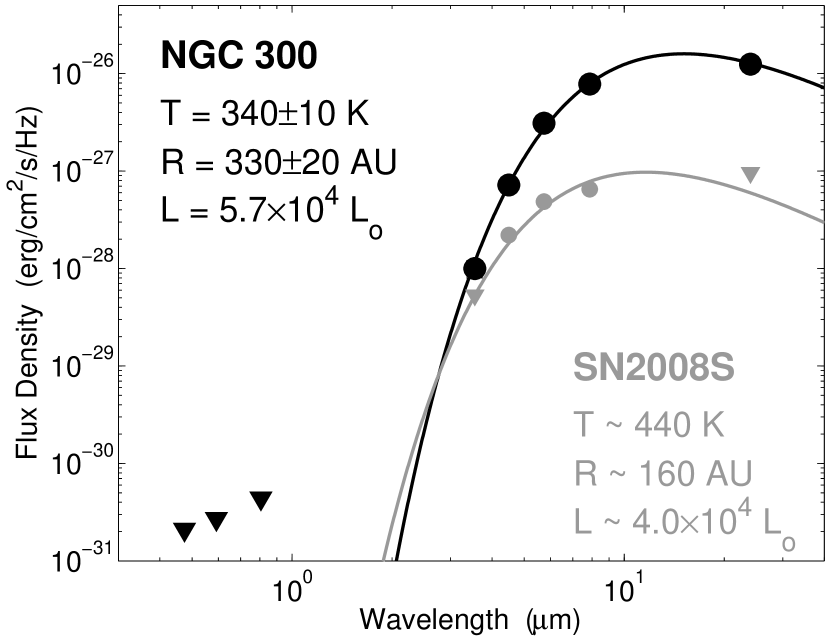
A detailed discussion of the progenitor is presented by Thompson et al. (2008) who conclude that it is an extreme AGB star during a short-lived phase ( yr) of its evolution. Below we provide an independent analysis of the Spitzer and HST observations. The spectral energy distribution is shown in Figure 25. We find that the SED is well fit by a blackbody profile ( for 3 degrees of freedom), indicating that the progenitor was enshrouded by dust prior to the eruption. The best-fit blackbody parameters are K and AU, with a resulting luminosity of L⊙. The total dust mass can be inferred by setting , which for cm2 g-1 (Prieto et al. 2008), corresponds to M⊙.
The fact that the progenitor was completely obscured by dust, while NGC 300 OT2008-1 exhibits negligible dust extinction ( mag; §3) demonstrates that the eruption destroyed the obscuring dust. Since the size of the dust-obscured region exceeds the shock radius of NGC 300 OT2008-1 by about a factor of 20 (§3), we conclude that the dust was destroyed through sublimation rather than shock heating. This process has been investigated by several authors, and we use here the formulation of Waxman & Draine (2000) developed in the context of gamma-ray bursts. The dust destruction radius is given by cm, for a typical grain size of 0.1 m and a dust absorption efficiency factor of order unity (Waxman & Draine 2000). For the radius of the dust-obscured region inferred above, we find that the luminosity required for sublimation is erg s-1. This is about an order of magnitude larger than the bolometric luminosity measured for NGC 300 OT2008-1 on May 31 ( d). The measured decay rate of about 0.02 mag d-1 extrapolated back to the estimated eruption date is not sufficient to overcome this discrepancy. We therefore conclude that either the early emission from NGC 300 OT2008-1 was characterized by a higher photospheric temperature, or the initial event produced a relatively bright UV flash with a luminosity of about erg s-1.
In either case, the destruction of the obscuring dust may be responsible for the strong Ca II emission, since the calcium is initially strongly depleted on dust grains.
7. Interpretation: The Eruption of a Massive Star
Our detailed spectroscopic observations of NGC 300 OT2008-1, and the detection of its progenitor system in archival data, allow us to construct a basic model of the event and its environment. The key observational results presented in the preceding sections are summarized as follows:
-
•
The line of sight extinction is negligible as inferred from the UV/optical SED and the weak Na I D lines.
-
•
Prior to the event, the progenitor system was enshrouded by dust, and had a luminosity of about L⊙, corresponding to a M⊙ star.
-
•
The wide and asymmetric Ca II H&K absorption lines require gas infall at velocities of about km s-1, and hence a massive and relatively compact progenitor or companion.
-
•
The Ca II IR lines and the hydrogen Balmer lines are symmetric and broad ( km s-1), and marked by narrow absorption redward of the emission line peak.
-
•
The [Ca II] lines are extremely asymmetric, and significantly narrower than the other Ca II lines and hydrogen Balmer lines.
-
•
None of the lines exhibit velocities in excess of km s-1, or P Cygni profiles.
These properties bear a striking resemblance to those of the massive yellow hypergiant IRC+10420 (e.g., de Jager 1998; Oudmaijer 1998; Humphreys et al. 2002; Smith et al. 2008; Bond et al. 2009), which is thought to be rapidly transitioning from a red supergiant phase to a luminous blue variable or Wolf-Rayet phase. Like the progenitor of NGC 300 OT2008-1, IRC+10420 is marked by a bright infrared excess resulting from a dusty nebula, but unlike NGC 300 OT2008-1 the central object is not completely obscured. The luminosity of IRC+10420, L⊙, is about an order of magnitude larger than our inferred luminosity of the progenitor of NGC 300 OT2008-1 (§3). This points either to a lower mass or a somewhat earlier evolutionary stage for the progenitor of NGC 300 OT2008-1. Equally important, IRC+10420 exhibits essentially identical hydrogen Balmer and Ca II IR line profiles to those seen in our high resolution spectra, including the redshifted narrow absorption feature (see Figures 4 and 5 of Humphreys et al. 2002 and Figures 3 and 4 of Oudmaijer 1998).
At the same time, there are some distinct difference between the spectroscopic properties of NGC 300 OT2008-1 and IRC+10420. First, the ionCa2 H&K lines in IRC+10420 are symmetric and significantly narrower than those observed in NGC 300 OT2008-1 (Oudmaijer 1998). Second, the [Ca II] emission lines in IRC+10420 appear to be symmetric (Oudmaijer 1998; Humphreys et al. 2002), although like in the case of NGC 300 OT2008-1 they are significantly narrower than the hydrogen Balmer lines and the Ca II IR lines. Third, the Ca II IR lines, which extend to about km s-1 (Humphreys et al. 2002), are significantly narrower than in NGC 300 OT2008-1. Finally, while the H profiles in both objects are generally similar, the red and blue emission peaks of IRC+10420 have a similar width to the central absorption (Humphreys et al. 2002), whereas in the case of NGC 300 OT2008-1 the emission peaks are significantly wider. In both cases the H line exhibit a broad wing, which is interpreted as the effect of electron scattering in the case of IRC+10420 (Humphreys et al. 2002). In the spectrum of NGC 300 OT2008-1, however, the core of the line is broader and the wings are less pronounced, and we interpret the profile as due to circumstellar interaction of an outflow with a velocity of about 600 km s-1 (as opposed to a outflowing wind velocity of only 50 km s-1 inferred for IRC+10420).
The combination of these various properties suggests that in broad terms the progenitor of NGC 300 OT2008-1 may be similar to IRC+10420, but it may have been in a somewhat different evolutionary stage prior to the eruption, with still complete dust obscuration. In addition, the eruption itself appears to have produced a significantly faster, more energetic, and more luminous outflow compared to the “quiescent” state of IRC+10420. Thus, it is possible that NGC 300 OT2008-1 marks the initial transition to an IRC+10420-like object, and that as the eruption fades, its properties will converge to those of IRC+10420.
8. Comparison with M85 OT2006-1 and SN 2008S
We finally turn to a comparison of NGC 300 OT2008-1 with two recent events that exhibit several similar properties: M85 OT2006-1 and SN 2008S. SN 2008S was discovered on February 1.8 UT in NGC 6946 ( Mpc) and had an absolute magnitude of mag (taking into account significant Galactic and host obscuration of mag; Prieto et al. 2008; Smith et al. 2008). The -band light curve of SN 2008S from Smith et al. (2008) is shown in Figure 2. The temporal evolution is remarkably similar to that of NGC 300 OT2008-1, namely a relatively stable decay rate of about 0.035 mag d-1 from about 30 to 100 days. However, unlike NGC 300 OT2008-1, the optical emission from SN 2008S does not exhibit a clear steepening at later times, and it may indeed flatten to a decay rate of about 0.01 mag d-1 from 130 to 270 days.
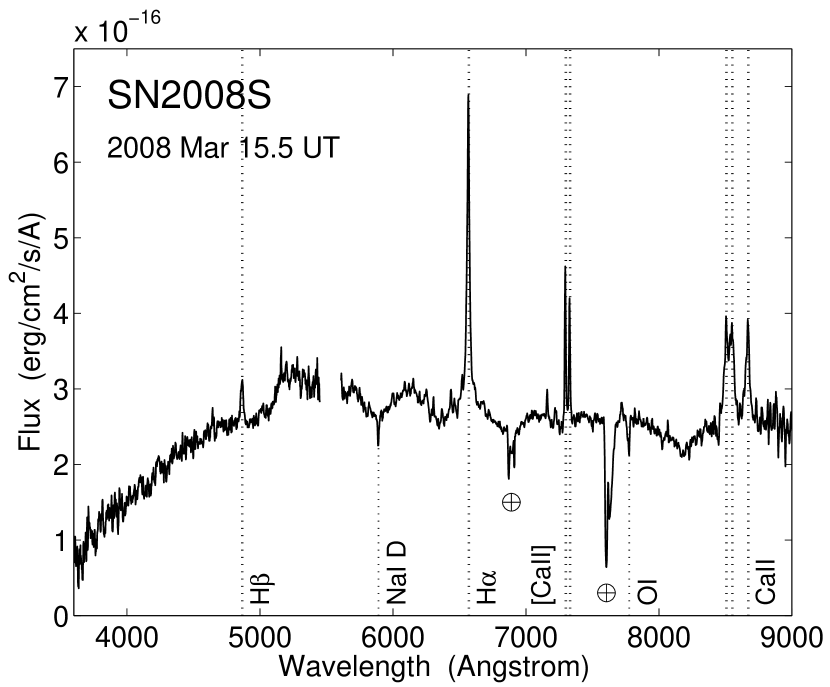
In Figure 26 we present a low-resolution spectrum of SN 2008S that we obtained on 2008 Mar 15.5 UT ( d) using the ARC 3.5-m telescope at Apache Point Observatory. The resolution of the spectrum is 6.5 Å, or about 300 km s-1. Neglecting extinction, we find that the overall continuum shape and brightness are characterized by a blackbody profile with K and cm, similar to the properties inferred for NGC 300 OT2008-1 at a similar epoch of about 44 d (Figure 25). The inferred bolometric absolute magnitude is mag. However, if we include the estimated extinction of mag, we find that the spectrum requires a higher temperature, K, and a smaller radius, cm, leading to an overall absolute magnitude of mag, similar to the values inferred by Smith et al. (2008) from similar spectroscopic observations. Thus, SN 2008S has a bolometric luminosity that is nearly an order of magnitude larger than NGC 300 OT2008-1. Combined with the similar temporal evolution, we conclude that SN 2008S released about an order of magnitude more energy than NGC 300 OT2008-1, erg (see also Smith et al. 2008).
The overall similarity in also evident in the dominant spectral features of both events. SN 2008S exhibits strong and narrow hydrogen Balmer lines, [Ca II] lines, and Ca II IR lines. The H line is resolved with a width of km s-1, about a factor of 2 times broader than for NGC 300 OT2008-1. As in the case of NGC 300 OT2008-1, the Ca II IR triplet lines exhibit a similar width to that of H, km s-1. The [Ca II] lines are only marginally resolved, with km s-1. This is again a factor of 2 times broader than in NGC 300 OT2008-1, and comparably narrower than the H line. Due to the low resolution of the spectrum it is unclear whether the [Ca II] lines are asymmetric. Unlike in the case of NGC 300 OT2008-1, we do not detect Ca II H&K absorption or He I emission.
Finally, perhaps the most important similarity between SN 2008S and NGC 300 OT2008-1 is the detection of a coincident Spitzer source in both events (Prieto et al. 2008; Thompson et al. 2008). As shown in Figure 25, the SEDs of both coincident sources are similar, with K, AU, and L⊙ for SN 2008S. Thus, both events appear to arise from objects of a similar luminosity and in a similar evolutionary stage. Thompson et al. (2008) recently argued that the progenitors of both events are extreme AGB stars with masses of M⊙, and that the events themselves are likely electron-capture SNe. Smith et al. (2008), on the other hand, advocated a scenario for SN 2008S of a super-Eddington eruption that results in significant mass loss. They further note an overall similarity to IRC+10420, and speculate that SN 2008S resembles an eruption of a M⊙ blue supergiant, rather than a lower mass red supergiant as advocated by Thompson et al. (2008). Our high resolution spectroscopic observations of NGC 300 OT2008-1, and their close resemblance to the spectrum of IRC+10420, support the interpretation of Smith et al. (2008). Still, while both events appear to arise from similar objects, these progenitors are clearly capable of producing eruptions with an energy release that spans at least an order of magnitude.
We next turn to a comparison with M85 OT2006-1. As shown in Figure 1, the spectral energy distribution of this event closely resembles NGC 300 OT2008-1, with a nearly identical bolometric luminosity of about mag (Kulkarni et al. 2007). The light curve evolution is also similar (Figure 2), with a comparable decay rate during the first days, followed by a significant steepening at later time. Thus, M85 OT2006-1 appears to be a clear analog of both NGC 300 OT2008-1 and SN 2008S.
Unfortunately, the low-resolution spectra of M85 OT2006-1, obtained about 1 and 48 d after discovery (Kulkarni et al. 2007), had a low signal-to-noise ratio that precludes a detailed analysis. Still, the second spectrum does exhibit a narrow H emission line with km s-1, about two times narrower than in NGC 300 OT2008-1. Additional weak features possibly corresponding to Ca II H&K and Fe II may also be discerned in the spectrum (see Figure 3 of Kulkarni et al. 2007). These possible features provide additional support for a common origin with NGC 300 OT2008-1.
On the other hand, the environments of NGC 300 OT2008-1 and M85 OT2006-1 differ significantly. In the case of M85 OT2006-1, the host is an early type galaxy (with a mean age of Gyr), and the environment of the transient itself contains no stars brighter than mag, corresponding to a mass of M⊙ (Ofek et al. 2008). The local environment of NGC 300 OT2008-1, on the other hand, contains stars with inferred masses of M⊙ (Bond et al. 2009), in line with the inferred mass of the progenitor system. Thus, it appears that different channels/progenitors may lead to the formation of similar transient outbursts.
Given the overall similarity between the three events it is reasonable to conclude that they share a common origin. Thanks to our detailed high-resolution spectroscopic observations of NGC 300 OT2008-1, an intimate connection with objects like IRC+10420 appears likely (in agreement with previous speculation Smith et al. 2008) but may not be required (e.g., M85 OT2006-1). From the overall similarity we further conclude that none of the three transients are likely to have resulted from the explosion of the progenitor star. Instead, the eruptions may mark a shift in the evolutionary stage from complete obscuration to a yellow supergiant phase, and eventually a Wolf-Rayet star. Clearly, such a transition apparently leads to overall common features, but in detail the energy and velocity of the outflow appear to vary by at least an order of magnitude.
9. Summary and Conclusions
We presented the first high-resolution spectroscopic observations for the intermediate luminosity optical transient NGC 300 OT2008-1, as well as multi-wavelength observations (UV/optical/radio/X-ray) and an independent analysis of archival Spitzer and HST observations of its progenitor (see also Thompson et al. 2008; Bond et al. 2009). The preponderance of photometric and spectroscopic evidence indicate that this event is not a supernova, but is instead the result of an eruption on a M⊙ blue supergiant or pre-Wolf-Rayet star, possibly in a binary system. The high-resolution spectra reveal the presence of a complex circumstellar environment, marked by outflows and possible inflow from previous ejections or from a companion wind. The observed inflow velocities are indicative of a massive and relatively compact progenitor, not a highly extended red supergiant, in contrast to the interpretation of Thompson et al. (2008) and Bond et al. (2009). Alternatively, the progenitor may be part of a binary system in which the companion wind (with a velocity of km s-1) is observed in absorption along the line of sight. In this scenario, however, it may be difficult to accommodate the relatively low total system mass of M⊙.
The outburst itself gave rise to an outflow with a velocity of km s-1 and a kinetic energy of at least erg. No radio or X-ray emission are detected to limits that are significantly dimmer than the faintest SNe detected to date, indicating a lack of fast ejecta (with ).
NGC 300 OT2008-1 closely resembles two previous events, M85 OT2006-1 and SN 2008S, in terms of its intermediate luminosity and spectral properties. It also shares with SN 2008S a dust-obscured progenitor with a luminosity of a L⊙. Our detailed comparison reveals that the outburst and progenitor properties point to a common origin, but with a range of outburst energy and velocity of nearly an order of magnitude. We also note a resemblance between the spectroscopic properties of NGC 300 OT2008-1 and those of the luminous yellow supergiant IRC+10420. However, the latter is about an order of magnitude more luminous than the progenitor of NGC 300 OT2008-1, and its observed “quiescent” outflow has a velocity of only km s-1. These differences raise the possibility that NGC 300 OT2008-1 marks the transition to an IRC+10420-like state, or that its progenitor is simply a lower mass analogue.
While our optical/UV photometry and low-resolution spectroscopy are of similar quality to those of SN 2008S and M85 OT2006-1, our extensive echelle spectroscopy provides a much deeper view of the circumstellar environment than previously available for this class of events. Indeed, we stress that the overall photometric behavior and general spectroscopic features observed in NGC 300 OT2008-1 may be generic to a broad class of stellar eruptions with an intermediate velocity in the presence of a dense circumstellar environment. For example, the 2002 eruption of V838 Mon was similar in broad terms to that of NGC 300 OT2008-1, M85 OT2006-1, and SN 2008S, based on a comparable light curve behavior and spectroscopic evidence for narrow H and Ca II lines (e.g., Rushton et al. 2005). However, the eruption was about an order of magnitude less luminous than NGC 300 OT2008-1 and M85 OT2006-1, and the progenitor appears to have been a lower mass star. We conclude that a clear understanding of the broad range of ILOTs requires high-resolution spectroscopy to assess the detailed properties of the circumstellar environment, as well as the identification of progenitors; optical/IR photometry and low-resolution spectroscopy alone are not likely to be sufficient.
Finally, the main prediction of our model is that the progenitor of NGC 300 OT2008-1 should be visible following the decay of the event. If the current eruption is similar to previous events that produced the now-destroyed dust shell, than the progenitor would again be visible as an obscured IR source. However, if only a minor amount of dust reforms, we predict that the spectrum will more closely resemble that of IRC+10420. In either case it appears that events like NGC 300 OT2008-1 represent an important stage in the evolution of massive stars toward their eventual demise in SN explosions. The advent of facilities such as Pan-STARRS and LSST will lead to an increased rate of detections of events similar to NGC 300 OT2008-1. From the observations presented here it is clear that multi-wavelength follow-up, in particular high-resolution spectroscopy, which is not typically attempted for SNe (cf. SN 2008S), is critical for a detailed understanding of the eruption process and the properties of the progenitor(s).
References
- Berger et al. (2002) Berger, E., Kulkarni, S. R., & Chevalier, R. A. 2002, ApJ, 577, L5
- Berger & Soderberg (2008) Berger, E., & Soderberg, A. 2008, The Astronomer’s Telegram, 1544, 1
- Bond et al. (2009) Bond, H. E., Bonanos, A. Z., Humphreys, R. M., Berto Monard, L. A. G., Prieto, J. L., & Walter, F. M. 2009, ArXiv e-prints
- Bond et al. (2008) Bond, H. E., Walter, F. M., & Velasquez, J. 2008, IAU Circ., 8946, 2
- Chevalier & Fransson (1994) Chevalier, R. A., & Fransson, C. 1994, ApJ, 420, 268
- Chevalier et al. (2006) Chevalier, R. A., Fransson, C., & Nymark, T. K. 2006, ApJ, 641, 1029
- de Jager (1998) de Jager, C. 1998, A&A Rev., 8, 145
- Drake & Ulrich (1980) Drake, S. A., & Ulrich, R. K. 1980, ApJS, 42, 351
- Gieren et al. (2005) Gieren, W., Pietrzyński, G., Soszyński, I., Bresolin, F., Kudritzki, R.-P., Minniti, D., & Storm, J. 2005, ApJ, 628, 695
- Goodrich et al. (1989) Goodrich, R. W., Stringfellow, G. S., Penrod, G. D., & Filippenko, A. V. 1989, ApJ, 342, 908
- Humphreys et al. (2002) Humphreys, R. M., Davidson, K., & Smith, N. 2002, AJ, 124, 1026
- Kelson (2003) Kelson, D. D. 2003, PASP, 115, 688
- Kulkarni et al. (2007) Kulkarni, S. R., et al. 2007, Nature, 447, 458
- Lamers et al. (1995) Lamers, H. J. G. L. M., Snow, T. P., & Lindholm, D. M. 1995, ApJ, 455, 269
- Monard (2008) Monard, L. A. G. 2008, IAU Circ., 8946, 1
- Munari et al. (2002) Munari, U., et al. 2002, A&A, 389, L51
- Munari & Zwitter (1997) Munari, U., & Zwitter, T. 1997, A&A, 318, 269
- Ofek et al. (2008) Ofek, E. O., et al. 2008, ApJ, 674, 447
- Oudmaijer (1998) Oudmaijer, R. D. 1998, A&AS, 129, 541
- Pastorello et al. (2007) Pastorello, A., et al. 2007, Nature, 449, 1
- Pastorello et al. (2004) Pastorello, A., et al. 2004, MNRAS, 347, 74
- Prieto (2008) Prieto, J. L. 2008, The Astronomer’s Telegram, 1550, 1
- Prieto et al. (2008) Prieto, J. L., et al. 2008, ApJ, 681, L9
- Retter et al. (2006) Retter, A., Zhang, B., Siess, L., & Levinson, A. 2006, MNRAS, 370, 1573
- Rushton et al. (2005) Rushton, M. T., et al. 2005, MNRAS, 360, 1281
- Schlegel et al. (1998) Schlegel, D. J., Finkbeiner, D. P., & Davis, M. 1998, ApJ, 500, 525
- Smith et al. (2008) Smith, N., Ganeshalingam, M., Li, W., Chornock, R., Steele, T. N., Silverman, J. M., Filippenko, A. V., & Mobberley, M. P. 2008, ArXiv e-prints
- Soker & Tylenda (2006) Soker, N., & Tylenda, R. 2006, MNRAS, 373, 733
- Stockdale et al. (2001) Stockdale, C. J., Rupen, M. P., Cowan, J. J., Chu, Y.-H., & Jones, S. S. 2001, AJ, 122, 283
- Thompson et al. (2008) Thompson, T. A., Prieto, J. L., Stanek, K. Z., Kistler, M. D., Beacom, J. F., & Kochanek, C. S. 2008, ArXiv e-prints
- Van Dyk et al. (2005) Van Dyk, S. D., Filippenko, A. V., Chornock, R., Li, W., & Challis, P. M. 2005, PASP, 117, 553
- Van Dyk et al. (2000) Van Dyk, S. D., Peng, C. Y., King, J. Y., Filippenko, A. V., Treffers, R. R., Li, W., & Richmond, M. W. 2000, PASP, 112, 1532
- Waxman & Draine (2000) Waxman, E., & Draine, B. T. 2000, ApJ, 537, 796
| UT Date | Instrument | Exposure | Grism | Slit | Wavelength | Resolution |
|---|---|---|---|---|---|---|
| (s) | (Å) | (Å) | ||||
| 2008 May 20.42 | MIKE | Blue | 0.10 | |||
| MIKE | Red | 0.21 | ||||
| 2008 May 23.43 | LDSS-3 | VPH-red | 6.2 | |||
| 2008 May 31.40 | LDSS-3 | VPH-blue | 3.4 | |||
| LDSS-3 | VPH-red | 6.2 | ||||
| 2008 June 5.41 | LDSS-3 | VPH-red | 6.2 | |||
| 2008 June 6.40 | MIKE | Blue | 0.13 | |||
| MIKE | Red | 0.28 | ||||
| 2008 June 14.40 | MIKE | Blue | 0.10 | |||
| MIKE | Red | 0.21 | ||||
| 2008 June 22.42 | LDSS-3 | VPH-blue | 3.4 | |||
| LDSS-3 | VPH-red | 6.2 | ||||
| 2008 July 2.35 | MIKE | Blue | 0.13 | |||
| MIKE | Red | 0.28 | ||||
| 2008 July 14.36 | MIKE | Blue | 0.13 | |||
| MIKE | Red | 0.28 | ||||
| 2008 August 23.32 | MIKE | Blue | 0.10 | |||
| MIKE | Red | 0.21 |
Note. — Journal of spectroscopic observations of the transient in NGC 300.
| UT Date | Filter | Exposure | Magnitude | Flux Density |
|---|---|---|---|---|
| (s) | ( erg s-1 cm-2 Å-1) | |||
| 2008 May 20.01 | UVW2 | 5723 | ||
| 2008 May 25.03 | UVW1 | 3877 | ||
| 2008 May 25.04 | U | 1551 | ||
| 2008 May 25.04 | B | 773 | ||
| 2008 May 25.04 | V | 691 | ||
| 2008 June 4.68 | UVW1 | 1295 | ||
| 2008 June 4.67 | U | 1599 | ||
| 2008 June 4.68 | B | 1856 | ||
| 2008 June 4.67 | V | 2006 | ||
| 2008 June 19.39 | UVW1 | 1765 | ||
| 2008 June 19.39 | U | 879 | ||
| 2008 June 19.39 | B | 879 | ||
| 2008 June 19.39 | V | 879 | ||
| 2008 August 14.17 | UVW1 | 746 | ||
| 2008 August 14.17 | U | 428 | ||
| 2008 August 14.17 | B | 428 | ||
| 2008 August 14.17 | V | 428 | ||
| 2008 August 15.04 | UVW1 | 727 | ||
| 2008 August 15.04 | U | 467 | ||
| 2008 August 15.04 | B | 467 | ||
| 2008 August 15.04 | V | 467 | ||
| 2008 August 26.60 | UVW1 | 1522 | ||
| 2008 August 26.60 | U | 1024 | ||
| 2008 August 26.60 | B | 1024 | ||
| 2008 August 26.59 | V | 1024 | ||
| 2008 October 15.02 | U | 716 | ||
| 2008 October 15.02 | B | 646 | ||
| 2008 October 15.01 | V | 716 |
Note. — Journal of Swift UV/Optical Telescope observations of NGC 300 OT2008-1. Central wavelengths for the various filters are: 1880 Å (UVW2), 2510 Å (UVW1), 3450 Å (U), 4390 Å (B), and 5440 Å (V).
| UT Date | Telescope | Filter | Exposre | Magnitude |
|---|---|---|---|---|
| (s) | ||||
| 2008 May 31.44 | Magellan | g | 5 | |
| 2008 May 31.40 | Magellan | r | 10 | |
| 2008 May 31.44 | Magellan | i | 5 | |
| 2008 May 31.44 | Magellan | z | 10 |
Note. — Journal of optical observations of NGC 300 OT2008-1 from May 31.4 UT.
| Line | Date | Wavelength | Velocity | EW | FWHM | Flux |
|---|---|---|---|---|---|---|
| (Å) | (km s-1) | (Å) | (Å) | (erg cm-2 s-1) | ||
| Ca II H | May 31 | 3938.84 | 310 | 12.1 | ||
| June 22 | 3938.30 | 270 | 8.7 | |||
| Ca II K | May 31 | 3973.78 | 315 | 9.3 | ||
| June 22 | 3973.47 | 295 | 7.0 | |||
| H | May 31 | 4102.51 | 14.1 | |||
| June 22 | 4104.32 | 105 | 6.7 | |||
| H | June 22 | 4343.25 | 110 | 7.2 | ||
| H | May 31 | 4864.35 | 100 | 9.0 | ||
| June 22 | 4864.28 | 100 | 6.7 | |||
| ? | May 31 | 5857.10 | 7.2 | |||
| June 22 | 5856.00 | 7.9 | ||||
| He I 5877.25 | May 31 | 5878.96 | 90 | 9.8 | ||
| June 22 | 5880.13 | 145 | 7.6 | |||
| Na I D | May 31 | 5895.65 | 55 | 10.0 | ||
| June 22 | 5894.75 | 10 | 10.2 | |||
| Fe II 5993.03 | May 31 | 5999.51 | 325 | 9.9 | ||
| June 22 | 5998.22 | 260 | 7.1 | |||
| Fe II 6434.46 | May 23 | 6437.31 | 130 | 21.3 | ||
| May 31 | 6434.78 | 15 | 20.7 | |||
| June 5 | 6436.56 | 100 | 18.5 | |||
| June 22 | 6438.13 | 170 | 9.0 | |||
| Fe II 6517.85 | May 23 | 6523.81 | 270 | 7.3 | ||
| May 31 | 6522.95 | 235 | 9.6 | |||
| June 5 | 6522.66 | 220 | 7.5 | |||
| June 22 | 6521.58 | 170 | 8.0 | |||
| H | May 23 | 6569.94 | 240 | 16.2 | ||
| May 31 | 6568.86 | 190 | 15.3 | |||
| June 5 | 6568.74 | 190 | 14.9 | |||
| June 22 | 6468.02 | 155 | 13.3 | |||
| He I 6679.99 | May 23 | 6684.60 | 210 | 17.5 | ||
| May 31 | 6684.99 | 225 | 13.0 | |||
| June 5 | 6684.64 | 210 | 8.9 | |||
| June 22 | 6684.46 | 200 | 11.5 | |||
| He I 7067.14 | May 23 | 7068.33 | 50 | 6.4 | ||
| May 31 | 7068.51 | 60 | 5.4 | |||
| June 5 | 7069.89 | 120 | 6.6 | |||
| June 22 | 7071.10 | 170 | 10.7 | |||
| 7293.48 | May 23 | 7299.60 | 250 | 4.3 | ||
| May 31 | 7299.20 | 235 | 5.5 | |||
| June 5 | 7299.45 | 245 | 4.0 | |||
| June 22 | 7298.22 | 195 | 5.2 | |||
| 7325.91 | May 23 | 7332.04 | 250 | 5.4 | ||
| May 31 | 7331.62 | 235 | 6.5 | |||
| June 5 | 7331.80 | 240 | 5.2 | |||
| June 22 | 7330.61 | 195 | 6.1 | |||
| Fe II 7464.44 | May 23 | 7468.98 | 180 | 24.5 | ||
| May 31 | 7468.14 | 150 | 16.0 | |||
| June 5 | 7467.85 | 135 | 20.1 | |||
| June 22 | 7467.54 | 125 | 19.2 | |||
| Fe II 7713.83 | May 23 | 7723.98 | 395 | 24.2 | ||
| May 31 | 7720.87 | 275 | 13.8 | |||
| June 5 | 7721.19 | 285 | 11.6 | |||
| June 22 | 7720.93 | 275 | 11.1 | |||
| O I 7774.08a | May 23 | 7780.29 | 240 | 8.9 | ||
| May 31 | 7778.85 | 185 | 10.6 | |||
| June 5 | 7778.87 | 185 | 10.3 | |||
| June 22 | 7776.96 | 110 | 9.4 | |||
| O I 8448.57b | May 23 | 8454.78 | 220 | 4.9 | ||
| May 31 | 8452.95 | 155 | 5.6 | |||
| June 5 | 8452.76 | 150 | 5.8 | |||
| June 22 | 7776.96 | 110 | 9.4 |
Note. — Emission and absorption features identified in the low resolution spectra of NGC300-2008-OT1.