The formation rates of Population III stars and chemical enrichment of halos during the Reionization Era
Abstract
The First Stars in the Universe form out of pristine primordial gas clouds that have been radiatively cooled to a few hundreds of degrees Kelvin either via molecular or atomic (Lyman-) hydrogen lines. This primordial mode of star formation is eventually quenched once radiative and/or chemical (metal enrichment) feedbacks mark the transition to Population II stars. In this paper we present a model for the formation rate of Population III stars based on Press-Schechter modeling coupled with analytical recipes for gas cooling and radiative feedback. Our model also includes a novel treatment for metal pollution based on self-enrichment due to a previous episode of Population III star formation in progenitor halos. With this model we derive the star formation history of Population III stars, their contribution to the re-ionization of the Universe and the time of the transition from Population III star formation in minihalos (, cooled via molecular hydrogen) to that in more massive halos (, where atomic hydrogen cooling is also possible). We consider a grid of models highlighting the impact of varying the values for the free parameters used, such as star formation and feedback efficiency. The most critical factor is the assumption that only one Population III star is formed in a halo. In this scenario, metal free stars contribute only to a minor fraction of the total number of photons required to re-ionize the universe. In addition, metal free star formation is primarily located in minihalos and chemically enriched halos become the dominant locus of star formation very early in the life of the Universe — at redshift — even assuming a modest fraction (%) of enriched gas converted in stars. If instead multiple metal free stars are allowed to form out of a single halo, then there is an overall boost of Population III star formation, with a consequent significant contribution to the re-ionizing radiation budget. In addition, the bulk of metal free stars are produced in halos with .
1 Introduction
Population III stars are considered to be the first luminous objects formed during the Dark Ages of the Universe, when the hydrogen is in a neutral state (e.g. see Bromm & Larson 2004). The first generation of stars, formed out of pristine primordial gas, had a top-heavy initial mass function, with a typical mass scale of order of and most probably just one star per halo (e.g. see Abel et al., 2002; O’Shea & Norman, 2007). These stars start forming after about million years from the big-bang at redshift (Naoz et al. 2006; Trenti & Stiavelli 2007; see also Gao et al. 2005) and, given their high mass, they live only a few million years ending with either a pair instability supernova phase or a direct collapse to a black hole (Heger et al., 2003).
Population III stars thus initiate the chemical enrichment of the Universe and open the way to more normal modes of star formation, namely Population II (e.g. see Ostriker & Gnedin, 1996; Furlanetto & Loeb, 2003). In fact, the metals released into the IGM after a pair instability supernova explosion can travel outside the parent dark matter halo that hosts the Population III star. Calculations by Bromm et al. (2001) found that a region containing up to about can be enriched to a critical metallicity by the most massive pair instability supernovae. More typical explosions may instead enrich significantly less gas () although at a correspondingly higher metallicity (see Bromm et al. 2003; Kitayama & Yoshida 2005; Greif et al. 2007; Whalen et al. 2008). Even in the latter case, a halo of mass that had one of its progenitors hosting a Pair Instability Supernova is still likely to be enriched to an average metallicity of thanks to violent relaxation mixing (Lynden-Bell, 1967) during its hierarchical build-up.
Population III stars are also the sources that start to re-ionize the Universe, creating ionized islands within the neutral hydrogen inter-stellar and inter-galactic medium. Ionizing photons are emitted with an enhanced efficiency compared to Population II stars due to the high effective temperatures of massive metal-free stars (Tumlinson & Shull, 2000; Schaerer, 2002), and these sources could be responsible for a significant fraction of the Thompson optical depth to reionization deriving from (Shull & Venkatesan, 2008). Another hint suggesting that Population III stars contribute significantly to the re-ionization of hydrogen can also be inferred by the rapid evolution of the galaxy luminosity function at , which implies that observed galaxies alone do not seem capable of re-ionizing the Universe (e.g. see Oesch et al. 2008; Bouwens & Illingworth 2006).
Two main modes of Population III star formation have been proposed: either in minihalos with virial temperature of , where the gas is cooled via molecular hydrogen (), or in more massive, rarer, halos with , where cooling through atomic hydrogen (Lyman-) lines becomes possible (e.g. see Bromm & Larson, 2004). is formed during the initial collapse of the gas within the minihalo, but it is sensitive to photo-dissociating radiation in the Lyman Werner band (). Thus, in presence of a sufficiently high LW background, its formation rate may be lower than the dissociation rate with a resulting suppression of Population III star formation in minihalos (Haiman et al., 1997, 2000; Ciardi et al., 2000; Glover & Brand, 2001; Machacek et al., 2001; O’Shea & Norman, 2008). Interestingly, the main coolant of halos with a virial temperature of in a strong LW background may continue to remain molecular hydrogen according to numerical simulations: O’Shea & Norman (2008) found in fact that while in presence of a strong feedback is required for collapse, still the cooling is driven at the center of the halo by molecular hydrogen, formed thanks to the high central density (see also Wise & Abel 2007). The feedback induced by nearby Population III sources may also be positive, as, e.g., a soft X-ray background enhances the production rate (Ricotti et al., 2001; Machacek et al., 2003). Therefore the termination of the first epoch of Population III star formation depends critically on the relative weight of these two competing process, which in turns is influenced by the local topology of the IGM, by the spatial distribution of the sources and by their IMF (which affects the relative efficiency of X ray to Lyman Werner photon production). In addition to radiative feedback, Population III star formation is influenced by chemical feedback. This can be broadly classified as (i) self-enrichment due to a previous episode of star formation in a progenitor of the halo considered and (ii) metal pollution due to galactic winds originated in a nearby halo. Given such a complex scenario it is not surprising that in the literature there have been many investigations focused on characterizing the Population III star formation rate and the nature of the transition from Population III star formed in minihalos to Population III stars formed in halos and from Population III to Population II (Mackey et al., 2003; Furlanetto & Loeb, 2005; Greif & Bromm, 2006; Smith et al., 2008).
The formation of Population III stars is typically investigated by means of two complementary approaches: (i) analytic models aimed at deriving an average star formation rate - these usually rely on a dark matter halo formation rate derived with a Press & Schechter (1974) like formalism combined with recipes to populate the dark halos with Population III stars (Mackey et al., 2003; Greif & Bromm, 2006; Wyithe & Chen, 2006); (ii) high resolution hydrodynamic - radiative transfer simulations that follow in detail the collapse and the early stages of formation of a single Population III star (e.g. see Abel et al., 2002; O’Shea & Norman, 2007, 2008; Yoshida et al., 2008).
In this paper we have two main objectives. First, we focus on the characterization of the global star formation rate of Population III stars, thus adopting an analytical approach. We resort to physically motivated recipes to identify the conditions under which it is expected that the primordial gas within a dark matter halo can cool and trigger a gravitational instability which leads to a protostellar core. These recipes include the effects of a photo-dissociating Lyman Werner background derived both self-consistently from our model as well as by adopting a reference reionization history of the Universe.
Our second goal is to quantify the probability that a newly formed dark matter halo with virial temperature has been previously enriched by one or more episodes of Population III formation in one of its parent halos. Chemical enrichment of such halos is in fact crucial not only to assert the relative contribution of Population III star formation via the atomic and molecular cooling channels, but also to evaluate the formation rate of quasistars (Begelman et al., 2006) at which have been proposed as progenitors of the supermassive black holes present after the end of reionization. Quasistars are in fact able to form only if the gas is not polluted by metals (Omukai et al., 2008). Our novel approach to self-enrichment is based on the properties of the Gaussian random field of the primordial density fluctuations, which allow us to derive a closed form for the probability that a dark matter halo of mass at redshift had at redshift a progenitor of mass (Trenti & Stiavelli, 2007). We then combine our results on self-enrichment with the probability of wind pollution derived by Furlanetto & Loeb (2003) to infer the overall likeliness of collapse of pristine gas in halos with .
This paper is organized as follows. In Sec. 2 we introduce our model for Population III star formation, including radiative and self-enrichment feedback; The model is applied in Sec. 3 to derive the global Population III star formation rate and in Sec. 4 to obtain the enrichment probability of dark matter halos. Sec. 5 discusses the implications in terms of contributions to reionization from Population III stars and Sec. 6 concludes.
2 Population III star formation model
To derive the star formation rate of Population III stars we combine the dark matter halo formation rate with an analytical model to populate halos with stars. In this paper we assume a flat concordance cosmology, with the cosmological parameters given by the WMAP Yr5 best fitting parameters (Komatsu et al., 2008): , , , , , . We also assume a primordial helium mass fraction (Peimbert et al., 2006).
2.1 Minimum Minihalo Mass for Population III formation
The minimum dark matter halo mass capable of cooling by molecular hydrogen at redshift is estimated by requiring the cooling time to be no larger than the local Hubble time (e.g. see Couchman & Rees 1986). We write the cooling time as:
| (1) |
where is Boltzmann’s constant and is the virial temperature of the halo, is the cooling function per molecule, which depends on the temperature and on the hydrogen number density and is the molecular to atomic hydrogen fraction. We write following Tegmark et al. (1997) as:
| (2) |
For the molecular hydrogen cooling function , we use the form derived by Galli & Palla (1998), which we approximate between the temperatures of 120 K and 6400K (the range we are interested in for cooling in minihalos) with:
| (3) |
We estimate the hydrogen number density in a halo from its virial density (e.g. Eq. 22 of Tegmark et al. 1997) to find:
| (4) |
Replacing Eqs. 2, 3, 4 in Eq. 1, we find:
| (5) |
We can then obtain the molecular hydrogen fraction required for cooling by equating the cooling time given by Eq. 5 to the local Hubble time , approximated at as:
| (6) |
This gives us:
| (7) |
Tegmark et al. (1997) determine the (maximum) molecular hydrogen fraction capable of forming in a halo as:
| (8) |
Equating the required molecular hydrogen fraction for cooling within a Hubble time given by Eq. 7 with the maximum that can form (assuming ) we find the minimum mass for a minihalo in order to cool within a Hubble time (), namely:
| (9) |
2.2 Minimum cooling mass in presence of radiative feedback
In order to compute the effect of a radiative flux in the Lyman-Werner band on the formation rate of molecular hydrogen and on the cooling of a minihalo, we resort to an approach based on Machacek et al. (2003). We obtain the minimum halo mass capable of cooling via in the presence of a LW background by equating the timescale for photo-dissociation of molecular hydrogen () to its formation timescale ().
In presence of a LW flux (whose calculation is presented below in Sec. 2.7), the dissociation timescale can be written as (Machacek et al., 2003):
| (10) |
The formation time scale is given by:
| (11) |
where cm3 s-1 is the H- formation rate which dominates the formation of molecular hydrogen and is the electron density. is obtained assuming a residual ionizing fraction (Peebles, 1993). Imposing the equilibrium molecular hydrogen function to be the minimum needed for collapse as given by Eq. 7 we finally find:
| (12) |
We note that Eq. 12 is in good agreement with the results by Machacek et al. (2003) at . Our derivation does however include an explicit redshift dependence. Eq. 12 also compares well with the results of numerical simulations by O’Shea & Norman (2008), which include LW background of varying intensities. The redshift dependence which we find increases the minimum mass required for cooling with respect to the formula by Machacek et al. (2003) at and this gives us a better agreement with the numerical results, obtained for (see Fig. 3 in O’Shea & Norman 2008).
2.3 Cooling in halos with
Pristine halos with a virial temperature above can cool irrespective of the LW background intensity (O’Shea & Norman, 2008). In fact, not only atomic hydrogen cooling becomes in principle available, but also cosmological simulations by O’Shea & Norman (2008) have shown that a small fraction of can still be produced at the center of the halo thanks to the high density and self-shielding of the surrounding gas. Once the gas temperature starts to decrease, further cooling and collapse will proceed progressively faster via molecular hydrogen as the halo temperature is initially high enough to enhance the abundance of , a precursor for production (Lepp & Shull, 1984). In our model we thus consider that all halos above the limit will cool efficiently:
| (14) |
2.4 Forming Population III stars
There is of course a delay between the virialization of a dark matter halo potentially able to cool via — that is of mass (Eq. 13) — and the actual formation of a Population III star. We estimate this delay considering two contributions: (i) the actual time needed to cool down to a few hundreds degrees Kelvin and (ii) the free fall time for the gravitational collapse once cooling has triggered the Jeans instability.
The cooling time can be obtained by Eqs. 5 and 8:
| (15) |
while the free fall time can be obtained from the Jeans instability timescale, taking into account that during the cooling phase the density of the gas has increased by about a factor :
| (16) |
Therefore a Population III star originated in dark halo virialized at redshift will be formed at redshift such that:
| (17) |
where the right side of the equation simply derives from the age of the Universe at (Eq. 6).
2.5 Metal enrichment probability
In order to account for previous episodes of Population III star formation in a progenitor of a halo of mass at redshift , we resort to the method presented in Trenti & Stiavelli (2007), based on the linear growth of density perturbation in the context of spherical collapse. We start by assuming that a newly virialized halo has an average linear overdensity as estimated by a top-hat filter on a scale . Then for a progenitor mass we compute the extra variance in the density power spectrum and then the refinement factor . With these ingredients we can write the probability distribution for the maximum of Gaussian random numbers with variance as the derivative of the power of the Partition function for a normal distribution with zero mean and variance . In the context of spherical collapse this translates to a probability distribution for the formation redshift of the first progenitor of mass of a halo virialized at .
For every progenitor mass we then compute the delay time () needed to form a Population III star in the parent halo and from this we derive the minimum redshift () at which such a halo must form in order to pre-seed the descendant halo. Of course, for some values of the delay time might be longer than the Hubble time, this simply means that no pre-seeding is possible from parent halos of mass . We then integrate the probability distribution for the formation time of the parent of mass for to obtain the preseeding probability from a progenitor at this mass scale. The overall probability of preseeding is the maximum preseeding probability computed over all the possible progenitor masses.
2.6 From dark matter to stars
The dark matter halo formation rate is derived in our reference model using the Sheth & Tormen (1999) mass function. The Sheth & Tormen (1999) mass function is in better agreement with N-body simulations than the Press & Schechter (1974) mass function at (Heitmann et al., 2006; Reed et al., 2006). Note that differences of have been observed between the measurements from cosmological simulations and the Sheth & Tormen (1999) mass function and that the Warren et al. (2006) mass function appears a better match to the numerical results (Lukić et al., 2007). However the Sheth & Tormen (1999) and the Warren et al. (2006) formulae give very similar results in the range of halo masses of interest for Population III star formation ( — see Fig. 3 in Lukić et al. 2007) thus we keep the Sheth & Tormen (1999) model as our reference. We then compute the formation rate of Population III stars by integrating between and the number of halos per unit mass per unit redshift , convolved with the probability that such halos are pristine (see Sec. 2.5).
The characteristic mass of Population III stars and the form of their initial mass function are highly uncertain, even though they are likely very massive — of the order of — (e.g. see Bromm & Larson, 2004). This expectation is based on theoretical models and numerical simulations (Abel et al., 2002; Omukai & Yoshii, 2003; Yoshida et al., 2006; Gao et al., 2007), but there is some tension with the abundance patterns observed in the most metal poor Milky Way stars, which are better explained under the assumption that their progenitor Population III stars were only moderately massive — — (Tumlinson, 2006). There is however no guarantee that the progenitors of the extremely metal poor stars considered by Tumlinson (2006) are Population III stars formed before the reionization of the Universe: if their progenitors formed instead in presence of a strong UV background within a reionized bubble, then their expected mass is about fully consistent with the inference from the observations (Yoshida et al., 2007). Within this complex scenario we choose to adopt conventionally one Population III per minihalo (O’Shea & Norman, 2007) and we consider a Salpeter (1955) mass function in the range (average mass ), as suggested by the theoretical investigations. A modification in the initial mass function used in our model primarily affects the enrichment history of the IGM and thus the transition toward Population II star formation. If Population III stars are less massive than we assume, then the efficiency of metal pollution may be reduced as core collapse supernovae explosions are not as energetic as pair instability ones (Heger et al., 2003). A mass function more biased toward very massive stars with would also reduce the efficiency of metal pollution, because these stars directly collapse into black holes without an explosive phase (Heger et al., 2003).
The formation rate for Population III stars in halos with is similarly computed from the dark matter halo mass function for , again after convolution with the probability that the gas forming new halos has not been contaminated by metals. As no sign of fragmentation has been found during the collapse of metal free halos with masses up to (O’Shea & Norman, 2008), we adopt the same initial mass function as for cooled Population IIIs (one star per halo, Salpeter in ). The efficiency of star formation is however uncertain and thus we explore different models where multiple Population III stars in a single halo are allowed, adopting a reference star formation efficiency (star to gas mass ratio) of and .
Finally the star formation rate in enriched gas (Population II stars) is computed by convolving the dark matter halo mass function with the preseeding probability (the complementary of the pristine probability) and assuming a star formation efficiency of or (to explore the uncertainties in this parameter), a Salpeter mass function from in the range (average mass ) and an average metallicity . Our choice of the IMF for metal enriched gas reflects the expectation that the typical mass of stars was higher at higher redshift (Tumlinson, 2007). In our model, the IMF of metal enriched star formation impacts the radiative LW feedback, but only in a minor way due to its self-regulating nature (see Sec. 3).
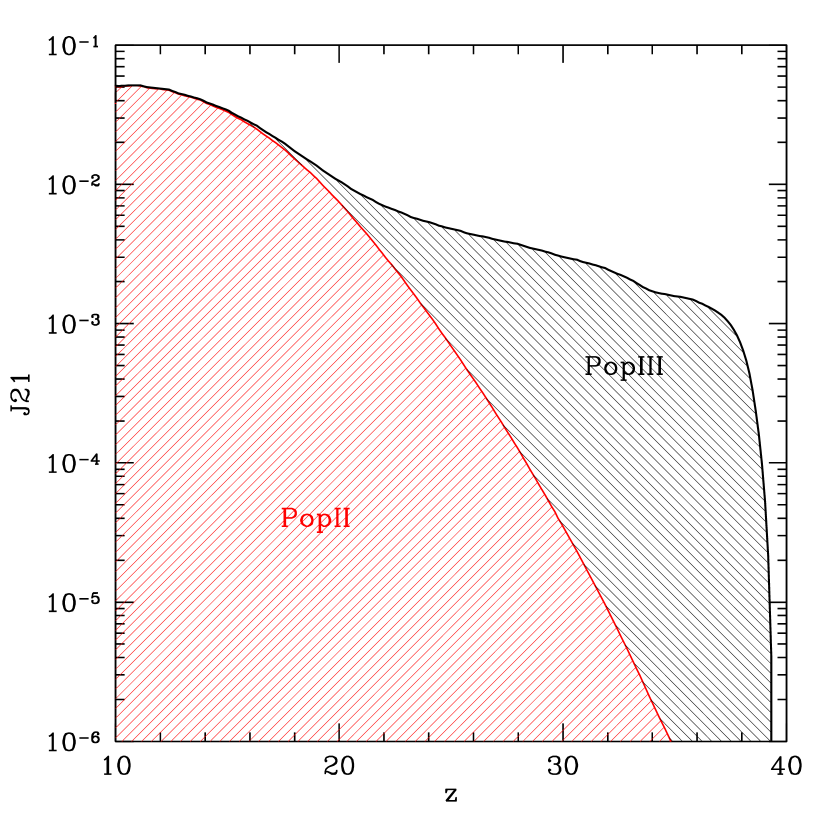
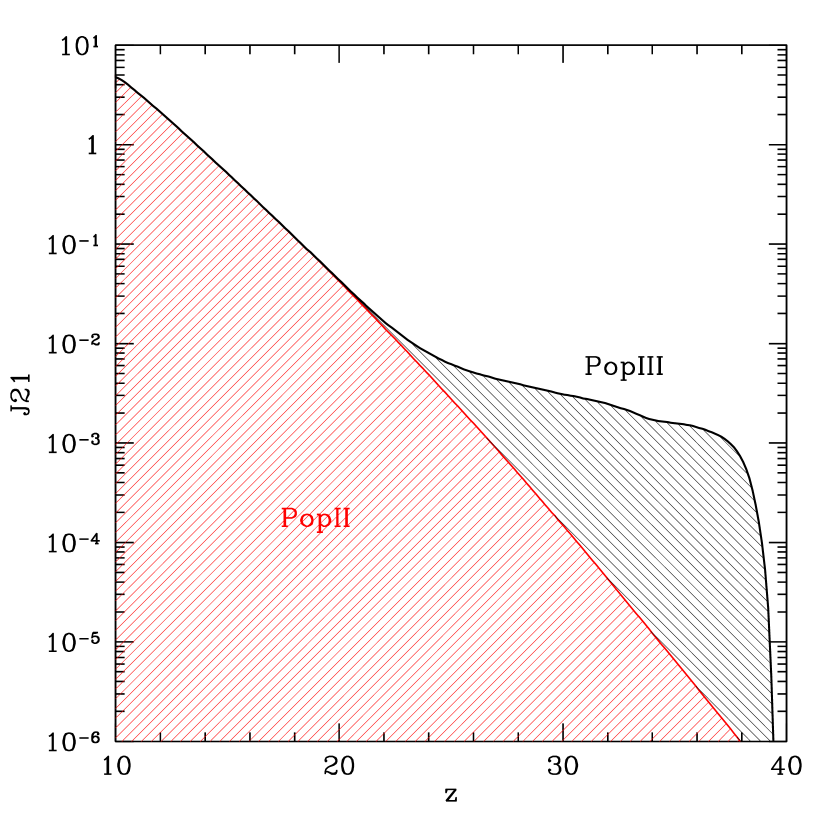
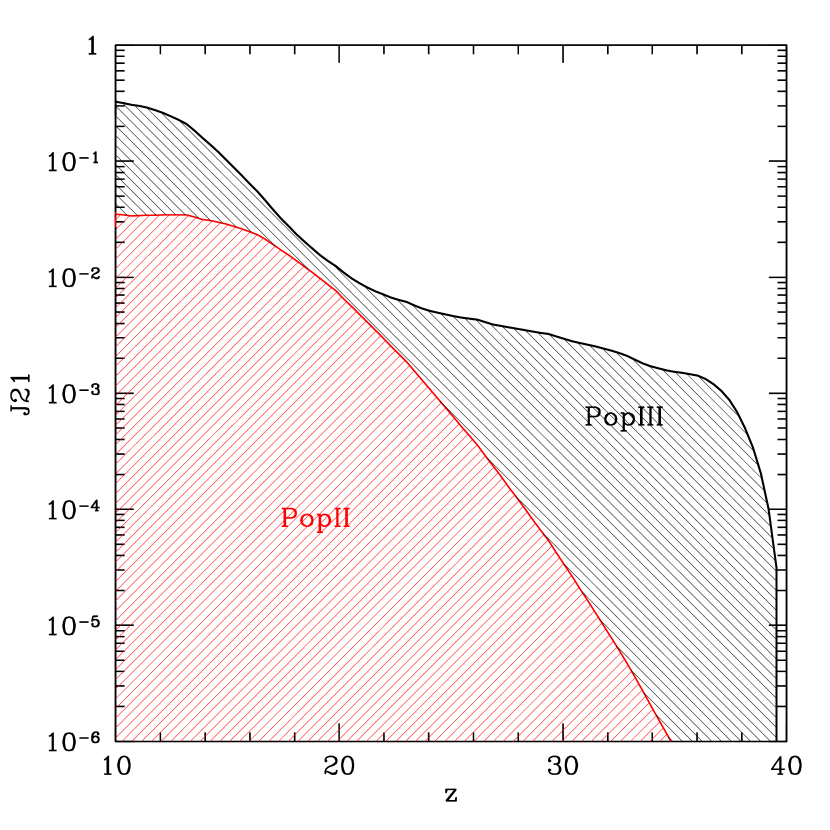
2.7 Flux in the LW band
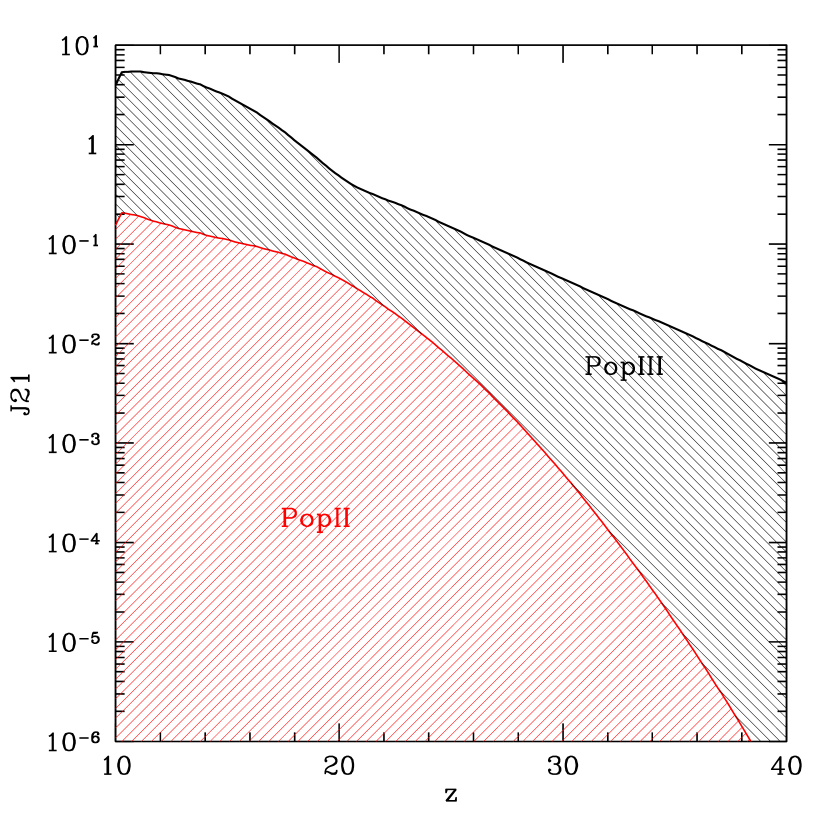
We compute the LW flux that enters in Eqs. 10 by means of two different approaches: (i) self-consistently from our model, based on the star formation rate and (ii) adding a reference number of LW photons to those derived self-consistently in order to take into account Population II formation not included in our model. The first method is most suitable at , when Population III are most likely the dominant sources of radiation. At lower redshift protogalaxies become more and more common, the Universe starts becoming reionized and our simple model for star formation does not capture all the Population II formation that is available, therefore using a reference LW photons production provides a good check on the validity of our assumed LW flux.
For the self-consistent LW flux calculation, we obtain that Population III stars following our assumed IMF emit a LW flux that is of the ionizing flux (Schaerer, 2003). Metal enriched stars have instead a higher ration of LW to ionizing photons, because these stars have a lower effective temperature, but their LW photon yield per unit mass is also lower. We assume the following photon yields over the star lifetime (based on Schaerer 2003):
-
1.
Population III: ;
-
2.
Population II: ;
The comoving LW photon density is then associated to a flux:
| (18) |
In order to compute we only consider star-formation that has happened within a redshift interval such that the photons have not been redshifted out of the LW band on average. This means that the upper limit, expressed in term of the redshift is . We also take into account the screen provided by primordial present in the IGM outside virialized halos, which can absorbs LW photons. Following Trenti & Stiavelli (2007) a flux of is needed to photo-dissociate a molecular hydrogen density of times the neutral hydrogen density. Of course, a (very) small residual fraction of will still be present but the re-formation of outside virialized structures is strongly suppressed not only by the radiative feedback, but also by the decreased average density of the universe compared to that at the time of primordial formation ( — see Peebles 1993).
For the LW flux based on a fixed reionization history of the Universe, we assume that the number of LW photons is that produced self-consistently by Population III plus a contribution from other sources which reaches at (corresponding to ). As a model for the redshift dependence of we take inspiration from the rapid growth of the fraction of mass in collapsed dark matter halos that can host stars and we write:
| (19) |
The flux in the LW band approximately matches the reionizing flux given for a stellar population with a Salpeter IMF in the range and metallicity (Schaerer, 2003). Thus Eq. 19 implies that about one ionizing photon per hydrogen atom is emitted at redshift , a budget still well short of what is required for reionization after considering the clumpiness of the IGM and recombination.
3 Population III star formation rates
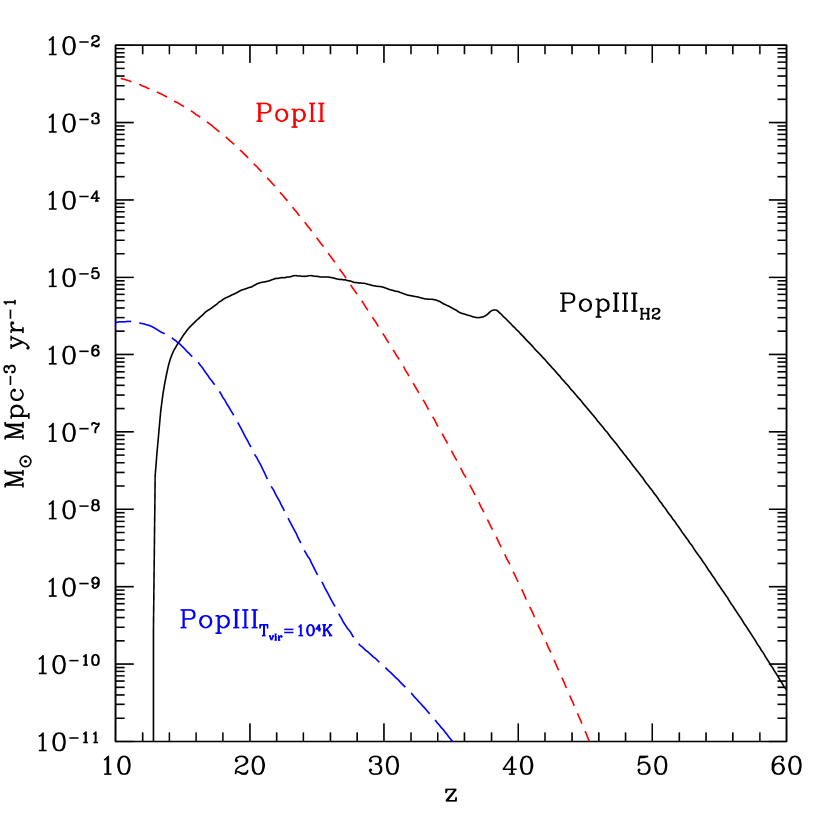
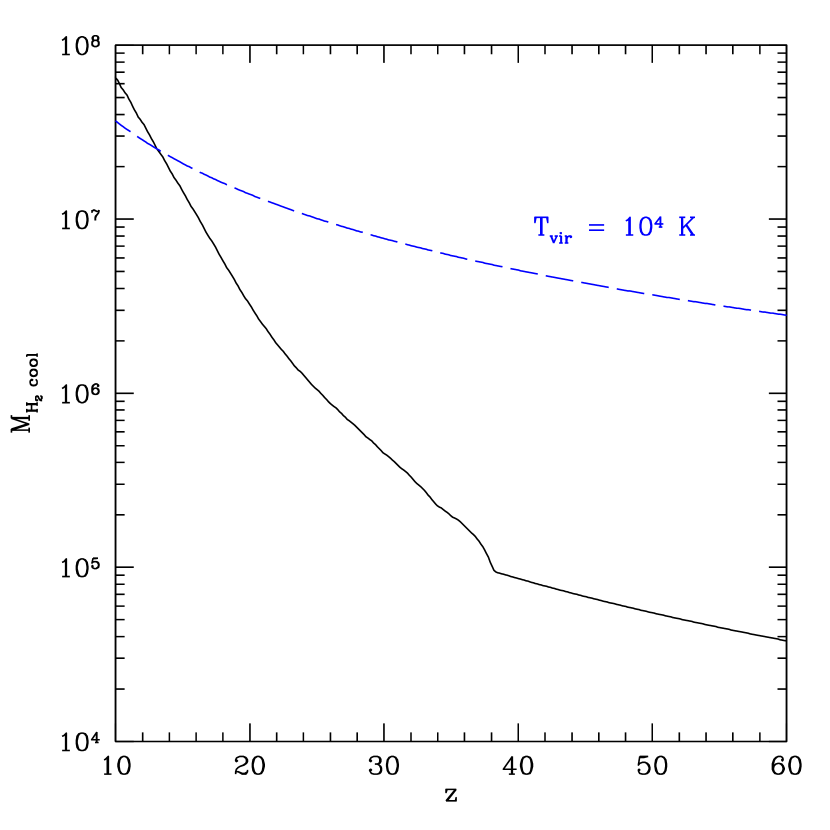
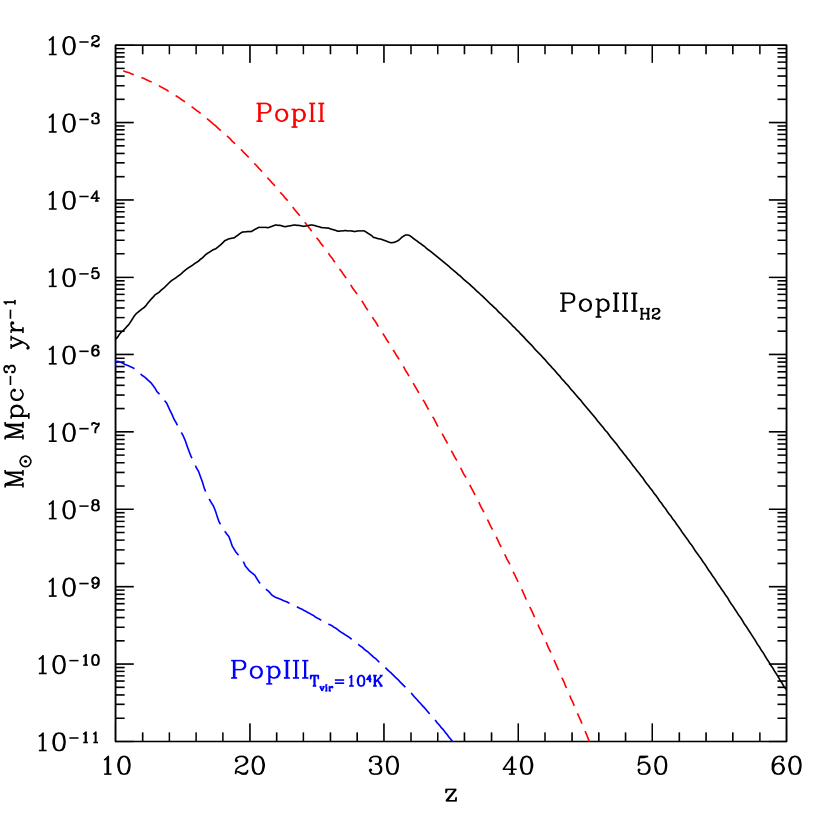
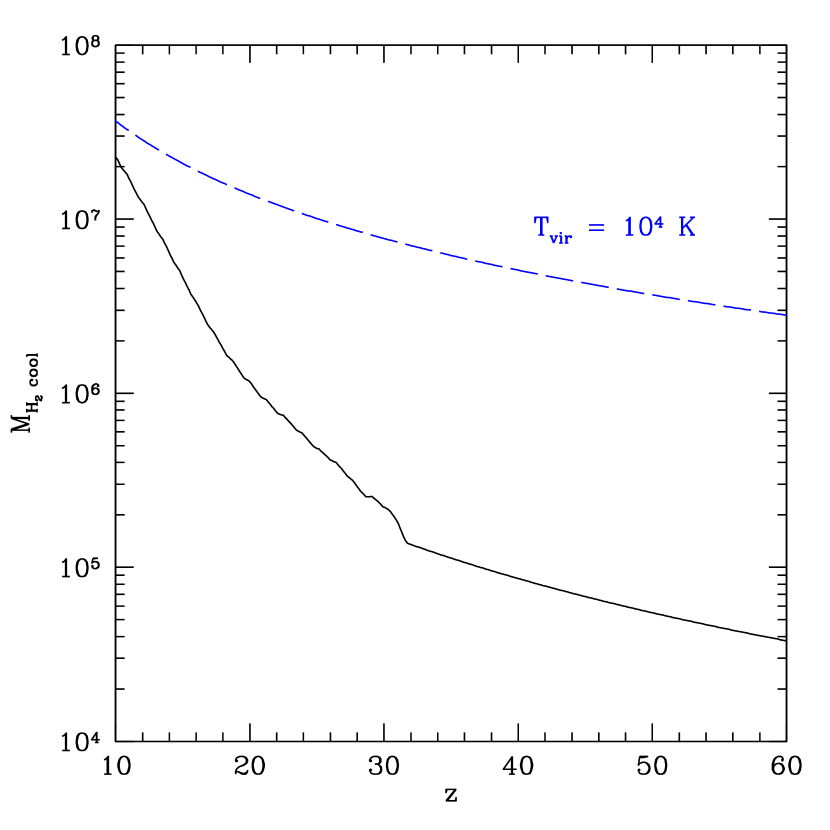
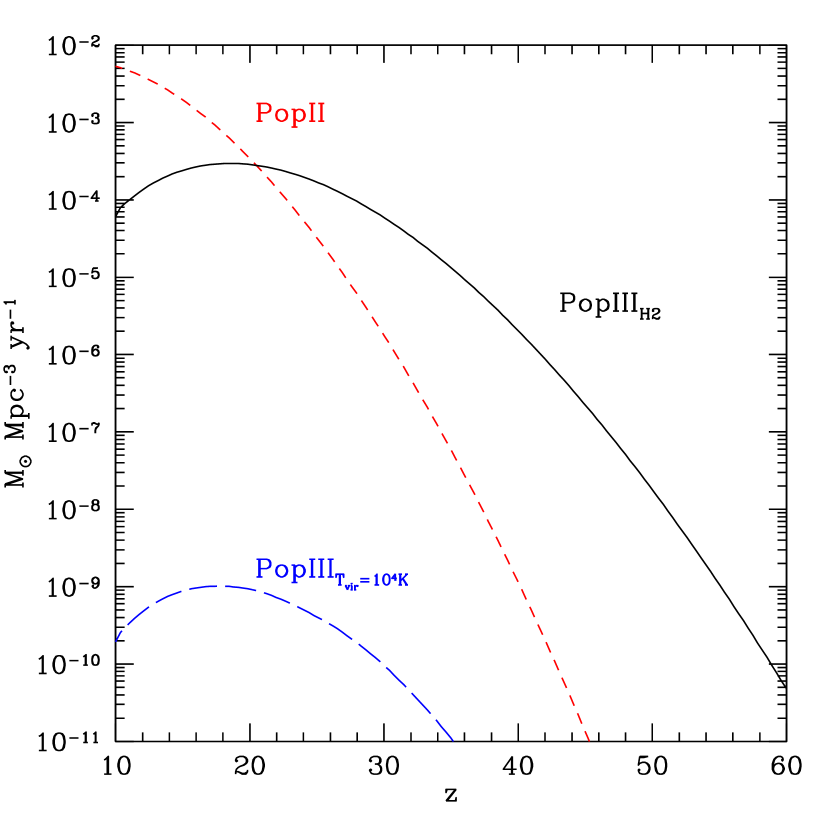
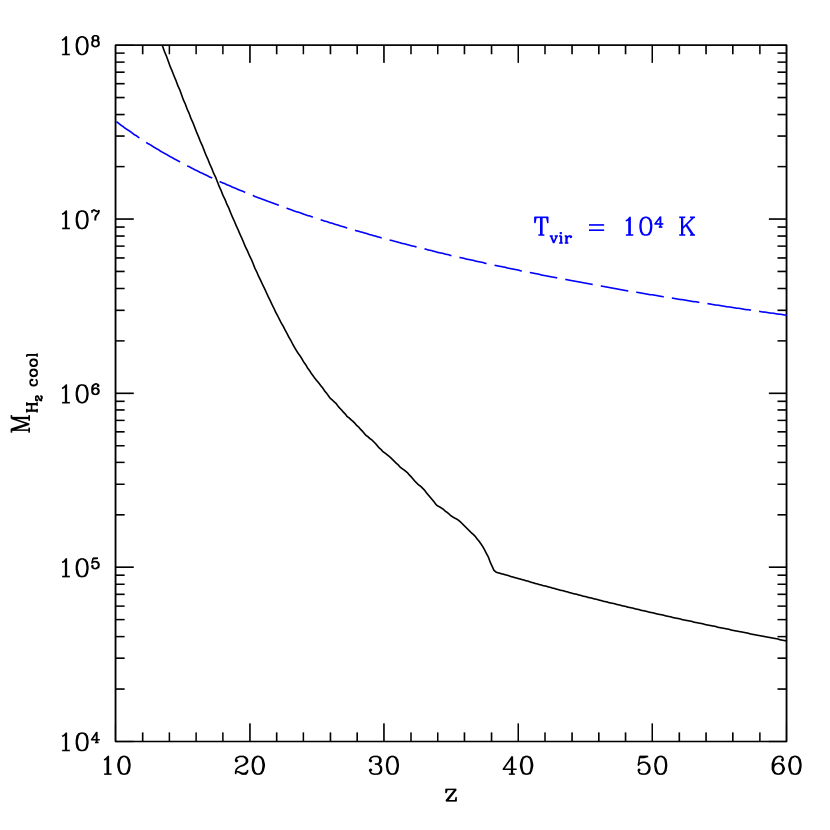
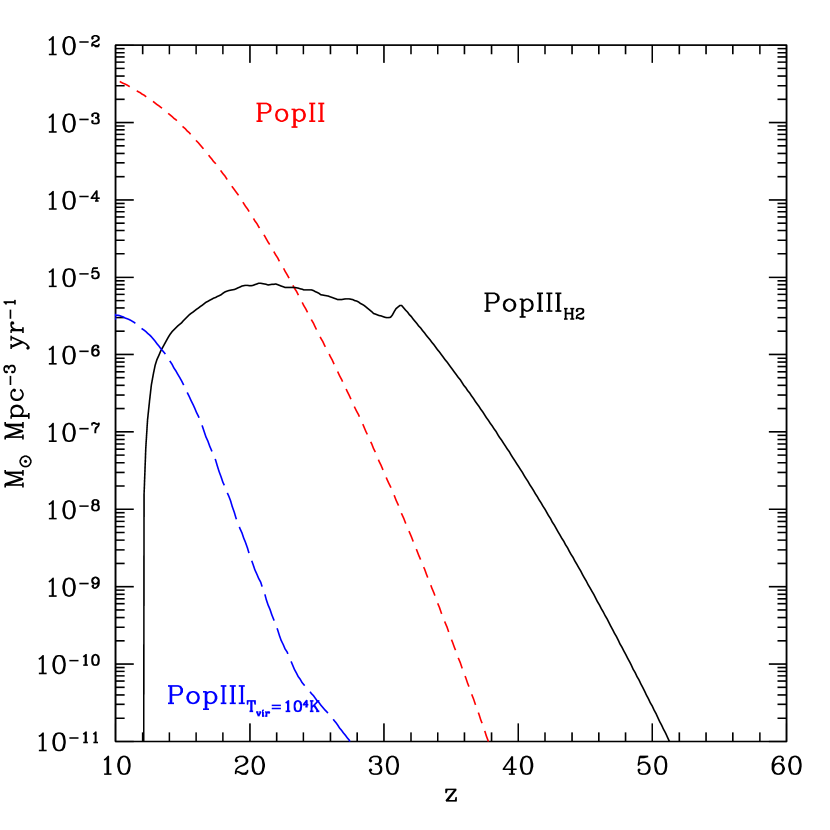
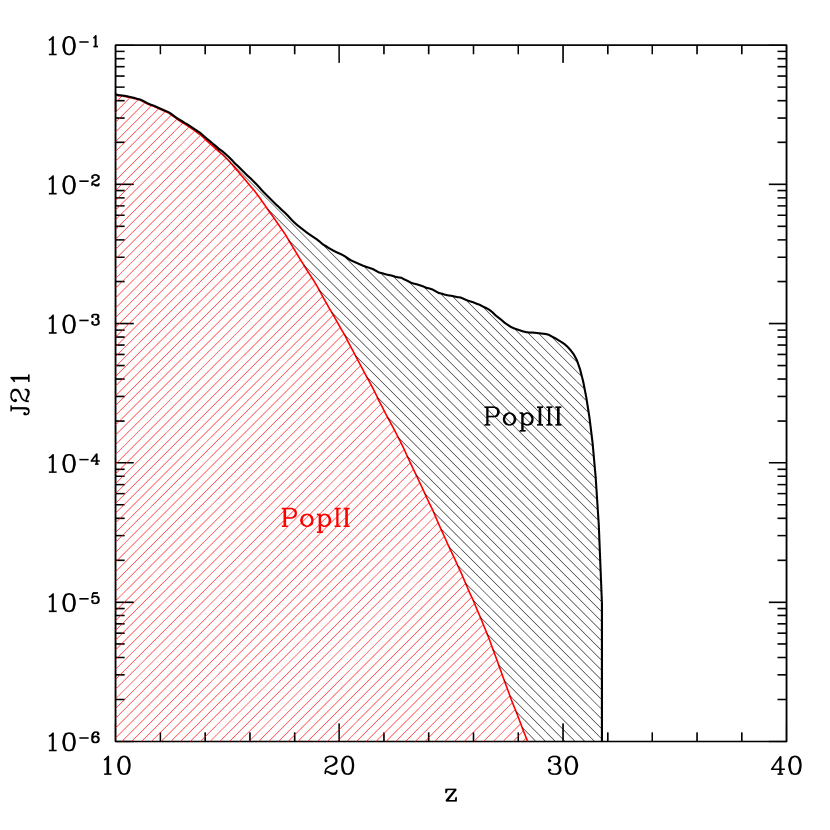
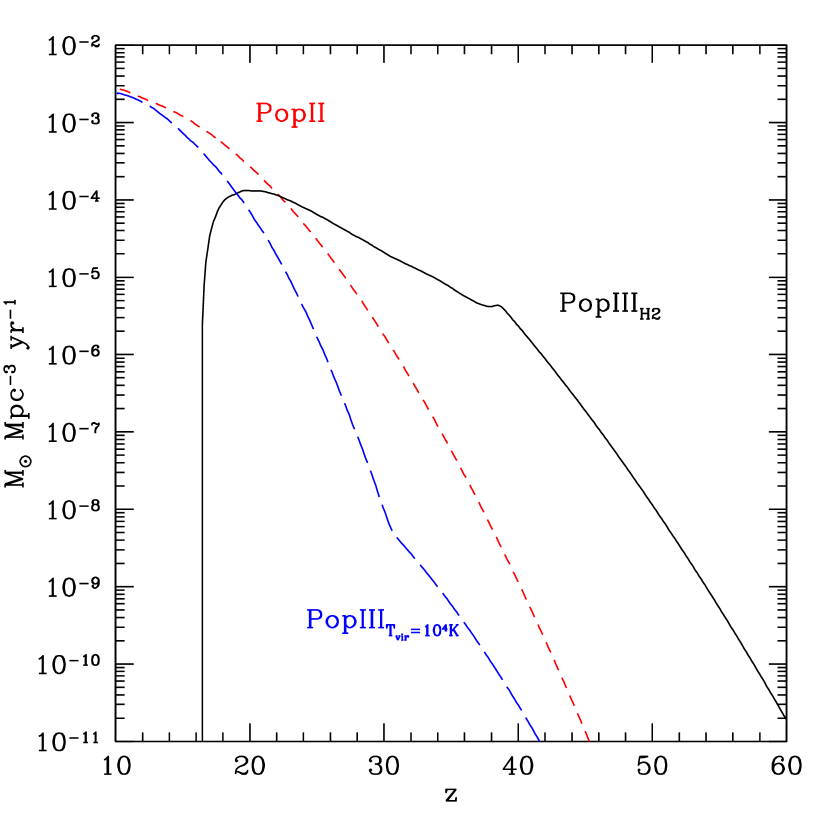
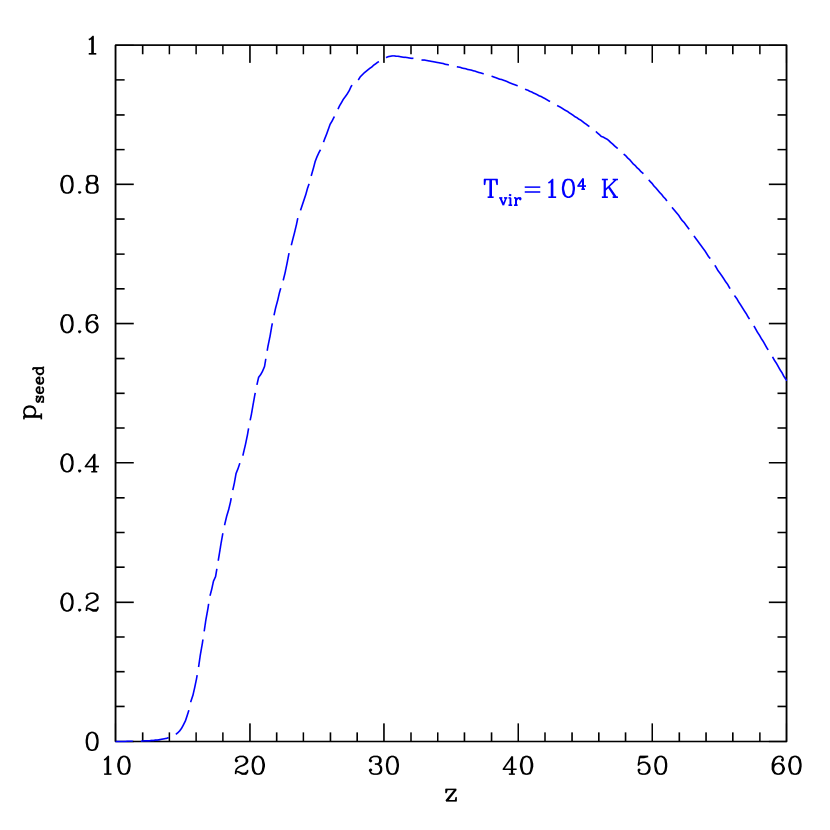
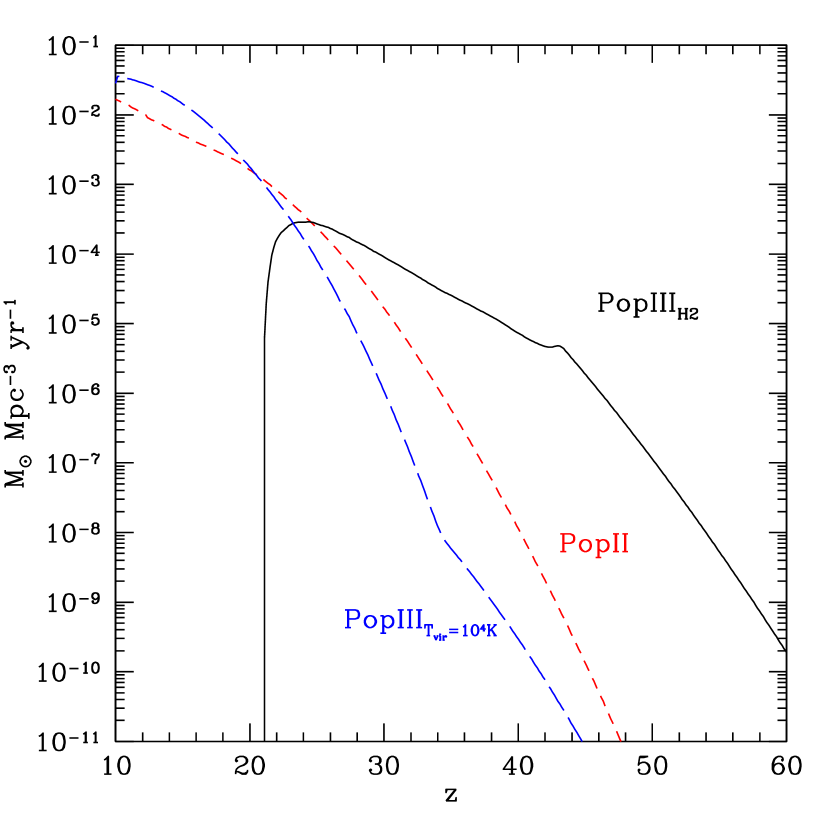
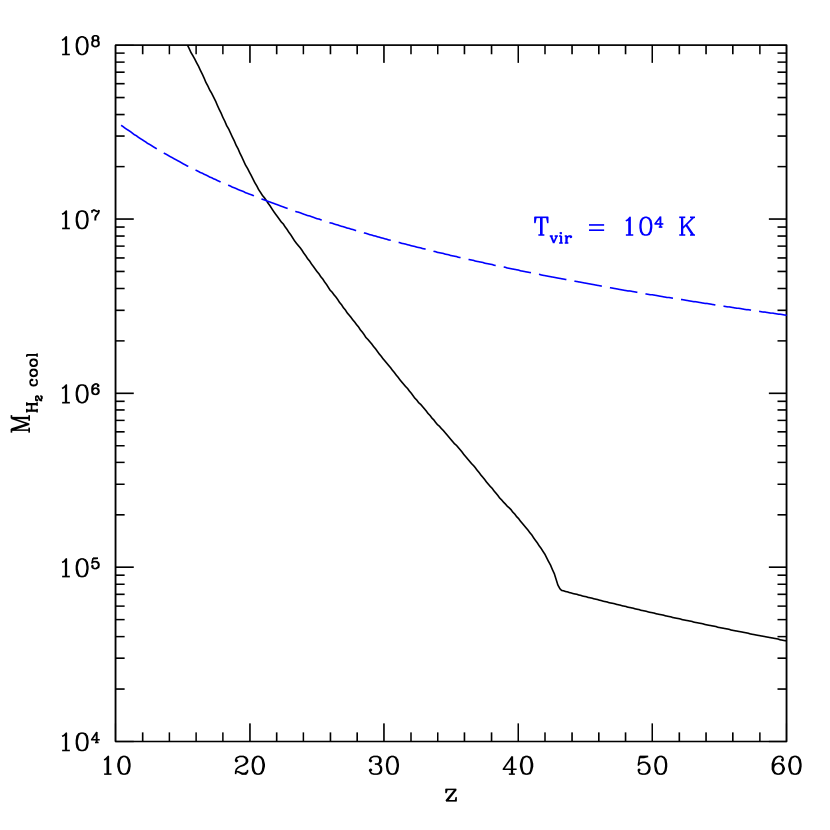
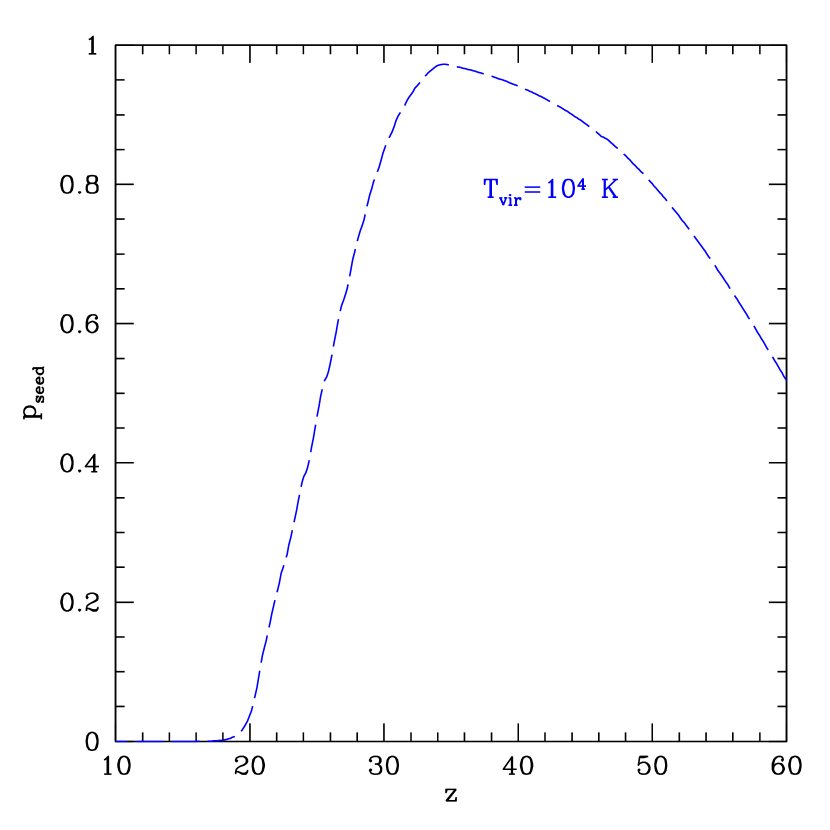
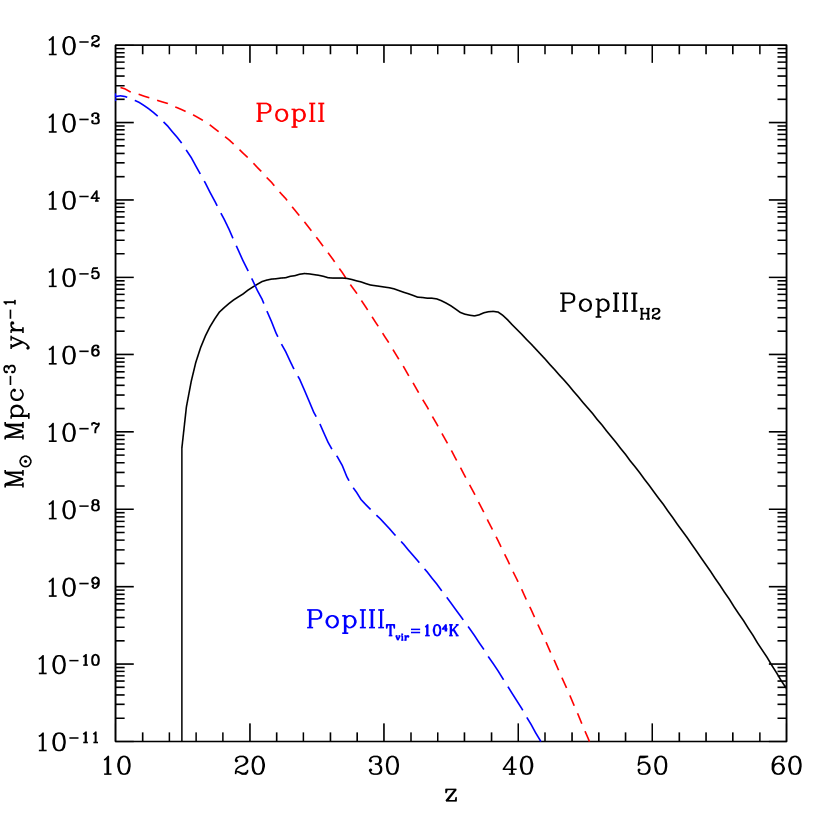
From our fiducial model, which has one first star per halo (see Table 1 for a summary of the main parameters), it is immediate to note that Population III stars initiate the chemical enrichment of the Universe well before redshift (see Fig. 1). This result derives from the relatively small mass required at very high redshift to be able to cool via molecular hydrogen. Such mass is in fact as low as at . At lower redshift the minimum mass for cooling progressively increases but halos capable of cooling become more and more common, so the Population III star formation rate steadily increases. Eventually — around redshift — radiative feedback in the LW band starts to significantly increase the mass required for cooling and the star formation rate of this class of Population III stars levels off at , that is about one star in a comoving Mpc3 formed per unit redshift. In our reference model the self-shielding mass becomes larger than that of a halo at . Following Sec. 2.3 we assume that such halos can cool independently of the LW background intensity.
Forming Population III stars in these more massive halos is possible only if there were no previous episode of star formation within their progenitors. Thus, as long as cooling can be efficiently achieved via , halos with are most likely chemically enriched (see bottom right panel of Fig. 1) and Population III stars in these halos are very rare compared to their counterparts in minihalos (see the upper left panel of the same figure). Their star formation rate becomes higher than that in minihalos only at , when the LW feedback strongly suppresses cooling and thus it is more likely that a halo made entirely of pristine gas is able to grow via mergers to reach before having the possibility to cool.
The majority of halos with at have been instead chemically enriched and Population II star formation grows rapidly in time. By it becomes the dominant factor in the global star formation rate, despite our conservative assumption that only of the gas is converted into stars (but note that this is still larger than the efficiency in Population III stars at if only one per halo is formed). This early rise of Population II is a novel result which derives from our detailed treatment of self-enrichment. When metal transport is instead modeled via winds, then transition toward Population II stars is predicted significantly later, at (Furlanetto & Loeb, 2003, 2005).
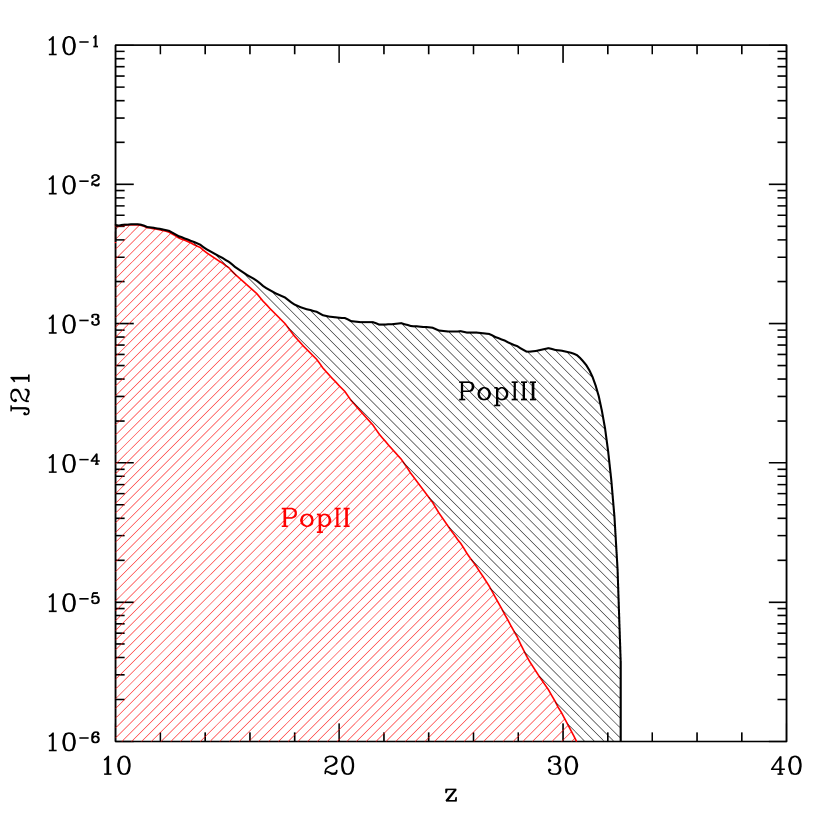
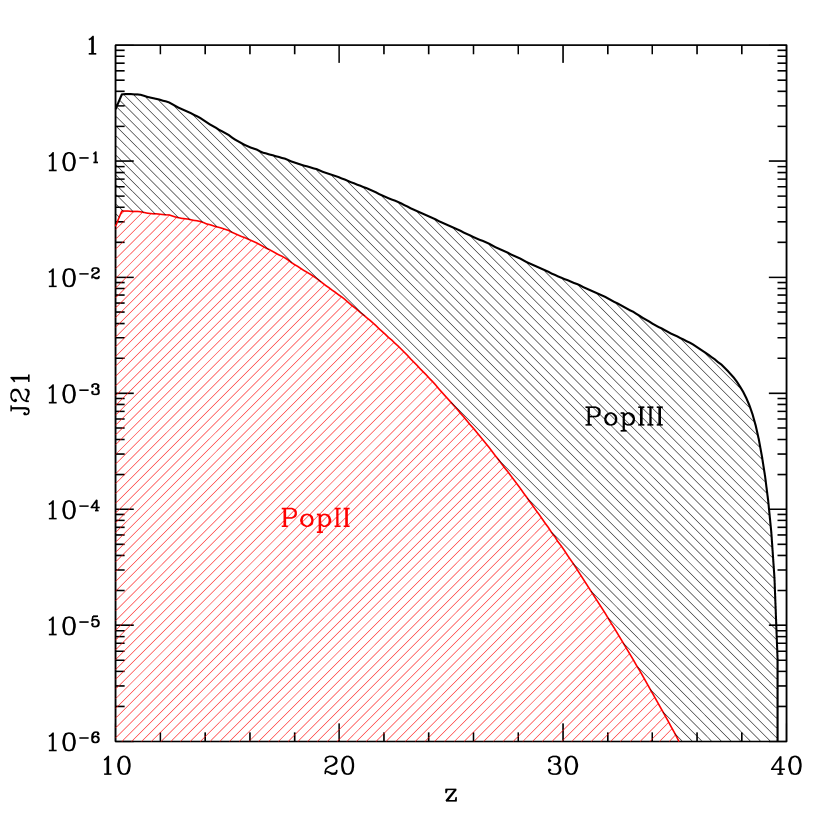
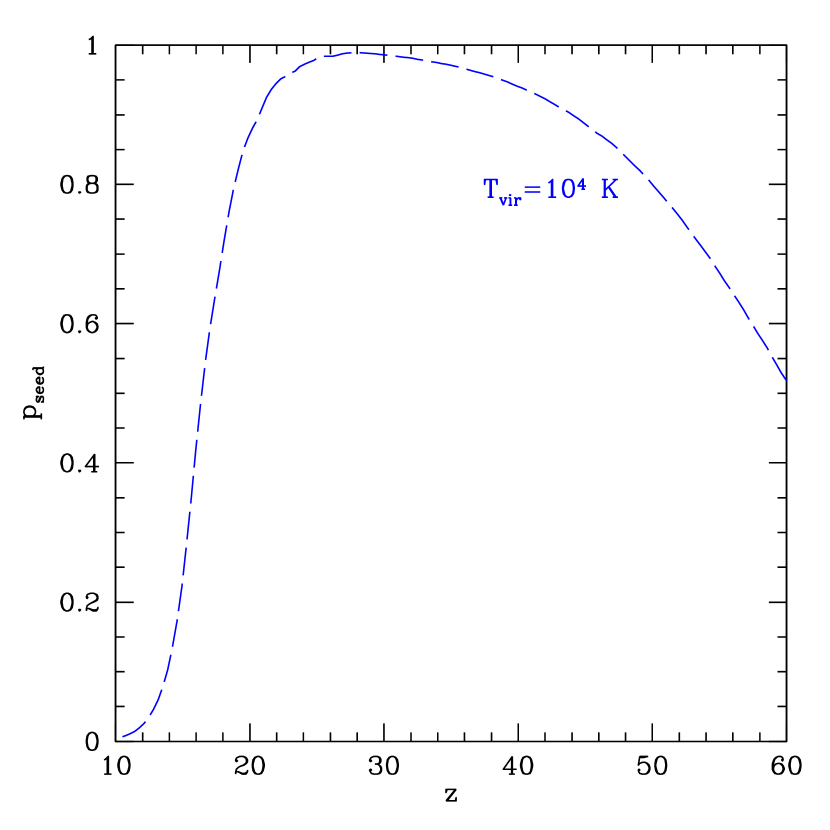
The qualitative picture described in our standard model holds even if we vary the free parameters that regulates radiative feedback. In Fig. 2 we show the star formation history when LW feedback is strongly suppressed. Population III stars are formed at a higher rate at compared to the standard model, but the difference is only a factor of a few (here the formation rate goes up to . This is about one fourth of the peak formation rate without any radiative feedback (see Fig. 3). The main difference from the standard scenario is that Population III stars formed in halos with are now suppressed even at , because the enrichment probability of massive halos remains high (see bottom right panel in fig. 2). The formation of Population II stars is instead essentially as in the standard model. Note that the picture does not deviate significantly from the standard model if we vary the efficiency of star formation in Population II stars, except of course for a corresponding proportional variation of their star formation rate. In fact Population III stars in minihalos are the main agents of the radiative feedback that leads to their suppression at (see bottom left panel in Figs. 1-2). Therefore their formation is self-regulated and tends to reach an equilibrium level. Similar results hold even when we add a stronger radiative feedback based on the fixed Lyman Werner background given by Eq. 19 (see Fig. 4). Note that in this case the background radiation greatly exceeds that created by Population III stars at and thus the suppression of cooling is even sharper.
Fig. 5 shows a model with our standard parameters except for the use of the Press & Schechter (1974) mass function rather than the Sheth & Tormen (1999) formula. The predictions for the Population III formation rate are very different at , but once the self-regulated feedback phase starts the two models converge together. The strong difference at originates from the fact that Population III stars are hosted in very rare peaks at such early times: in the Press & Schechter (1974) formalism these halos have and the ratio of the Sheth-Tormen to Press-Schechter mass function is proportional to in the limit of very large . An interesting open question is the form of the mass function for such rare peaks, which are expected to be progressively more spherical as they become rarer (Bardeen et al., 1986). Fortunately the difference in the star formation rate does not propagate significantly below .
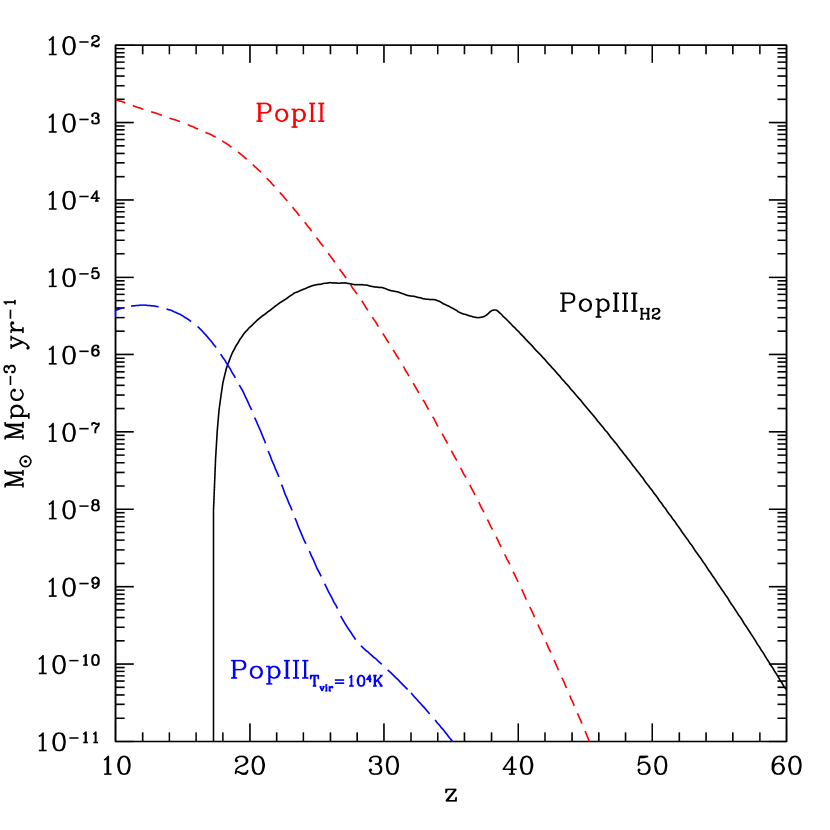
A major qualitative change in the star formation history during the Dark Ages arises if we allow for multiple Population III stars in a single halo (see Fig. 6). In this case the metal free star formation rate is comparable to that of second generation of stars (Population II) down to . From the star formation rate we can identify two eras: an early period dominated by Population III in minihalos up to and a later period where larger halos are still able to form metal free stars. This happens because by allowing multiple Population III stars in minihalos their formation rate is significantly enhanced at later redshift over the assumption of a single star per halo. In fact, when a significant LW background is present, a single minihalo can have up to of gas, thus a corresponds to a SFR 50 times higher than the one obtained for a single metal free star per halo. In this scenario metal free stars formed in halos appear to be several orders of magnitude more common than in our standard scenario, again because the star formation efficiency is increased by more than two orders of magnitude compared to our standard model. They are therefore expected to dominate the production of ionizing photons (see Sec. 5) until their formation is eventually expected to be terminated by chemical enrichment due to winds at .
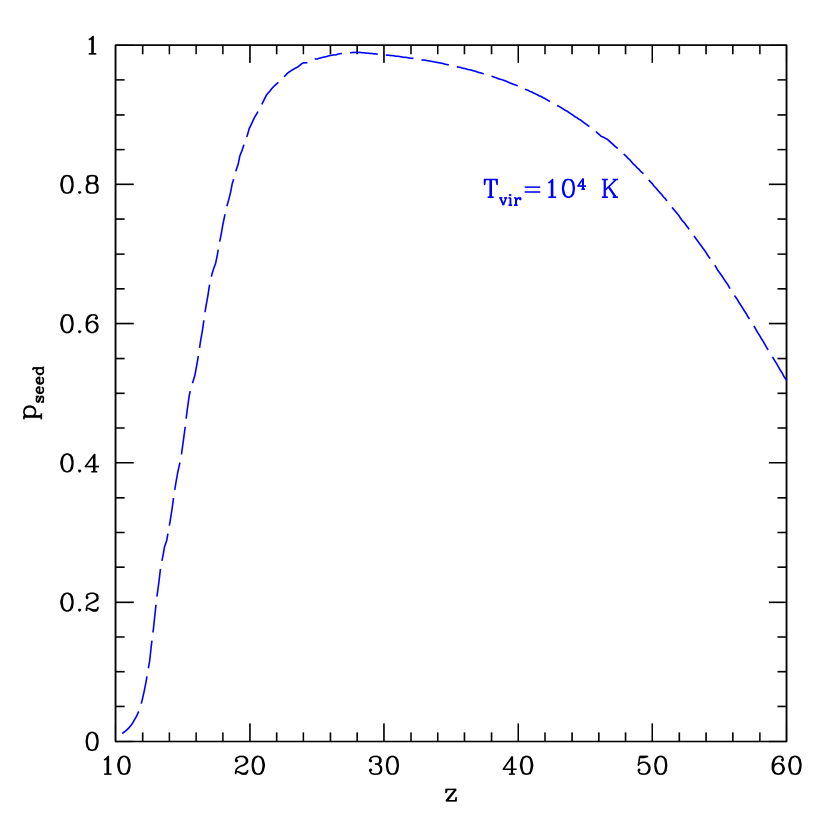
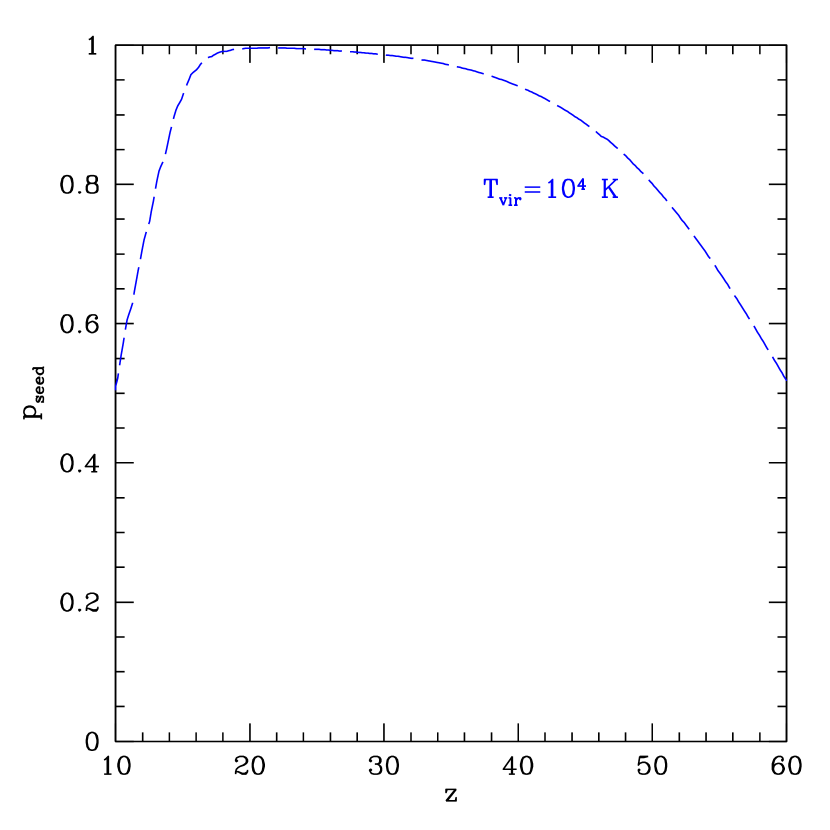
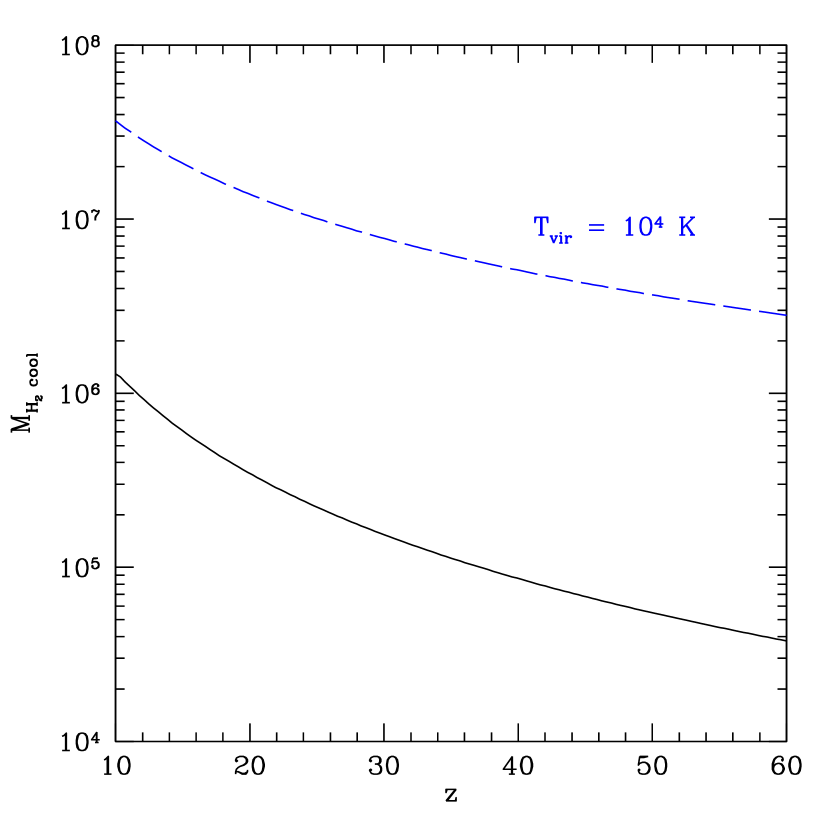
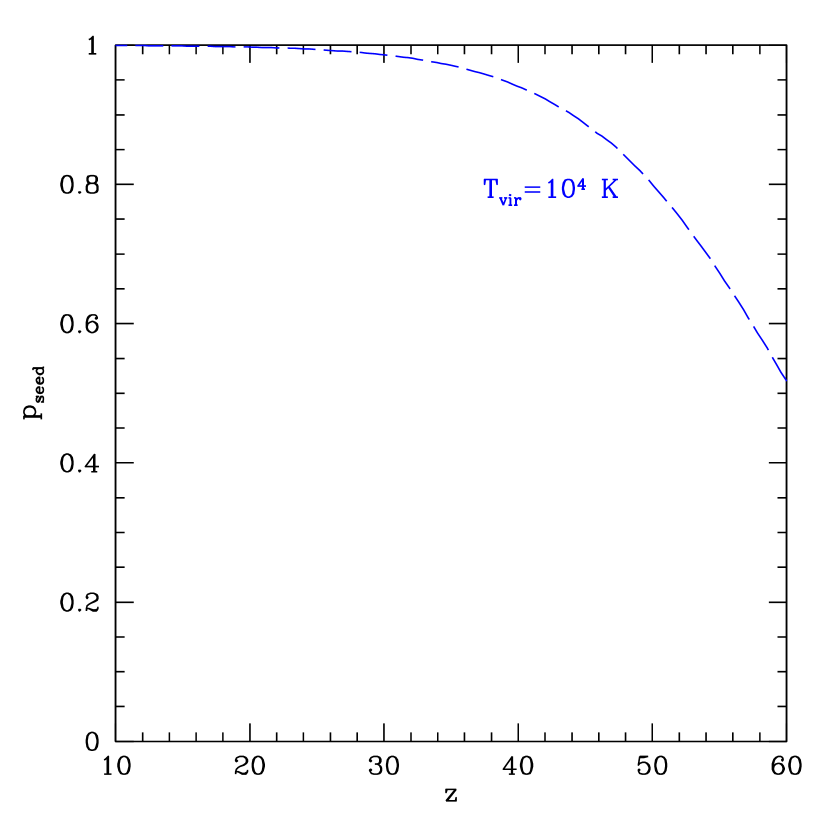
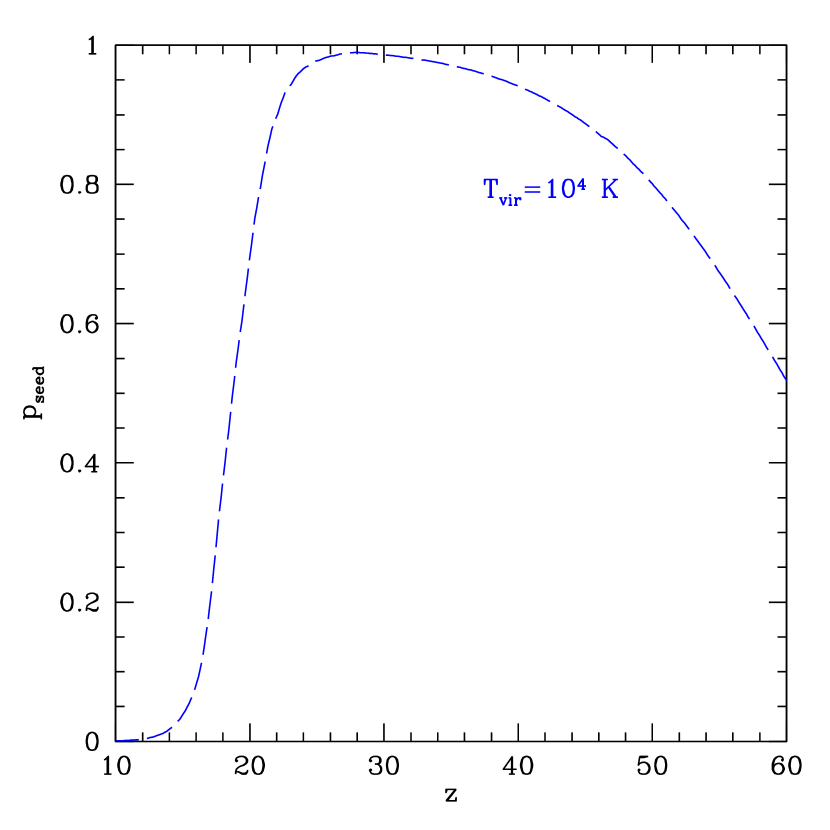
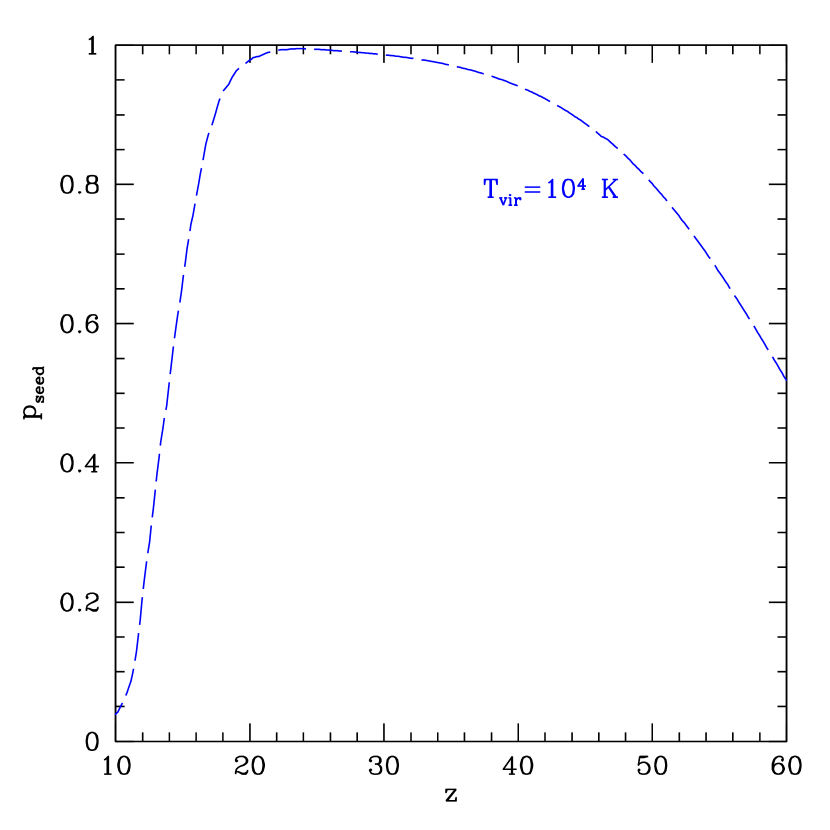
4 Consequences for the chemical enrichment of K halos
The first generation of Population III stars — formed in minihalos — releases metals into the IGM and opens the way to metal enriched star formation when the gas recollapses later as part of a larger halo. When the second generation halo has a virial temperature , the metallicity of its gas is expected to have been enriched to , high enough to mark a transition toward a different mode of star formation, especially if some dust is present (Schneider et al., 2006; Clark et al., 2008). Our model allows us to quantify the likelihood of this self-enrichment scenario as a function of the redshift of formation of a K halo (see bottom right panel in Fig. 1). Interestingly, the probability of having a pristine halo large enough to reach is small at very high redshift () and progressively increases as the redshift decreases. This apparently surprising result can be understood in terms of the difference in halo mass required to cool via molecular and atomic hydrogen. At , the difference in the two masses is large (see upper right panel in Fig. 1), hence it is highly likely that in the merger tree of the K halo there has been a progenitor halo that was able to form a Population III star via cooling at an earlier redshift. However, as the redshift decreases, the LW self-shielding mass grows and it becomes progressively more unlikely that one of the progenitor halos hosted a star. Therefore halos with are more likely to be metal free at lower redshift. Our model does however not include metal pollution by winds, which becomes progressively more important as the redshift decreases. In fact, the wind pollution model by Furlanetto & Loeb (2005) predicts a sharp drop in the probability of forming pristine halos around . Therefore if we combine our reference scenario results with the Furlanetto & Loeb (2005) model for the wind enrichment (e.g. see their Fig. 2), the overall picture is that the pollution probability for such halos remains high at all redshifts, probably presenting a minimum (with enrichment probability down to ) between and . This further strengthens our conclusion that Population III star formation in halos with is expected to be subdominant compared to formation in minihalos if primordial stars are formed in isolation. This conclusion becomes stronger as the LW feedback efficiency is decreased or set to zero (see figs. 2 and 3 ).
A different possibility for star formation in massive metal free halos is the creation of a quasi-star, that is a black hole formed via direct collapse accreting inside a massive envelope (Begelman et al., 2008). This scenario has been proposed to explain the rapid growth of supermassive black holes, but a critical requirement for its viability is the absence of metals in the gas (Omukai et al., 2008). Our results on chemical enrichment suggests that quasi-stars are likely to be formed only in a redshift window between and . At the lower end of this redshift window quasistars might only live in regions that lack primordial galaxies and thus have a relative suppression of structure formation compared to the average over the whole Universe. The environment where the progenitors of bright high redshift quasars live is unlikely to qualify as one of such regions. If we assume that a bright, rare, QSO is located at the center of a dark matter halo of mass (Springel et al., 2005), then we derive that its first progenitor with has been formed at with a confidence level greater than . Such progenitor halo has a probability of being metal enriched greater than , so it only has a small chance to host a quasi-star. Note however that quasistars can still lead to the formation of a bright QSO if they are first formed in a relatively void region at and then merge by into the gas rich environment of the main QSO progenitor halo. This scenario allows the black hole seed from the quasistar to grow with maximal efficiency. In fact, the BH starts with a large mass from the initial direct collapse and then it enters a gas rich region where it can grow continuously at near Eddington limit. As a bright QSO halo consists of material originating in a sphere with comoving radius larger than , this is not unlikely. In fact a wind traveling at speeds of only covers a fraction of this distance in half a billion years. However a detailed modeling can be obtained only through the study of QSO merger trees that include information on the spatial distribution of the progenitors, such as those given by cosmological simulations.
5 Population III stars and the Reionization of the Universe
The role of Population III stars in the reionization of the Universe has been much debated in the last years, especially after the first year WMAP data release, which included a high optical depth to reionization (Spergel et al., 2003). Several models had been proposed (Venkatesan et al., 2003; Cen, 2003; Wyithe & Loeb, 2003; Hui & Haiman, 2003; Stiavelli et al., 2004) and many of these included a significant contribution from first stars to . With the latest WMAP data release, the optical depth to reionization is rather low ( implying an instantaneous reionization redshift ; see Komatsu et al. 2008) and its major contribution comes from complete ionization after (Shull & Venkatesan, 2008). The contribution from higher redshift is limited to , providing an upper limit to the luminosity of primordial galaxies (Shull & Venkatesan, 2008).
From our study it appears that the contribution of Population III stars to the total budget of reionizing photons is limited if only one star per halo is formed, even neglecting negative radiative feedback. Despite the fact that first stars are more than one order of magnitude more efficient at producing ionizing photons per unit mass than Population II stars (Tumlinson & Shull, 2000; Schaerer, 2003) their overall star formation rate in our standard model is significantly lower for . Based on our standard model and assuming a Population III formation rate of from to , we obtain that about ionizing photons are emitted by metal free stars. This falls short of the number density of hydrogen atoms . Thus after taking into account the effect of clumpiness of the IGM and of recombination, it is clear that Population III stars can only reionize a minor fraction of the hydrogen atoms, even if the escape fraction is near unity. A large escape fraction is in fact possible in minihalos (), but is likely significantly smaller in larger halos (), where the H II region may remain confined well within the virial radius of the host halo (see Whalen et al., 2004; Kitayama et al., 2004). The number of ionizing photons produced is smaller than the number of hydrogen atoms even in our model with no negative feedback (see Fig. 3). In order for Population III stars to be a significant agent of reionization multiple PopIII stars must be formed in a single halo. For our model with , we obtain a cumulative ionizing photon production of down to . Such number of photons starts to become sufficient to contribute to reionization even for a relatively low escape fraction (). Certainly Population III stars are major agents of reionization if their star formation efficiency goes up one order of magnitude to (see Fig. 7). Note that in both these scenarios with multiple metal free stars per halo, the main sources of reionization are primordial galaxies in halos with . In fact, the reionizing photon budget from Population III remains significant even when only one star per minihalo is formed, but clusters of metal free stars are allowed in larger halos (see Fig. 8; see also Haiman & Bryan 2006).
6 Conclusions
In this paper we present a model for the star formation rate of metal free (Population III) and second generation (Population II) stars during the Dark Ages of the Universe, at . The model relies on dark matter halo mass function coupled with analytical prescription for cooling and collapse of gas clouds. Our model includes radiative Lyman Werner feedback, which can suppress star formation in minihalos, and self-enrichment feedback, which marks the transition from metal free to Population II stars.
Thanks to our novel treatment of chemical enrichment, based on the formalism developed in Trenti & Stiavelli (2007), we show that halos with a virial temperature are most likely to host a second generation of stars, formed from gas enriched to a metallicity by a progenitor Population III star in a minihalo at a higher redshift. Metal free stars can form in halos with only once the cooling of gas in minihalos is strongly suppressed by radiative Lyman Werner feedback, which in our reference model happens at . If only one Population III star forms per dark matter halo, then their number is dominated by those formed in minihalos with a peak star formation rate of at . This prediction is robust and does not depend on the detail of the model. In fact, the negative radiative Lyman Werner feedback acts as a self-regulator of star formation in minihalos keeping variations of the star formation rate limited when the feedback efficiency or the halo mass function is changed.
The metal enrichment also leads to an early rise of the star formation rate of Population II stars. By redshift their SFR is higher than that of Population III stars and steadily rises as the redshift decreases. In our model we do not include positive radiative feedback that can promote formation in the neighborhood of a first star (Ricotti et al., 2001). If this is the case, then the transition to metal enriched stars in halos with is expected to be even more solid, because multiple Population III stars in clustered minihalos can pollute to a higher metallicity the gas that later constitutes a halo. The metal enrichment probability from minihalo pollution decreases once a strong LW background is in place, so at redshift halos containing pristine gas with a mass are possible, provided that winds from protogalaxies, absent in our model, are not too efficient in polluting the IGM. Redshift might thus be the most favorable period for the formation of quasi-stars (Begelman et al., 2008), which are however expected to reside preferentially in underdense environments, where winds are more unlikely to be present and pollute the IGM.
For this standard scenario the contribution to reionization given by Population III stars is only indirect (they enrich the IGM and allow Population II to form). In fact the cumulative number of ionizing photons they produce falls shorter of the number of hydrogen atoms. Metal-enriched stars in the first galaxies are thus expected to be the main agents of reionization, even though the rapid decrease of the galaxy luminosity function at (Bouwens & Illingworth, 2006; Oesch et al., 2008) casts some doubts on this scenario.
A main change in the Population III star formation rate, which increases their contribution to reionization, can be introduced if one releases the assumption that only a single metal free star is formed per halo: by converting a fixed fraction of gas into primordial stars in minihalos the feedback mechanism is less efficient because as the critical gas mass needed for cooling is increases so is the number of stars produced per halo. Therefore in this scenario there is a constant growth of the Population III star formation rate in minihalos until this formation channel is suddenly inhibited because the minimum mass required to self-shield molecular hydrogen in the halo corresponds to a virial temperature above K (see fig. 6). Under this scenario Population III stars can easily produce a significant amount of ionizing photons and could account for a significant fraction of the optical depth to reionization originating from . One issue to be addressed if multiple Population III stars are formed in a single halo is however the impact of local radiative feedback. The first massive star formed in a minihalo emits enough energy to completely photo-dissociate the gas in the halo, thus multiple stars can be formed only if there is a single star formation burst of limited time duration and very high efficiency. This is a crucial issue that can be properly addressed only once cosmological simulations of Population III star formation will be able to go past the formation of the first protostellar core and follow multiple episodes of star formation (see Wise & Abel 2008 for promising progress in this direction).
References
- Abel et al. (2002) Abel, T., Bryan, G. L. and Norman, M. L. 2002, Science, 295, 93
- Bardeen et al. (1986) Bardeen, J. M., Bond, J. R., Kaiser, N. and Szalay, A. S. 1986, ApJ, 304, 15
- Begelman et al. (2006) Begelman, M. C., Volonteri, M. and Rees, M. J. 2006, MNRAS, 370, 289
- Begelman et al. (2008) Begelman, M. C., Rossi, E. M. and Armitage, P.J. 2008, MNRAS, 387, 1649
- Barkana & Loeb (2004) Barkana, R. & Loeb A. 2004, ApJ, 609, 474
- Bouwens & Illingworth (2006) Bouwens, R. J. and Illingworth, G. D. 2006, Nature, 443, 189
- Bromm et al. (2001) Bromm, V., Ferrara, A., Coppi, P. S. and Larson, R. B. 2001, MNRAS, 328, 969
- Bromm et al. (2003) Bromm, V., Yoshida, N and Hernquist, L. 2003, ApJ, 596, 135
- Bromm & Larson (2004) Bromm, V. and Larson, R. B. 2004, ARA&A, 42, 79
- Cen (2003) Cen, R. 2003, ApJ591, 5
- Ciardi et al. (2000) Ciardi, B., Ferrara, A. and Abel, T. 2000, ApJ, 533, 594
- Clark et al. (2008) Clark, P. C. and Glover, S. C. O. and Klessen, R. S. 2008, ApJ, 672, 757
- Couchman & Rees (1986) Couchman, H. M. P. and Rees, M. J. 1986, ApJ, 221, 53
- Eisenstein & Hu (1999) Eisenstein, D. J. and Hu, W. 1999, ApJ, 511, 5
- Furlanetto & Loeb (2003) Furlanetto, S. R. and Loeb, A. 2003, ApJ, 588, 18
- Furlanetto & Loeb (2005) Furlanetto, S. R. and Loeb, A. 2005, ApJ, 634, 1
- Gao et al. (2005) Gao, L., White, S. D. M., Jenkins, A., Frenk, C. S. and Springel, V. 2005, MNRAS, 363, 379
- Gao et al. (2007) Gao, L. and Yoshida, N. and Abel, T. and Frenk, C. S. and Jenkins, A. and Springel, V 2007, MNRAS, 378, 449
- Galli & Palla (1998) Galli, D. and Palla, F. 1998, A&A, 335, 403
- Glover & Brand (2001) Glover, S. C.O. and Brand, P. W. J. L. 20 01, MNRAS, 321, 385
- Greif & Bromm (2006) Greif, T. H. and Bromm, V. 2006, MNRAS, 37 3, 128
- Greif et al. (2007) Greif, T. H., Johnson, J. L., Bromm, V. and Klessen, R. S. 2007, ApJ, 670, 1
- Haiman et al. (1997) Haiman, Z., Abel, T. and Rees, M. J. 1997, ApJ, 476, 458
- Haiman et al. (2000) Haiman, Z., Abel, T. and Rees, M. J. 2000, ApJ, 534, 11
- Haiman & Bryan (2006) Haiman, Z. and Bryan, G. L. 2006, ApJ, 650, 7
- Heger et al. (2003) Heger, A., Fryer, C. L., Woosley, S. E., Langer, N., and Hartmann, D. H. 2003, ApJ, 591, 288
- Heitmann et al. (2006) Heitmann, K., Lukić, Z., Habib, S. and Ricker, P. M. 2006, ApJ, 642, 85
- Hui & Haiman (2003) Hui L. and Haiman, Z. 2003, 596, 9
- Kitayama et al. (2004) Kitayama, T., Yoshida, N., Susa, H. and Umemura, M. 2004, ApJ, 613, 631
- Yoshida et al. (2006) Yoshida, N., Omukai, K., Hernquist, L. and Abel, T., 2006, ApJ, 652, 6
- Yoshida et al. (2007) Yoshida, N., Omukai, K. and Hernquist, L. 2007, ApJ, 667, 117
- Kitayama & Yoshida (2005) Kitayama, T. and Yoshida, N. 2005, ApJ, 630, 675
- Komatsu et al. (2008) Komatsu et al. 2008, ApJS, submitted (arxiv:0803.0547)
- Lacey & Cole (1993) Lacey, C. and Cole, S. 1993, MNRAS, 262, 627
- Lepp & Shull (1984) Lepp, S. and Shull, J. M. 1984, ApJ, 280, 465
- Lepp & Shull (1983) Lepp, S. and Shull, J. M. 1983, ApJ, 270, 578
- Lynden-Bell (1967) Lynden-Bell, D. 1967, MNRAS, 136, 101
- Lukić et al. (2007) Lukić, Z. and Heitmann, K. and Habib, S. and Bashinsky, S. and Ricker, P. M. 2007, ApJ, 671, 1160
- Machacek et al. (2001) Machacek, M. E., Bryan, G. L. and Abel, T. 2001, ApJ, 548, 509
- Machacek et al. (2003) Machacek, M. E., Bryan, G. L. and Abel, T. 2003, MNRAS, 338, 273
- Mackey et al. (2003) Mackey J. and Bromm, V. and Hernquist, L. 2003, ApJ, 586, 1
- Naoz et al. (2006) Naoz, S., Noter, S. and Barkana, R. 2006, MNRAS, 373, 98
- Oesch et al. (2008) Oesch, P.A. et al. 2008, ApJ, in press (arXiv0804.4874)
- Omukai & Yoshii (2003) Omukai, K. and Yoshii, Y. 2003, ApJ, 599, 7460
- Omukai et al. (2008) Omukai, K., Schneider, R. and Haiman, Z. ApJ, in press (arXiv:0804.3141)
- O’Shea & Norman (2007) O’Shea, B. W. and Norman, M. L. 2007, ApJ, 654, 260
- O’Shea & Norman (2008) O’Shea, B. W. and Norman, M. L. 2008, ApJ, 673, 14
- Ostriker & Gnedin (1996) Ostriker, J. P. and Gnedin, N. Y. 1996, ApJ, 472, 630
- Peebles (1993) Peebles, P. J.E. 1993, ”Principles of physical cosmology”, Princeton Series in Physics, Princeton, NJ: Princeton University Press
- Peimbert et al. (2006) Peimbert, M., Luridiana, V. and Peimbert, A. 2006, ApJ, 666, 2
- Press & Schechter (1974) Press, W. H. and Schechter, P. 1974, ApJ, 187, 425
- Reed et al. (2006) Reed, D. S., Bower, R., Frenk, C. S., Jenkins, A. and Theuns, T. 2007, MNRAS, 374, 2
- Ricotti et al. (2001) Ricotti, M. and Gnedin, N. Y. and Shull, M. J. 2001, ApJ, 560, 591
- Salpeter (1955) Salpeter, E. E. 1955, ApJ, 121, 161
- Schaerer (2002) Schaerer, D. 2002, A&A, 382, 28
- Santos et al. (2002) Santos, M. R., Bromm V. and Kamionkowski M. 2002, MNRAS, 336, 1082
- Schaerer (2003) Schaerer, D. 2003, A&A, 397, 527
- Sheth & Tormen (1999) Sheth, R. K. and Tormen G. 1999, MNRAS, 308, 119
- Schneider et al. (2006) Schneider, R., Omukai, K., Inoue, A. K. and Ferrara, A. 2006, MNRAS, 369, 1437
- Shull & Venkatesan (2008) Shull, J. M. and Venkatesan, A. 2008, ApJ, in press (arxiv:0806:0392)
- Smith et al. (2008) Smith, B. D. et al., 2008, arXiv:0806.1653
- Spergel et al. (2003) Spergel, D. N. 2003, ApJS, 148, 175
- Springel et al. (2005) Springel, V. et al. 2005, Nature, 435, 629
- Stiavelli et al. (2004) Stiavelli, M., Fall, M. and Panagia, N. 2004, ApJ, 600, 508
- Tegmark et al. (1997) Tegmark, M., Silk, J., Rees, M. J., Blanchard, A., Abel, T. and Palla, F. 1997, ApJ, 474, 1
- Trenti & Stiavelli (2007) Trenti M. and Stiavelli, M. 2007, ApJ, 667, 38
- Trenti et al. (2008) Trenti M., Santos, M. R. and Stiavelli, M. 2008, ApJ, 687, 1
- Tumlinson & Shull (2000) Tumlinson, J. and Shull, J. M. 2000, ApJ, 528, 65
- Tumlinson (2006) Tumlinson, J. 2006, ApJ, 641, 1
- Tumlinson (2007) Tumlinson, J. 2006, ApJ, 664, 63
- Venkatesan et al. (2003) Venkatesan, A., Tumlinson, J. and Shull J. M. 2003, ApJ, 584, 621
- Warren et al. (2006) Warren, M. S. and Abazajian, K. and Holz, D. E. and Teodoro, L. 2006, ApJ, 646, 881
- Whalen et al. (2004) Whalen, D., Abel, T. and Norman, M. L. 2004, ApJ, 610, 14
- Whalen et al. (2008) Whalen, D., van Veelen, B., O’Shea, B. W. and Norman, M. L. 2008, 682, 49
- Wise & Abel (2007) Wise, J H. and Abel, T. 2007, ApJ, 671, 1559
- Wise & Abel (2008) Wise, J H. and Abel, T. 2008, ApJ, in press (arxiv:0710.3160)
- Wyithe & Chen (2006) Wyithe, J. S. B. and Chen, R. 2006, ApJ, 659, 907
- Wyithe & Loeb (2003) Wyithe, J. S. B. and Loeb, A. 2003, ApJ, 586, 693
- Yoshida et al. (2008) Yoshida, N., Omukai, K., Hernquist, L., Science, 321, 669


| Model | Halo MF | |||
| Standard | ST99 | 1/halo | ||
| LowEscape | ST99 | 1/halo | ||
| NoEscape | ST99 | 1/halo | ||
| Ext_J21 | ST99 | 1/halo | ||
| PS | PS76 | 1/halo | ||
| MultiPopIII | ST99 | |||
| MultiPopIII_high_eff | ST99 | |||
| MultiPopIII_Ly- | ST99 | : 1/halo; : |