44email: angm@aip.de
Post common envelope binaries from SDSS. IV: SDSSJ121258.25–012310.1, a new eclipsing system††thanks: This paper includes data gathered with the 6.5 meter Magellan Telescopes located at Las Campanas Observatory, Chile.
From optical photometry we show that SDSSJ121258.25–012310.1 is a new eclipsing, post common–envelope binary with an orbital period of hours and an eclipse length of minutes. We observed the object over 11 nights in different bands and determined the ephemeris of the eclipse to HJDmid = , where numbers in parenthesis indicate the uncertainties in the last digit. The depth of the eclipse is mag in the band, mag in the band and mag in the band. From spectroscopic observations we measured the semi-amplitude of the radial velocity km/s for the secondary star. The stellar and binary parameters of the system were constrained from a) fitting the SDSS composite spectrum of the binary, b) using a -band luminosty-mass relation for the secondary star, and c) from detailed analyses of the eclipse light curve. The white dwarf has an effective temperature of K, and its surface gravity is . We estimate that the spectral type of the red dwarf is and the distance to the system is parsec. The mass of the secondary star is estimated to be in the range M⊙ , while the mass of the white dwarf is most likely M⊙. From an empirical mass-radius relation we estimate the radius of the red dwarf to be in the range R⊙ , whereas we get R⊙ from a theoretical mass-radius realation. Finally we discuss the spectral energy distribution and the likely evolutionary state of SDSS1212–0123.
Key Words.:
binaries: SDSS1212–0123– close – eclipsing – novae, cataclysmic variables1 Introduction
Most stars are found in binary or multiple star systems and a large fraction of binaries will interact at some point in their lives. Interaction depends on initial separation, relative masses of the components, and their evolutionary state. When the initial orbital period is less than days, interaction will take place while both stars are on the main sequence, giving rise to contact binaries and eventualy mergers. For wider orbits, interaction can happen only when the more massive star reaches the RGB or the AGB. If the mass transfer rate is high enough a gaseous envelope may surround the binary, entering thus a common envelope (CE) phase. The stars spiral towards each other, friction within the CE will lead to a shrinkage of the binary separation, and angular momentum and energy are extracted from the orbit, expelling the CE. Once the envelope is expelled, the remaining system consists of a main sequence star and a remnant of the more massive star, e.g. a white dwarf, perhaps surrounded by the ejected material that can be ionized forming a planetary nebula (Paczyński, 1976; Iben & Livio, 1993). Further evolution of the system is driven by angular momentum loss due to magnetic braking and/or gravitational radiation, which will bring the system into a semidetached configuration, becoming a cataclismic variable (CV). Post common envelope binaries (PCEBs) are thought to be precursors of other interesting objects such as CVs, millisecond pulsars, low-mass X-ray binaries or double degenerate white dwarfs.
Though theories for the CE phase exist it is still poorly understood. The efficiency of mass ejection in the CE with respect to the masses of the components, their evolutionary state and the orbital separation is uncertain (Politano & Weiler, 2007; Taam & Ricker, 2006). White dwarf plus main sequence (WDMS) binaries are a perfect test laboratory for studying the current population synthesis models because they are numerous, their stellar components are well understood in terms of their single evolution and they are not accreting, which would increase the complexity. The number of PCEBs with well-defined parameters is still small, although it has increased since Schreiber & Gänsicke (2003) from 30 to almost 50 systems (Gänsicke et al., 2004; Morales-Rueda et al., 2005; Shimansky et al., 2006; van den Besselaar et al., 2007; Aungwerojwit et al., 2007; Tappert et al., 2007; Schreiber et al., 2008; Rebassa-Mansergas et al., 2008; Steinfadt et al., 2008).
In this paper we report the discovery of a new eclipsing PCEB. In our ongoing search for PCEBs among white-dwarf/main-sequence binaries (Schreiber et al., 2008; Rebassa-Mansergas et al., 2007, 2008), SDSSJ121258.25–012310.1 (Adelman-McCarthy et al., 2008) (henceforth SDSS1212–0123) was included in our target list for photometric monitoring of candidate objects. The serendipituous discovery of a binary eclipse from time-resolved differential photometry triggered a photometric and spectroscopic follow-up. Only seven eclipsing binaries containing a white dwarf and a low mass main sequence star were known until 2007. Since then another three eclipsing systems have been published (Steinfadt et al., 2008; Drake et al., 2008), and a further three systems have been discovered by us (Pyrzas et al., 2008). Eclipsing binaries are of great interest since they offer the possibility of deriving fundamental properties of stars with a high accuracy. SDSS1212–0123 was firstly listed as a quasar candidate by Richards et al. (2004) and later classified as a by Silvestri et al. (2006). It contains a relatively hot white dwarf (from now on primary) and an active mid-type dM star (from now on secondary).
2 Observations and reductions
2.1 IAC80 and AIP70 photometry
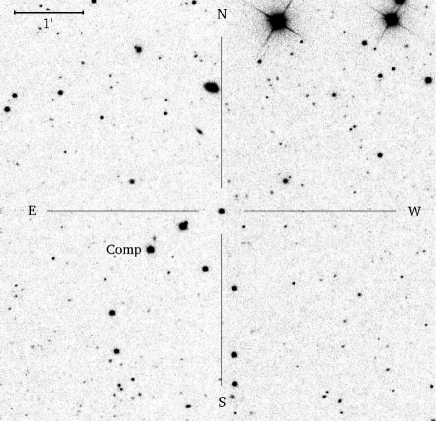
Optical photometric observations were obtained using two different telescopes over 11 nights. The 80 cm telescope IAC80 in Observatorio del Teide, Spain, was equipped with the standard CCD camera and the 70 cm telescope of the Astrophysical Institute Potsdam at Babelsberg was used with a cryogenically cooled 1x1 k TEK-CCD. A log of observations is presented in Table 1. A field of arc minutes was read with the IAC80 CCD camera, and we used a binning factor of 2 in both spatial directions (scale of 0.6”), while we used a binning factor of 3 for the 70 cm telescope (scale of 1.41”), in order to decrease the readout time and improve the signal to noise. Reduction was performed using standard packages in IRAF111IRAF is distributed by the National Optical Astronomy Observatory, which is operated by the Association of Universities for Research in Astronomy, Inc., under contract with the National Science Foundation, http://iraf.noao.edu and MIDAS. Differential magnitudes were obtained with respect to the comparison star SDSS J121302.39–012343.5 (see Fig.1), with magnitudes ugriz=. SDSS magnitudes were transformed into Johnson’s using equations taken from the Sloan pages222http://www.sdss.org/dr7/algorithms/sdssUBVRITransform.html. Neglecting the color term, we calculated absolute magnitudes of SDSS1212–0123. The estimated error of the absolute calibration is mag.
| 04 Jan 2007 | IAC80 | 180 | 74 | 0.805 | 1.278 | |
| 26 Jan 2007 | AIP70 | 180 | 19 | 0.041 | 0.156 | |
| 13 Feb 2007 | IAC80 | 70 | 191 | 0.607 | 1.202 | |
| 14 Feb 2007 | IAC80 | 70 | 221 | 0.525 | 1.292 | |
| 12 Mar 2007 | AIP70 | 120 | 181 | 0.031 | 0.946 | |
| 13 Mar 2007 | AIP70 | 120 | 153 | 0.377 | 1.343 | |
| 14 Mar 2007 | AIP70 | 120 | 49 | 0.786 | 1.040 | |
| 15 Mar 2007 | AIP70 | 120 | 73 | 0.683 | 1.023 | |
| 26 Mar 2007 | AIP70 | 120 | 45 | 0.994 | 1.179 | |
| 21 May 2007 | AIP70 | 90 | 59 | 0.907 | 1.097 | |
| 06 May 2008 | IAC80 | 120 | 32 | 0.913 | 1.049 |
2.2 Spectroscopy
Spectroscopic follow up observations were obtained during the period 16-19 May 2007 with the LDSS3 imaging spectrophotograph at the Magellan Clay telescope. Ten spectra were taken for SDSS1212–0123. Exposure times varied from 300 to 600 seconds. Seeing and transparency were highly variable. The VPH_Red grism and an OG590 blocking filter were used. The detector was a STA 4k4k pixel CCD with two read out amplifiers. We used a slit width of 0.75 arcsec, that together with the spectral resolution , gave a coverage of Å at a reciprocal dispersion of Åpix-1. Four of the spectra taken at quadrature were obtained through a narrow slit of arcsec resulting in a FWHM spectral resolution of Å, with the purpose of measuring the radial velocity amplitude with a higher accuracy. Flat-field images were taken at the position of the target to allow effective fringe removal in the red part of the spectra. The spectral images were reduced using STARLINK packages FIGARO and KAPPA, and the spectra were optimally extracted (Horne, 1986) using the PAMELA package (Marsh, 1989). Wavelength calibration was done using sky lines. Wavelengths of good sky lines were obtained from the atlas of Osterbrock et al. (1996, 1997). A fifth-order polynomial was fitted to sky lines. Spectra were flux calibrated and corrected for telluric lines using spectra of the standard star LTT3218 taken during the same observing run.
3 Results
3.1 The light curve
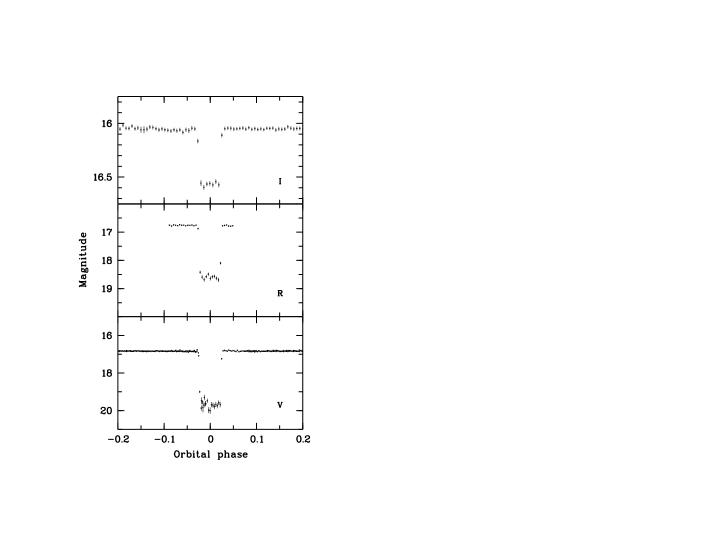
The optical light curve of SDSS1212–0123 displays a total eclipse of the primary with length of approximately minutes. The depth of the eclipse is mag in the band, mag in the band and mag in the band (see Fig. 2). Eclipse magnitudes are , and . The much deeper eclipse in the band is due to the fact that the primary emits most of the light in the blue, while the secondary dominates in the band. Photometric variability outside of the eclipse, e.g. from an irradiated secondary or from ellipsoidal modulation of the secondary, was found to be less than .
At the given time resolution of our photometry, the WD ingress and egress phases are not resolved. Five eclipses were completely covered and the eclipse length was determined in these light curves measuring their full width at half maximum of the flux level. The weighted mean of those five measurements gives an eclipse length of min.
3.2 Ephemeris
In addition to the five eclipses which were covered completely one further eclipse was covered partially. Using the measured eclipse length from the previous section we thus determined six eclipse epochs (Table 2). The eclipses of March 12, 14 and 26, respectively, were not covered due to bad weather conditions. Using a phase-dispersion minimization technique a tentative period was determined, hours, which was sufficiently accurate to connect all follow-up observations without a cycle count alias.
We then used the six mid eclipse epochs to calculate a linear ephemeris by fitting a line to the cycle number and eclipse epoch:
| (1) |
where numbers in parenthesis indicate the uncertainty in the last digits. The observed minus calculated values are tabulated in Table 2.
| (Mid-eclipse) | (s) | ||
|---|---|---|---|
| 04 Jan 2007c | 2454104.7085(21) | 0 | -9.9 |
| 13 Feb 2007c | 2454145.6847(8) | 122 | -11.0 |
| 14 Feb 2007p | 2454146.6922(8) | 125 | -19.0 |
| 13 Mar 2007c | 2454173.5621(10) | 205 | -0.3 |
| 21 May 2007c | 2454242.4163(21) | 410 | 66.9 |
| 06 May 2008c | 2454593.4000(14) | 1455 | -25.9 |
c Eclipse completely covered.
p Eclipse partially covered.
3.3 Stellar parameters
3.3.1 Decomposition of the SDSS spectrum
We determined the stellar parameters of SDSS1212–0123 from the SDSS spectrum following the procedure described in Rebassa-Mansergas et al. (2007).
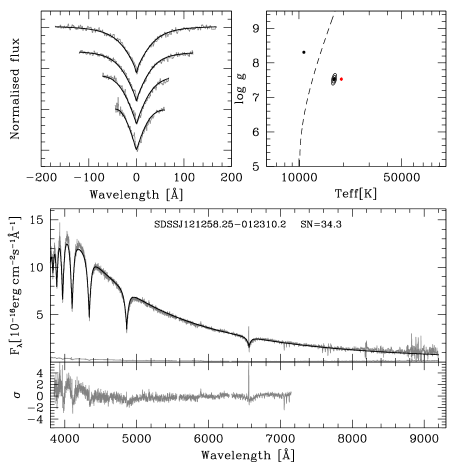
In a first step the best match of the SDSS composite spectrum is determined with an optimization strategy on a grid of observed white dwarf and M-dwarf template spectra created from the SDSS DR6 database. The main result of this first step is the determination of the spectral type of the secondary. Using the spectral type-radius relation from Rebassa-Mansergas et al. (2007) and the apparent magnitude of the scaled template results in a first distance estimate . After subtracting the best-fitting M-star template, white-dwarf parameters are determined via minimization in a – grid of model atmospheres (Koester et al., 2005). Since this analysis step is performed on spectra normalized to a continuum intensity, the results are bi-valued yielding a ‘hot’ and a ‘cold’ solution (see Fig. 4). The degeneracy can typically be broken by an additional fit to the overall spectrum (continuum plus lines in the wavelength range – Å). In the present case of SDSS1212–0123 the GALEX detection (see below) provides an additional constraint excluding the ‘cold’ solution. The results of the spectral decomposition and the white dwarf fit for SDSS1212–0123 are shown in Fig. 4.
Mass and radius of the white dwarf are calculated with the best-fitting – combination using updated versions of the tables by Bergeron et al. (1995). The flux scaling factor together with the derived radius of the white dwarf results in a second distance estimate of the binary, .
The spectral type of the secondary was determined to be implying a distance pc, mass range of the secondary – M⊙ and radius range – R⊙, using Rebassa-Mansergas et al. (2007) spectral type-mass and spectral type-radius empirical relations respectively. The derived temperature and of the primary were found to be only weakly dependent on the chosen spectral type and spectral template of the secondary, because we use H – H for the white dwarf line fit, where the secondary star contribution is small. It is also weakly dependendt on the accuracy of the spectral flux calibration and also the small radial velocity line displacements. The best fit was found for K and (implying a white dwarf mass M⊙, and R⊙). The obtained values are in agreement with those published by Silvestri et al. (2006). However, one should be aware of the fact that all the quoted errors are purely statistical. The true uncertainty of the white dwarf spectral parameters is clearly higher than suggested by the derived numbers. We estimate the systematic uncertainty of our determination to be on the order of dex, which results in rather wide ranges of possible values for the mass and the radius of the primary, i.e. – M⊙ and – R⊙.
The derived distance to the white dwarf is pc (assuming the statistical error only). The two distance estimates differ, being longer than , but in agreement within the erros. Rebassa-Mansergas et al. (2007) found a similar trend for WDMS binaries in their study. They argue that such difference could be due to stellar activity of the secondary star, and that the spectral type determined from the optical SDSS spectrum is too early for the mass of the secondary star, which would lead to a larger radius and consequently a larger distance to the system. Since the secondary in SDSS1212–0123 was found to be active too, we regard the distance estimate for the white dwarf being more reliable. Taking into account systematic errors we obtain pc as the distance to the system.
3.3.2 Constraining the secondary mass using 2MASS
In the previous section we derived the mass and the radius of the secondary star using empirical relations from Rebassa-Mansergas et al. (2007) and obtained M⊙ and R⊙, respectively. However, as clearly shown in Fig. 7 of Rebassa-Mansergas et al. (2007), the masses and radii derived from observations largely scatter around the empirical relations. In addition, according to Rebassa-Mansergas et al. (2007) increased activity of the rapidly rotating secondary stars in close binaries can cause the stars to appear as earlier spectral types when compared to non-active stars of the same mass. To sum up, the secondary masses derived from empirical relations can obviously only considered to reasonable but rough estimates.
An alternative method to determine the mass of secondary star is to use luminosity-spectral type relations. To that end, we explored the Two Micron All Sky Survey Point Source Catalog (Cutri et al., 2003), finding magnitudes , and for SDSS1212–0123. Subtracting the extrapolated contribution of the primary star ( and pc) yields infra-red colors of , respectively. Using the empirical mass-luminosity relation from Delfosse et al. (2000), we derive the mass of the secondary star to be . Using again the mass-radius relation from Rebassa-Mansergas et al. (2007) this implies a spectral type , i.e. later by one stectral type than estimated from the deconvolution of the SDSS spectrum. This supports the idea of activity significantly affecting the determination the secondary star spectral types and the corresponding distances.
3.3.3 Radial velocity
In each of our observed spectra we measured the radial velocities of the NaI absorption doublet (Å, Å), which originates from the secondary star. A double Gaussian with a fixed separation of Å was fitted to the line profiles using the FIT/TABLE command provided by ESO/MIDAS.
H was deconvolved into an absorption and an emission line component using two Gaussians. While the emission line showed pronounced wavelength shifts, the centroids of the absorption lines thus measured did not constrain the curve of the white dwarf significantly.
Assuming a circular orbit a sine-function was fitted to the measured radial velocity curves to obtain the radial velocity semi-amplitude of the secondary star:
| (2) |
The orbital period and the epoch of mid eclipse were determined photometrically and were kept fixed for the radial velocity fit. For the NaI doublet we find the systemic velocity km s-1 and km s-1, while we find for the H line km s-1and km s-1. The fit to the NaI lines is shown if Fig. 5 together with the residuals.
The semi-amplitudes of the two radial velocity curves are different and these differences seem to be significant. The semi-amplitude derived from H is lower, indicating that its emission is displaced towards the inner hemisphere of the secondary star with respect to the NaI doublet. As neither of the two line features shows significant photometric variability, which would indicate a biased origin of one of the line species (e.g. towards the non-irradiated side of the secondary), we exclude irradiation as the explanation for the observed difference in . A detailed comparison of radial velocities derived from the NaI doublet and H lines has been performed by Rebassa-Mansergas et al. (2007). They find that both velocities often significantly differ but that there seems to be no systematic shift of H radial velocities towards smaller values. As discussed in detail in Rebassa-Mansergas et al. (2008), this is probably explained by the H emission being related to activity and not uniformely distributed over the surface of the secondary. Kafka et al. (2005) studied in detail the origin of different line species, however SDSS1212–01231212 shows no evidence of accretion nor irradiation. We therefore assume that in SDSS1212–0123 the NaI doublet much better traces the center of mass of the secondary and we use its semi-amplitude for the mass estimate.

We write the mass function of the binary assuming a circular orbit in the form
| (3) |
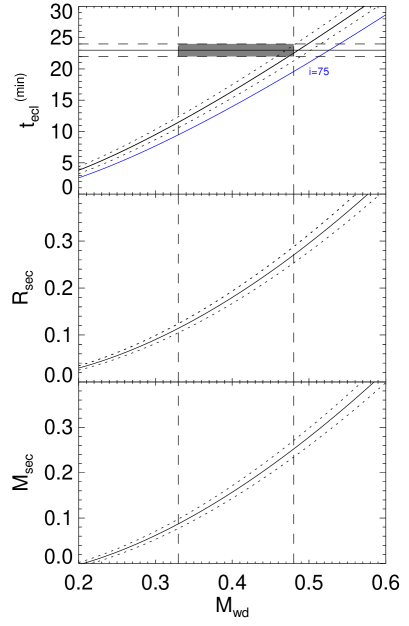
and derive an upper limit for for a given white-dwarf mass assuming (see bottom panel of Fig. 6).
Using the empirical mass-radius relation for main sequence stars derived by Bayless & Orosz (2006) we estimate the radius of the secondary (middle panel of Fig. 6). The top panel of the same figure illustrates the maximum possible eclipse length (, black line) for the given stellar radius, the orbital period and the orbital separation according to
| (4) |
The measured values of the eclipse length and the range of the white-dwarf mass from Sec. 3.3.1 are shown in the figure with horizontal and vertical lines, respectively, their intersection is shaded in grey in the top panel. It is also plotted the solution for for comparison. From the eclipse length the range of possible values for the mass of the WD is , and for the dM M⊙, and R⊙.
3.3.4 Light curve modeling
A determination of most of the physical parameters of an eclipsing system can be achieved by fitting model light curves to the actual data. We made use of a newly developed light curve fitting code, written by T.R. Marsh, for the general case of binaries containing a white dwarf.
The code is described in detail in Pyrzas et al. (2008). Briefly, a model light curve is computed based on user-supplied initial system parameters. These are the two radii, scaled by the binary separation, and , the orbital inclination, , the unirradiated stellar temperatures of the white dwarf and the secondary star and respectively, the mass ratio and the time of mid-eclipse of the white dwarf.
Starting from this parameter set, the model light curve is then fitted to the data using Levenberg-Marquardt minimisation. Every parameter can either be allowed to vary or remain fixed, during the fitting process.
Our approach for modeling the band photometry of SDSS1212–0123 was the following. A large and dense grid of points in the plane was first calculated, generously bracketing the estimates for the mass of the two components (see Sec. 3.3.3). Each point defines a mass ratio , and through , a binary separation . Furthermore, from the mass function equation (Eq. 3), using the value of (derived in Sec. 3.3.3) and , one can calculate the inclination angle . Points for which (formally) were discarded from the grid, for all other points the corresponding light curve model was computed, leading to the computation of some 9000 models.
As an initial estimate for the radii of the binary components, we adopted values from the theoretical M – R relations of Bergeron et al (1995) for the white dwarf, and Baraffe et al. (1998) - the Gyr model - for the secondary. Regarding the two temperatures, and , the value from our spectral decomposition (Sec. 3.3.1) was used for the white dwarf, while the – relation from Rebassa-Mansergas et al. (2007), together with our result for the spectral type of the secondary, were used to obtain an initial value for .
For the fitting process , , and were fixed, leaving only , and free to vary. was fixed mainly because of the poor temporal resolution of our data set, which does not resolve the white dwarf ingress and egress. Consequently, if allowed to vary, the white dwarf radius would only be loosely constrained and it would introduce large uncertainties in the determination of . was also fixed, because allowing both temperatures to vary simultaneously would lead to a degenerate situation, as they are strongly correlated. Our spectral decomposition results are sufficiently accurate, so as to allow us to fix without affecting the fitting result. The parameter on the other hand, was left free during the fitting, to account for the errors in the mid-eclipse times, which in some cases were significant (see Table 2 again).
The results of the light curve fitting process were analyzed as follows. We first applied a cut in the quality of the fits. This was done by selecting the minimum value of all fits and then culling all model fits at above the best fit. Afterwards, we selected from the remaining, equally good light curve fits, those which where physically plausible. We defined a parameter, as , i.e. how much the fitted radius value deviates from the theoretical radius value, obtained from a M-R relation, for a given model. Thus, we selected only those models that had , to allow for an oversized secondary.
The results are illustrated in Figure 7. Black dots designate those light curve fits making the 1 cut, red dots those that satisfy both the 1 and cuts. The resulting ranges in white dwarf masses and secondary star masses (indicated with dashed, vertical, red lines) are M⊙ and M⊙, respectively, corresponding to a white dwarf radius of R⊙ and a secondary radius of R⊙. The range for the inclination angle is . Also indicated, with dotted, horizontal, gray lines are the radii of M-dwarfs with spectral types in steps of 0.5, based on the spectral type-mass relation given by Rebassa-Mansergas et al. (2007).
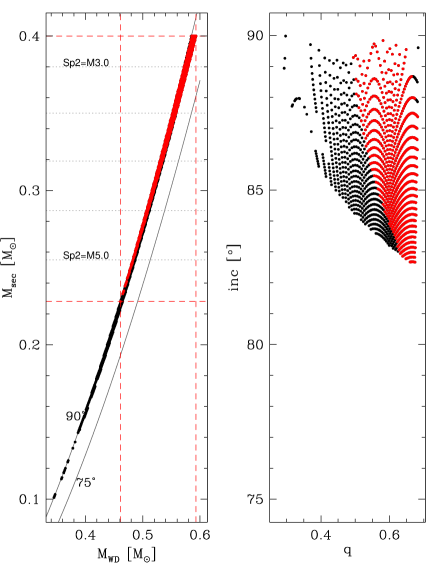
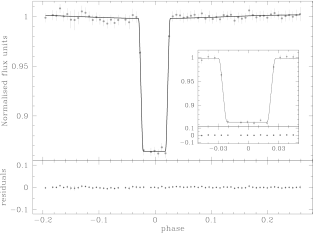
Fig. 8 shows one example of the light curve fits within the components masses range for the model parameters: M⊙, M⊙ and . The detailed models do not predict any variation in the light curve caused by irradiation of the secondary star by the white dwarf. The predicted variations due to ellipsoidal modulation are expected to be quite small, i.e. mag, consistent with our observational non-detection of any variability outside the eclipse.
3.3.5 Spectral energy distribution
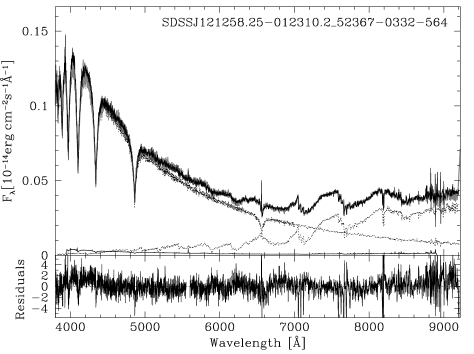
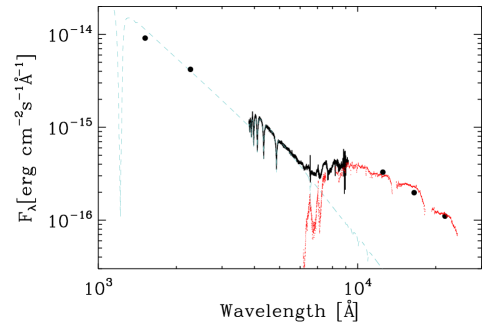
We cross-identified SDSS1212–0123 with the database from the Galaxy Evoluion Explorer (GALEX (Martin et al., 2005; Morrissey et al., 2005)), and found a detection in the far and near ultraviolet (FUV and NUV). The magnitudes are mag and mag, exposure times were 150 sec. FUV and NUV fluxes can provide an estimate of the effective temperature of the white dwarf for a certain , assuming that all the flux in the UV is emitted by the primary. White dwarf models for and and effective temperature in the range K, were folded over the FUV and NUV filters. The calculated flux ratio FUV/NUV was compared with the observed for SDSS1212–0123. The GALEX flux ratio implies K, significantly colder than what we obtain from the optical spectrum in Sec. 3.3.1. However, discrepant temperatures from GALEX UV and optical photometry were noticed earlier from an analysis for a large number of white dwarfs () by Kawka & Vennes (2007). This shows that one cannot expect the same UV and optical temperatures in a case-by-case basis, but at best on a statistical average. For the time being we accept the temperature from our fit to the SDSS spectrum, which grossly reflects the UV to optical SED.
The spectral energy distribution is shown in Fig. 9, including ultraviolet, optical and infrared fluxes from 2MASS. A model spectrum for a white dwarf of pure Hydrogen (Koester et al., 2005) with effective temperature of K and and a spectrum of the M5 star LHS1504 from Legget’s library 333http://ftp.jach.hawaii.edu/ukirt/skl/dM.spectra/ are shown for comparison (Leggett et al., 2000).
3.3.6 Binary parameters summary
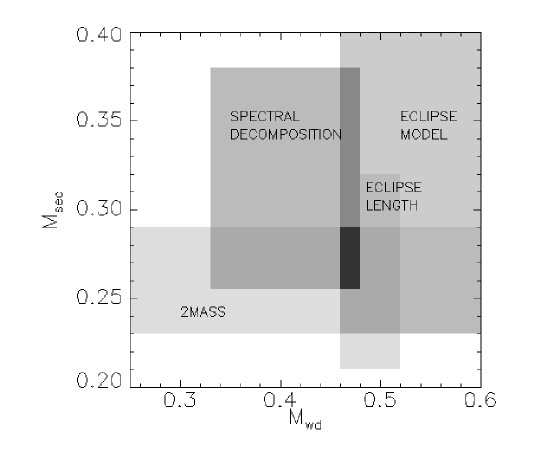
Figure 10 shows the different ranges for the masses of the primary and the secondary from the spectral decomposition fit (Sect. 3.3.1), the -band luminosity-mass relation (Sect. 3.3.2), the radial velocity amplitude and eclipse length (Sect. 3.3.3) and the detailed light curve fitting (Sect. 3.3.4). Of course, the different methods are not entirely independent, e.g. the constraints from the eclipse length/radial velocities studies and the detail light curve fitting basically use the same information with the only difference being that we could derive a clear lower limit from the latter. The dark shaded region in Fig. 10 represents the ranges of stellar masses in agreement with all the derived constraints i.e., M⊙, M⊙, implying a radius of the secondary star in the range R⊙ using the empirical M–R relation from Bayless & Orosz (2006) and R⊙ (. We adopt these values as the most probable ones and all finally accepted stellar and binary parameters based on Sloan-data, other catalogues and our own follow-up observations are collected in Table 3.
| Parameter | Value | Parameter | Value |
|---|---|---|---|
| 12 12 58.25 | (K) | ||
| -01 23 10.1 | (dex) | ||
| (R⊙) | |||
| (R⊙) | |||
| (M⊙) | |||
| (M⊙) | |||
| (days) | |||
| (km s-1) | |||
| (km s-1) | |||
| (R⊙) | |||
| (pc) |
4 Evolutionary state
The post CE evolution of compact binaries is driven by angular momentum loss due to gravitational radiation and – perhaps much stronger – magnetic wind braking. Unfortunately, the latter mechanism is currently far from being well constrained, and predicting and reconstructing the post CE evolution sensitively depends on the assumed prescription for magnetic braking.
However, the disrupted magnetic braking scenario proposed by Rappaport et al. (1983) can still be considered the standard model for magnetic braking in close compact binaries. In this scenario it is assumed that magnetic braking ceases when the secondary star becomes fully convective at M⊙ (which corresponds to hrs). Although observations of the spin down rates of single stars do drastically disagree with the predictions of disrupted magnetic braking (Sills et al., 2000), it remains the only consistent theory explaining the orbital period gap i.e. the observed deficit of CVs in the range of hrs. Moreover, first results of our radial velocity survey of PCEBs seem to support the idea of disrupted magnetic braking (Schreiber et al., 2008). To predict and reconstruct the post CE evolution of SDSS1212–0123 according to Schreiber & Gänsicke (2003), we therefore assume disrupted magnetic braking.
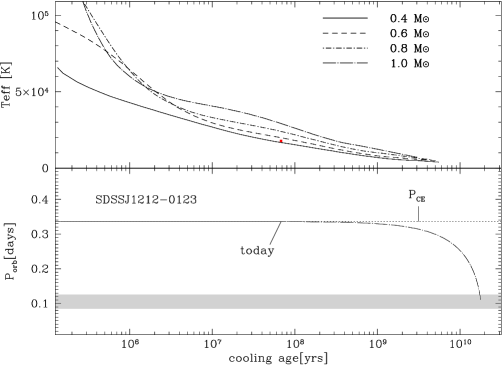
First, we interpolate the cooling tracks of Wood (1995) and estimate the cooling age of SDSS1212–0123 to be yrs (see top panel of Fig. 11). Second, according to the mass derived for the secondary star (M⊙) we assume that, since SDSS1212–0123 left the CE phase, the only mechanism driving the evolution of SDSS1212–0123 towards shorter orbital periods is (and has been) gravitational radiation. As shown in Fig. 11 (bottom panel), SDSS1212–0123 left the CE phase with an orbital period of hrs, very similar to the present value. Significant changes in the orbital period are predicted to occur on timescales longer than the current cooling age of the white dwarf. In years SDSS1212–0123 will eventually become a CV within the orbital period gap, however, giving that it’s calculated PCEB lifetime exceeds the age of the Galaxy it is not representative of the progenitors of todays CV population.
5 Conclusions
From optical photometry we conclude SDSS1212–0123 is a eclipsing PCEB with an orbital period of days and an eclipse length of min. From spectroscopic follow-up observations we have derived a systemic velocity of km/s and a semi-amplitude of the radial velocity of km/s. From the SDSS spectrum we derived K, implying a mass in the range M⊙ and a secondary spectral type , and a distance to the system of parsecs. From infrared photometry, using a mass–luminosity empirical relation we derived M⊙. We have calculated the radius of the secondary star using an empirical mass–radius ralation. The mass function, combined with the eclipse length, points towards the high end of the allowed mass range of the primary, i.e. . We have modeled the band light curve and find the inclination of the orbit to be , and the masses to be consistent with previously determined values. The different methods applied are all consistent with M⊙, implying R⊙ () for the primary and M⊙, R⊙ for the secondary. We have reconstructed and predicted the post CE evolution of SDSS1212–0123, finding that SDSS1212–0123 at the end of the CE phase had a very similar orbital period. The only mechanism involved in shrinking the orbital period is and has been gravitational radiation. As the PCEB lifetime of SDSS1212–0123 exceeds the Hubble time we conclude that it is not representative of the progenitors of the current CV population.
Acknowledgements.
We thank our referee, Dr.S.B Howel, for a careful review of the original manuscript. We thank T.R. Marsh for the use of his light-curve modeling code. ANGM, MRS, RSC, JV and MK acknowledge support by the Deutsches Zentrum für Luft-und Raumfahrt (DLR) GmbH under contract No. FKZ 50 OR 0404. MRS was also supported by FONDECYT (grant 1061199), DIPUV (project 35), and the Center of Astrophysics at the Universidad de Valparaiso. JK was supported by the DFG priority programme SPP1177 (grant Schw536/23-1). Funding for the SDSS and SDSS-II has been provided by the Alfred P. Sloan Foundation, the Participating Institutions, the National Science Foundation, the U.S. Department of Energy, the National Aeronautics and Space Administration, the Japanese Monbukagakusho, the Max Planck Society, and the Higher Education Funding Council for England. The SDSS Web Site is http://www.sdss.org/. The SDSS is managed by the Astrophysical Research Consortium for the Participating Institutions. The Participating Institutions are the American Museum of Natural History, Astrophysical Institute Potsdam, University of Basel, University of Cambridge, Case Western Reserve University, University of Chicago, Drexel University, Fermilab, the Institute for Advanced Study, the Japan Participation Group, Johns Hopkins University, the Joint Institute for Nuclear Astrophysics, the Kavli Institute for Particle Astrophysics and Cosmology, the Korean Scientist Group, the Chinese Academy of Sciences (LAMOST), Los Alamos National Laboratory, the Max-Planck-Institute for Astronomy (MPIA), the Max-Planck-Institute for Astrophysics (MPA), New Mexico State University, Ohio State University, University of Pittsburgh, University of Portsmouth, Princeton University, the United States Naval Observatory, and the University of Washington. This publication makes use of data products from the Two Micron All Sky Survey, which is a joint project of the University of Massachusetts and the Infrared Processing and Analysis Center/California Institute of Technology, funded by the National Aeronautics and Space Administration and the National Science Foundation.References
- Adelman-McCarthy et al. (2008) Adelman-McCarthy, J. K., Agüeros, M. A., Allam, S. S., et al. 2008, ApJS, 175, 297
- Aungwerojwit et al. (2007) Aungwerojwit, A., Gänsicke, B. T., Rodríguez-Gil, P., et al. 2007, A&A, 469, 297
- Baraffe et al. (1998) Baraffe, I., Chabrier, G., Allard, F., & Hauschildt, P. H. 1998, A&A, 337, 403
- Bayless & Orosz (2006) Bayless, A. J. & Orosz, J. A. 2006, ApJ, 651, 1155
- Bergeron et al. (1995) Bergeron, P., Wesemael, F., Lamontagne, R., et al. 1995, ApJ, 449, 258
- Cutri et al. (2003) Cutri, R. M., Skrutskie, M. F., van Dyk, S., et al. 2003, 2MASS All Sky Catalog of point sources. (The IRSA 2MASS All-Sky Point Source Catalog, NASA/IPAC Infrared Science Archive. http://irsa.ipac.caltech.edu/applications/Gator/)
- Delfosse et al. (2000) Delfosse, X., Forveille, T., Ségransan, D., et al. 2000, A&A, 364, 217
- Drake et al. (2008) Drake, A. J., Djorgovski, S. G., Mahabal, A., et al. 2008, ArXiv e-prints
- Gänsicke et al. (2004) Gänsicke, B. T., Araujo-Betancor, S., Hagen, H.-J., et al. 2004, A&A, 418, 265
- Horne (1986) Horne, K. 1986, PASP, 98, 609
- Iben & Livio (1993) Iben, I. J. & Livio, M. 1993, 105, 1373
- Kafka et al. (2005) Kafka, S., Honeycutt, R. K., Howell, S. B., & Harrison, T. E. 2005, AJ, 130, 2852
- Kawka & Vennes (2007) Kawka, A. & Vennes, S. 2007, ArXiv Astrophysics e-prints
- Koester et al. (2005) Koester, D., Napiwotzki, R., Voss, B., Homeier, D., & Reimers, D. 2005, A&A, 439, 317
- Leggett et al. (2000) Leggett, S. K., Allard, F., Dahn, C., et al. 2000, ApJ, 535, 965
- Marsh (1989) Marsh, T. R. 1989, PASP, 101, 1032
- Martin et al. (2005) Martin, D. C., Fanson, J., Schiminovich, D., et al. 2005, 619, L1
- Morales-Rueda et al. (2005) Morales-Rueda, L., Marsh, T. R., Maxted, P. F. L., et al. 2005, MNRAS, 359, 648
- Morrissey et al. (2005) Morrissey, P., Schiminovich, D., Barlow, T. A., et al. 2005, 619, L7
- Osterbrock et al. (1997) Osterbrock, D. E., Fulbright, J. P., & Bida, T. A. 1997, PASP, 109, 614
- Osterbrock et al. (1996) Osterbrock, D. E., Fulbright, J. P., Martel, A. R., et al. 1996, PASP, 108, 277
- Paczyński (1976) Paczyński, B. 1976, in IAU Symp. 73: Structure and Evolution of Close Binary Systems, 75
- Politano & Weiler (2007) Politano, M. & Weiler, K. P. 2007, ApJ, 665, 663
- Pyrzas et al. (2008) Pyrzas, S., Gänsicke, B. T., Marsh, T. R., et al. 2008, arXiv:0812.2510v1
- Rappaport et al. (1983) Rappaport, S., Verbunt, F., & Joss, P. C. 1983, ApJ, 275, 713
- Rebassa-Mansergas et al. (2007) Rebassa-Mansergas, A., Gänsicke, B. T., Rodríguez-Gil, P., Schreiber, M. R., & Koester, D. 2007, MNRAS, 382, 1377
- Rebassa-Mansergas et al. (2008) Rebassa-Mansergas, A., Gänsicke, B. T., Schreiber, M. R., et al. 2008, MNRAS, 390, 1635
- Richards et al. (2004) Richards, G. T., Nichol, R. C., Gray, A. G., et al. 2004, ApJS, 155, 257
- Schreiber & Gänsicke (2003) Schreiber, M. R. & Gänsicke, B. T. 2003, A&A, 406, 305
- Schreiber et al. (2008) Schreiber, M. R., Gänsicke, B. T., Southworth, J., Schwope, A. D., & Koester, D. 2008, A&A, 484, 441
- Shimansky et al. (2006) Shimansky, V., Sakhibullin, N. A., Bikmaev, I., et al. 2006, A&A, 456, 1069
- Sills et al. (2000) Sills, A., Pinsonneault, M. H., & Terndrup, D. M. 2000, ApJ, 534, 335
- Silvestri et al. (2006) Silvestri, N. M., Hawley, S. L., West, A. A., et al. 2006, AJ, 131, 1674
- Steinfadt et al. (2008) Steinfadt, J. D. R., Bildsten, L., & Howell, S. B. 2008, ApJ, 677, L113
- Taam & Ricker (2006) Taam, R. E. & Ricker, P. M. 2006, ArXiv Astrophysics e-prints
- Tappert et al. (2007) Tappert, C., Gänsicke, B. T., Schmidtobreick, L., et al. 2007, A&A, 474, 205
- van den Besselaar et al. (2007) van den Besselaar, E. J. M., Greimel, R., Morales-Rueda, L., et al. 2007, A&A, 466, 1031
- Wood (1995) Wood, M. A. 1995, in White Dwarfs, ed. D. Koester & K. Werner, LNP No. 443 (Heidelberg: Springer), 41–45