The role of cooperative binding on noise expression
Abstract
The origin of stochastic fluctuations in gene expression has received considerable attention recently. Fluctuations in gene expression are particularly pronounced in cellular systems because of the small copy number of species undergoing transitions between discrete chemical states and the small size of biological compartments. In this paper, we propose a stochastic model for gene expression regulation including several binding sites, considering elementary reactions only. The model is used to investigate the role of cooperativity on the intrinsic fluctuations of gene expression, by means of master equation formalism. We found that the Hill coefficient and the level of noise increases as the interaction energy between activators increases. Additionally, we show that the model allows to distinguish between two cooperative binding mechanisms.
I Introduction
All chemical reactions have intrinsic fluctuations that are inversely proportional to the system size. Such fluctuations are particularly pronounced in gene expression. At the transcriptional level, gene expression is mainly controlled by the cis-regulatory system (CRS) and transcription factor (TF) proteins that bind specifically to DNA sites ptashne . The TFs influence the transcription rate by interacting with other transcriptional components (RNA polymerase, TATA-binding protein, etc.). Like any molecular interaction, the binding of TFs to the regulatory sites is a stochastic event rendering the transition between states of the CRS a stochastic process. This source of noise is known as intrinsic noise in gene expression regulation, to distinguish it from that produced by other influences such as random fluctuations in nutrients, cell division or regulatory inputs to the transcriptional machinery, known as extrinsic noise swain ; elowitz02 .
There is a broad variety of different CRS motifs that underly such regulation. The diversity of CRS range from simple ones to more complex motifs that include dozens of regulatory sites, some of them organized in clusters or tandems ptashne . This cluster organization points to cooperative effects in the gene regulatory process, because proteins rarely seem to bind to DNA without interacting with other DNA-binding proteins. Despite this complexity, the bulk of stochastic models for gene regulation are based on transitions between two promoter states (active and inactive) and, recently, more complex models have been explored blake ; pnas08 . All these models approximate the transcriptional control by using a regulatory expression function (Hill function in thattai ; simpson ; garder ; elo or an ad-hoc function to fit the model to the experimental data in blake ; pnas08 ). The approximation assumes that changes in the levels of TF are reflected instantaneously in the transcription rate. Although this approximation could be reasonable to study the static deterministic behavior of transcriptional regulation garder ; elo , it could leads to a significant underestimation of transcriptional noise cox2 . Consequently, these models cannot accurately describe how the overall regulatory process affects noise expression. In this article, we propose a theoretical model of transcriptional regulation that considers a CRS with several regulatory binding sites for activating proteins. All transition rates between CRS states follow the law of mass action for elementary reactions. In this way, our model accounts for the fact that the expression response is determined by the dynamics of CRS.
II The Model
We are interested in exploring how the molecular interaction affect the cooperativity and the fluctuations level of the gene expression. In this sense, we found that stronger interaction between activators increases the level of noise expression. In our model the transcriptional regulation is assumed to be a stochastic process in which the regulatory system makes transitions between different states. The model includes regulatory binding sites for the same TF (Fig. 1 illustrates the case with three regulatory binding sites). The states represent, respectively, states with binding sites occupied by TFs. The states correspond to the transcriptional complex formation, where all components required for transcription are assembled on the CRS. Once the core transcription apparatus is formed, the synthesis of one mRNA copy begins.

The working hypothesis is that TFs bound to DNA alter the probability of transcriptional complex formation. Consequently, states are characterized by different rates of transcriptional complex formation. For simplicity, we consider that some bindings are sequential, i.e., TF does not bind or unbind after transcriptional complex formation and transcriptional complex does not assemble before TFs bound to DNA site. Additionally, we consider that the sites are functionally identic, i.e., the model does not distinguish among states with the same number of TFs bound to regulatory binding sites. Thus, in our model, the states of CRS are related more to the occupancy number rather than to the binding status of each site. This additional simplification reduces the number of states accessible to the CRS and allows us to explore the role of cooperativity on noise expression without considering a combinatorial number of states. The model assumes that mRNA is synthesized at a rate which depend on the state . mRNA is considered to degrade linearly with rates .
As other authors thattai ; elston , we used the master equation approach to derive the average behavior of mRNA level, as well as its fluctuations. For this system, the state is specified by two stochastic variables: the state of the CRS , and the number of transcripts . We can write the probability to find, at any given time , the system in the state as a vector . The time evolution for this probability is governed by the following master equation:
| (1) | |||||
where are the elements of the transition matrix and represent the transition probability per time unit from state to state , are the elements of a vector and correspond to the transcription rate of state . The first term on the right hand side of the equation (1) describes the CRS dynamics, while the second and third terms correspond to the production and degradation of mRNA, respectively.
We are mainly interested on both the gene expression level and its fluctuations. The first is measured through the first moment of the number of transcripts , and the last through the corresponding variance, related to the second moment:
| (2) |
where the summation limits were suppressed for the sake of readability. We want to remark that from now on, every sum over transcript numbers will be from to , while the sum over CRS states will be from to .
Moments of -th order can be written in term of its associated partial moments
| (3) |
Note that the zero partial moments are the marginal probabilities for the CRS to be in state , regardless the number of transcripts, i.e., .
From Eqs. (1) we can derive a set of ordinary differential equations for the time evolution of the partial moments for any . As there is no feedback, the system is linear and can be solved analitycally. Thus, the time evolution of partial moments for and 2 are given by
| (5) | |||||
| (7) | |||||
| (9) |
From these partial moments, we can readily find first order differential equations governing the time evolution of the mean and variance,
| (10) | |||||
| (11) | |||||
From Eq. (10), the steady-state solutions for the mean value of is
| (12) |
where ∗ denotes the steady state solution. The steady-state solution of the probability vector corresponds to the normalized eigenvector associated to the zero eigenvalue of the CRS transition matrix .
The steady state solution for the variance follows from Eq. (11)
| (13) |
where is determined as the solution of the linear equation
| (14) |
where is the Kronecker delta. The expressions (12–14) are general, in the sense that they are valid for binding sites in the CRS. In this paper, we have limited the study to the case of Fig. 1, i.e., a CRS with , and for and zero otherwise. We are motivated to set because the cooperative effects are more apparent for greater . However, an approximation used in the next Section, could not be adequate for higher . The TFs can bind to regulatory sites with a probability proportional to TF concentration ( and , where are the kinetic rates), following the law of mass action for elementary reactions. TF unbinding events depend only on the kinetic constants ( and ). In this case the transition matrix can be written as
| (15) |
and the associated steady state solutions of the partial probabilities involved on Eq. (12) are
| (16) |
where for and for . Replacing these expressions on Eq. (12), we find the explicit form for the steady state expression level of transcripts
| (17) |
Unfortunately, though a closed expression for the variance is obtained it is too long to report here. From this point the ∗ will be suppressed from the steady states expressions.
III Binding cooperative mechanisms
As the regulatory sites are assumed to be functionally identic, we can introduce a relationship between the TF binding/unbinding when there is no interaction between the TFs. Thus, if the probability per time unit that a single TF molecule binds to a regulatory site is , we have , , , where o indicates that there is no interaction between TFs. Similarly, unbinding rates are given by , , , where is the probability per time unit that a single TF molecule unbinds from an occupied site.
Now, we will assume that the probability for a TF molecule to bind to a given regulatory site arises from: i) the free energy of binding a TF to the specific site , ii) the free energy of interaction between TF molecules bound to adjacent sites . From these assumptions and the principle of detailed balance hill85 , we are able to find a relationship between kinetic rates with and without interactions among TFs. In the case , we have
| (18) |
where represents the transition rate from state to state when there is no interaction between TFs ( represents the rate for reverse transition). In general, the TF molecules interact with each other, i.e., . Consequently, we have
| (19) |
where represents the intensity of the interaction between TFs. represents the number of interactions. We assume that all bounded TFs interact with the new one, regardless of their position on the CRS, thus we have . This means for example that in the state , the third TF interacts with the two bounded TFs. As the cooperative effects are more apparent for greater , we are motivated to use a high number of binding sites. However, the assumption could be inadequate for when due to the greater separation between faraway sites. For this reason, we set for further calculations. The relationship (19) leaves an extra degree of freedom, because the interaction between TFs can increases the binding rate , increasing the ability for new TF recruitment for DNA binding, or it can diminishes the unbinding rate , increasing the stability of the TF-DNA bound. The first case will be denoted here as the recruitment mechanism (RM), while the second case will be denoted as stabilization mechanism (SM). These two mechanisms are not mutually excluding, and they could be acting simultaneously in real life, but in order to study their effect on the regulatory response and its associated fluctuations, we will consider the alternative cooperativity binding mechanisms separately. Thus, using relations (19) and the relations for binding/unbinding rates, we obtain
| (20) |
for the first mechanism, while for the second mechanism we have
| (21) |
Table I summarizes the parameter values used in this work (the time unit is min and concentration is an arbitrary unit.) Binding and unbinding parameters were obtained considering , and (which is equivalent to Kcal). Cases RM and SM have the same TF interaction intensity, while when there is no interaction between TFs.
| TF binding/unbinding rates | TC formation rates | ||||
| RM case | SM case | case | |||
| 0.75 | 0.75 | 0.75 | 0.50 | ||
| 0.75 | 0.75 | 0.75 | 0.50 | ||
| 3.00 | 0.50 | 0.50 | 1.00 | ||
| 1.50 | 0.25 | 1.50 | 0.50 | ||
| 9.00 | 0.25 | 0.25 | 1.50 | ||
| 2.25 | 0.0625 | 2.25 | 0.50 | ||
| Production and degradation rates | |||||
| mRNA (layer III) | 1.50 | 0.03 | |||
IV Results
From the Eq. (17) for the mean, Eqs. (13-14) for the variance, and using the parameters values of Table I, we study the response of an activator switch. We consider that the kinetic rates for transcriptional complex formation increase linearly with the occupancy number, i.e. . With this condition we assume that there is no synergism between TF and transcriptional complex formation syner . This synergism can contribute to the effective cooperativity (data not shown). Figure 2A depicts the average number of mRNA copies and Figure 2B depicts the standard deviation as a function of the activator concentration , obtained analytically for the three cases: RM case, the interaction between TFs increases the binding rates, (solid line); SM case, the interaction between TFs decreases the unbinding rates; and () case, where there is no interaction between TFs (dotted line). The mean response of RM and SM cases are exactly the same.

The regulatory function for both examples with cooperative binding fit the Hill function , where is the binding protein concentration, is the maximum number of transcripts, is the dissociation constant, and is known as the Hill coefficient which determines the steepness of the regulatory function. Both RM and SM cases the Hill coefficient is , while the case is associated to a response without cooperativity . In all cases the fluctuation level estimated by the standard deviation (see Figure 2B) has a peak centered around the dissociation constant . Relative fluctuations are characterized by the normalized standard deviation. Analyzing an un-normalized measure can lead to artefactual results paul04 . Fig. 2C depicts the noise (defined as ) as a function of the transcriptional efficiency (defined as the ratio between transcription and maximum transcription , where is the maximum of ) for each case in Figure 2A.
Figure 2 shows that cooperativity has an effect not only in controlling the expression response increasing , but also in increasing the relative size of fluctuations. We note also that though the regulatory function in RM and SM cases is the same, the mechanism of increasing the TF-DNA complex stabilization (SM) is associated to higher level of noise (dashed line) than the mechanism involving an improvement in the recruitment ability of new TF to the DNA (RM) (solid line). Figures 2 suggest that the two cooperative binding mechanisms considered here affect the fluctuation level in a differential way but not the regulatory function. Even though this function is altered by the FT interactions, it is not possible to distinguish between the alternative mechanisms through the regulatory function only.
 |
 |
We also analyze how the binding and unbinding rates, and respectively, affect the regulatory function and the fluctuation level. Figure 3A depicts the behavior of the dissociation constant , as function of the unbinding rate (left) and as function of binding rates (right), keeping the other rates constant. does not depend on which cooperative binding mechanism is acting (the curves are completely overlapped). However, increases linearly with binding rate , and it is inversely proportional to the binding rate . Figure 3B depicts the behavior of the Hill coefficient , as function of the binding/unbinding rate (right/left), keeping the other rates constant. We can observe that is almost independent on these rates. From Fig. 3C, we note that the level of noise is sensitive to the type of cooperative binding mechanisms which is. decreases with the unbinding rate more slowly in the SM (dashed line) than in the RM (solid line). The difference between the two mechanisms diminishes when the unbinding rate decreases, while the maximum value of dispersion is not affected when the unbinding rate varies. Due to the complexity of the problem are not able to provide a quantitative proof that SM leads to larger noise than the RM in all conditions. However, from figure 3C we can see that noise level does not depend on the binding rate , but it depends on the the unbinding rate . As the interaction energy between TFs decreases the unbinding rate in the SM, it is expected that SM has associated a higher level of fluctuation than the RM.
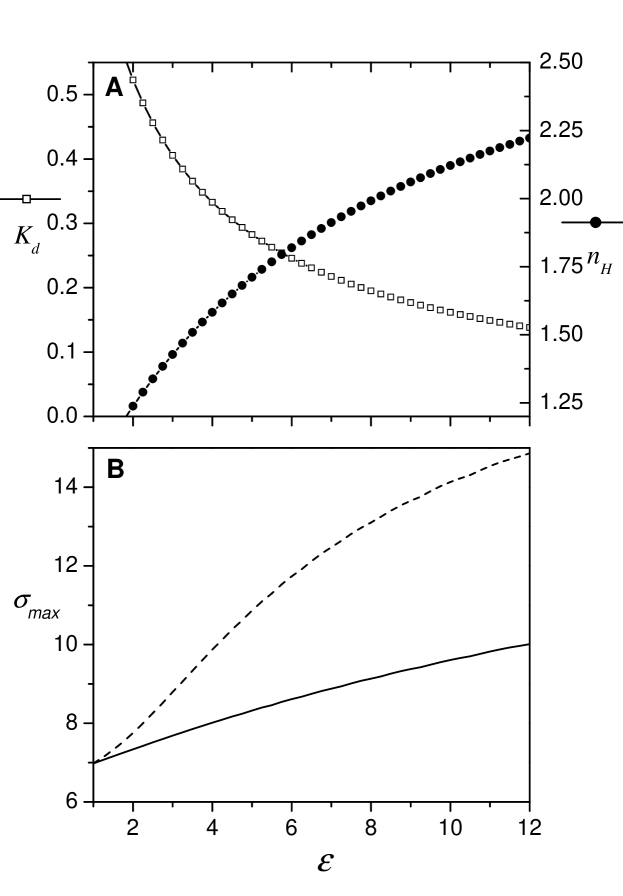
Finally, we show how the interactions between TFs alters both and parameters of the regulatory function and also the fluctuation level. Figure 4A illustrates how the parameters and are affected by the interaction intensity . The Hill coefficient (filled circle symbols), scaled on the right vertical axis, increases with , suggesting that the steepness of the regulatory function depends linearly on the free energy . Furthermore, the dissociation constant (open square symbols), scaled on the left vertical axis of Figure 4A, decreases with the interaction intensity. Finally, we found that the fluctuation level increases with the interaction intensity. Figure 4B depicts the maximum value of the standard deviation as a function of . We have observe that the RM (solid line) is less sensitive to the interaction intensity than the SM (dashed line). We want to remark that the differences between the recruitment and stabilization mechanisms vanish when there is not interaction energy between TF (). These observation suggest that our model predicts that interactions between TFs improve the response of the regulatory system in the sense of specificity (higher ) and sensitivity (lower ). But, in contrast, the system loses accuracy because the noise increases with the intensity of the interaction.
V Conclusion
We have shown that a model which includes several binding sites is able to address the question of cooperative binding effects on fluctuations. The first moment of is the same as that obtained from thermodynamic models, which depends solely on equilibrium constants. Nevertheless, second moments have allowed us to introduce new quantitative insights on the TF cooperative binding effects in the cell-to-cell variability. We found that two different cooperative binding mechanisms can be distinguished: the RM which increases the ability for new TF recruitment, and the SM which increases the stability of the TF-DNA bound. In both mechanisms, the Hill coefficient and level of noise increase as the interaction energy between activators increases. Only a few kilocalories of binding energy between TFs have a dramatic effect on the noise level, which also depends on the acting cooperative binding mechanisms. The other hand, the mechanism that reduces the unbinding rates is associated to a greater level of noise which is in agreement with two state model kaern .
Both mechanisms reported here are derived from the thermodynamics relationship used in the modeling. This cannot be done in simpler models that use regulatory expression function rather than TFs thats bound to several binding sites on DNA following the law of mass action. These different mechanisms have not been reported previously. Although the proposed model is more complicated than previous, it can also be solved analytically. Thus, the model constitutes an adequate frame to discuss the impact of the diverse cooperativity mechanisms on the gene expression fluctuations. However, we want to remark that the presented model is limited to intrinsic contribution of noise, i.e. it does not regard the fluctuation on the TF concentration and other extrinsic source of noise, which certainly contribute to the total noise.
Acknowledgements
We thank Christina McCarthy for critical review of the manuscript. P.S.G. thanks CONICET for financial support. L.D. is researcher of CONICET (Argentina). D.M. is researcher of CICPBA (Buenos Aires-Argentina).
References
- (1) Ptashne M. (2004) A Genetic Switch (Cold Spring Harbor Lab Press, Cold Spring Harbor, NY)
- (2) Swain PS, Elowitz MB, Siggia ED. (2002) Proc. Natl Acad. Sci. USA 99 12795–12800.
- (3) Elowitz MB, Levine AJ, Siggia ED, Swain PS. (2002) Science 297 1183–1186.
- (4) Blake WJ, Kærn M, Cantor CR Collins JJ. (2003) Nature 422 633–637.
- (5) Sanchez A, Kondev J. (2008) Proc. Natl Acad. Sci. USA 105 5081 5086.
- (6) Thattai M, van Oudenaarden A. (2001) Proc. Natl Acad. Sci. USA 98 8614 -8619.
- (7) Simpson L, Cox CD, Sayler GS. (2003) Proc. Natl. Acad. Sci. USA 100 4551–4556.
- (8) Gardner S, Cantor CR, Collins JJ. (2000) Nature 403 339–342.
- (9) Elowitz B, Leibler S. (2000) Nature 403 335–338.
- (10) Cox CD, McCollum JM, Austin DW, Allen MS, Dar RD, Simpson ML. (2006) Chaos 16 026102.
- (11) Kepler TB, Elston TC. (2001) Biophys. J. 81 3116 -3136.
- (12) Hill TL. (1985) Cooperativity theory in Biochemistry: Steady state and Equilibrium systems. Springer Series in Molecular Biology, Springer-Verlag, New York.
- (13) Herschlag D, Johnson FB. (1993) Genes Dev 7 173–179.
- (14) Paulsson J. (2004) Nature 427 415–418.
- (15) Kærn M, Elston TC, Blake WJ, Collins JJ. (2005) Nature Rev. Genet. 6 451–464.