Transverse Single-Spin Asymmetries at in Collisions at GeV
Abstract
Large transverse single-spin asymmetries, , have been observed in forward hadron production at RHIC. STAR has reported precision measurements of the - dependence of for forward production. Contrary to expectation, the asymmetry does not fall with . However, questions remain about the trend at the lower end of the studied range, GeV/c. Analysis of data from the 2008 RHIC run has extended the data in the , low region. Preliminary results are reported.
Keywords:
Transverse Single-spin Asymmetries:
13.88.+e1 Introduction
In 2006, STAR measured transverse single-spin asymmetries, , for forward rapidity production in collisions at GeV to GeV Abelev:2008 . Results showed large at high- as seen in previous experiments at lower center-of-mass energies, such as Fermilab E704 Adams:1991-261 ; Adams:1991-264 . In contrast to the E704 kinematics, pQCD predictions provide a reasonable description of the observed cross-sections for forward production at GeV Adams:2006 . Model calculations based on the Sivers D'Alesio:2004 and Collins Yuan:2008 effects provide fair descriptions of the -dependence of the measured asymmetries. The Sivers model relates the asymmetry to correlations involving initial-state parton transverse momentum Sivers:1990 while the Collins model relates the asymmetry to final-state transverse momentum dependent fragmentation Collins:1993 . However, the observed asymmetries do not provide an indication of decreasing with increasing , as predicted by theory D'Alesio:2004 ; Yuan:2008 . Isolating the origin or, in the case of a combination of effects, disentangling the origins of the observed asymmetries would provide crucial information about proton spin structure.
The previous STAR measurements Abelev:2008 provide a hint of an initial decrease of with for . The data obtained in this low-, high- region were recorded during 2003 and 2005, and are limited by low statistics and low polarization. For the 2008 RHIC run, STAR extended measurements to low-, high- kinematics to further investigate this region with better statistics and polarization.
2 Forward Pion Detector
To obtain the measurements for the 2008 run, data were taken with the STAR Forward Pion Detector (FPD). The FPD is an electromagnetic calorimeter, consisting of two modules, left and right of the beamline on the east side of STAR. Each module consists of a array of PbGl calorimeters positioned 809 cm from the interaction point Bland:2006 . Each PbGl calorimeter cell measures cm3. To access the desired low-, high- kinematics, the modules were positioned at .
3 Event Cuts and Systematics
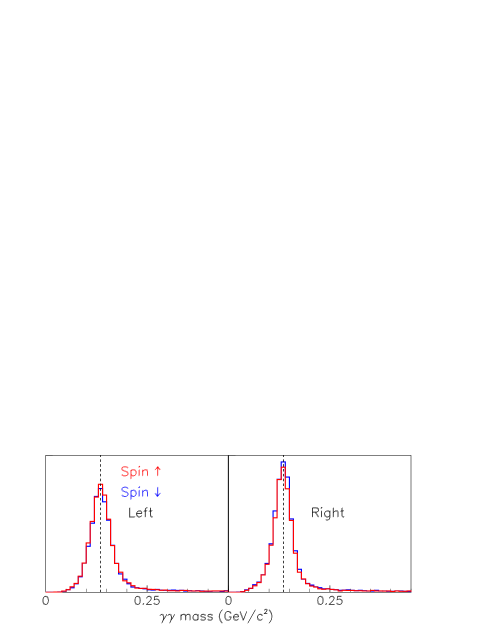
Data were taken from yielding pb-1 with beam polarization, . Events were required to pass a hardware trigger that required a nominal summed energy of 25 GeV in a single FPD module. Software cuts were applied for di-photon events, requiring energy sharing and GeV/c2 GeV/c2, and a software total energy threshold of GeV was applied. The events were required to fall within a fiducial volume of one-half the width of a PbGl cell from the edge of each module. Calibration procedures involved analyzing raw ADC’s channel-by-channel and run-by-run for pedestal shifts. For gain calibration, mass peaks were reconstructed channel-by-channel and corrected in an iterative process until convergence to the known value was achieved. Energy-dependent corrections were evaluated by fitting the peak in energy bins, then obtaining a linear fit of the ratio of the known value over the fitted centroids vs. energy. Finally, run-by-run summed-mass values are used to correct for run-dependent gain shifts. The result is agreement between the di-photon peaks in each module and the known value of the for polarization spin-up or spin-down, Fig. 1.
Systmatic errors are dominated by gain calibration issues and yields under the pion mass peak. Gain calibration issues arise because of limited statistics in the PbGl cells that are farthest from the beam in each module. To correct for yields under the pion peak, varying mass cuts were studied. The total systematic uncertainty was obtained by combining the effects in quadrature.
4 Run-8 Asymmetries
Asymmetries shown have been calculated using a cross-ratio method,
| (1) |
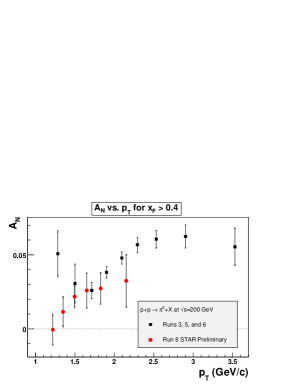
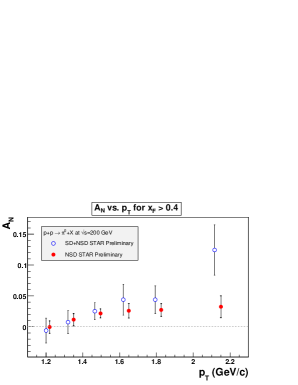
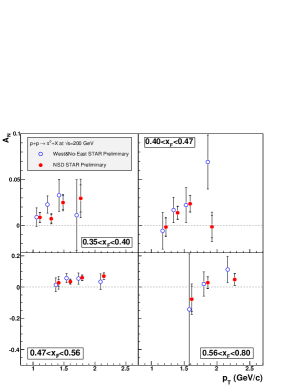
where is the number of events in the left (right) module with spin up (down). Results for are consistent with zero, so we show data only for . Results are shown for two different software conditions on the STAR Beam-Beam Counter (BBC). First, a software trigger requiring a coincidence between BBC-east (BBCE) and BBC-west (BBCW) is required, producing a nearly pure non-singly-diffractive (NSD) event sample. These data are shown in comparison to previously published data from RHIC runs 3, 5, and 6 Abelev:2008 . A second event sample is analyzed requiring a hit in BBCE, the same side of the collision as the FPD, and no hit in BBCW. This results in a mixture of NSD and singly-diffractive (SD) events. Results from analysis of the mixed sample are shown in comparison with the nearly-pure NSD event sample. Statistical errors are calculated as and scaled to account for remaining acceptance asymmetries, which are less than . For the nearly-pure NSD event sample, figures show inner error bars for statistical errors and outer error bars for systematic errors combined in quadrature with statistical errors. Errors for the mixed event sample are statistical only. The systematic uncertainties for the mixed event sample are expected to be less than the statistical errors.
5 Results
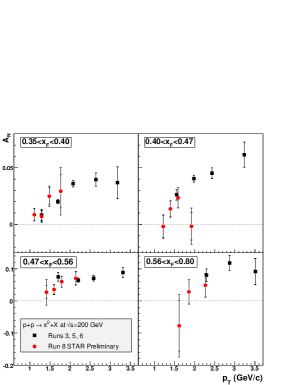
Results from RHIC run-8 are mostly consistent with results from previous runs, Fig. 2 (Left). However, in the low- region where previous data were dominated by RHIC run 3 with limited statistics, the run-8 data show continuing to decrease. Likewise, observing the -dependence at fixed , Fig. 3 (Left), run-8 results show general agreement with previous results in overlapping regions and smooth fall-off toward lower-.
6 Summary
We have shown STAR measurements of transverse single-spin asymmetries, , from at GeV from the 2008 RHIC run. The data show general consistency with previous measurements and show continuing to decrease at low-. We have also shown results from a mixed event sample combining singly-diffractive and non-singly-diffractive events. Results from the mixed event sample are consistent with results from the nearly-pure non-singly-diffractive event sample.
References
- (1) B. I. Abelev et al., Phys. Rev. Lett. 101, 222001 (2008).
- (2) D. L. Adams et al., Phys. Lett. B 261, 201 (1991).
- (3) D. L. Adams et al., Phys. Lett. B 264, 462 (1991).
- (4) J. Adams et al., Phys. Rev. Lett. 97, 152302 (2006).
- (5) U. D’Alesio, F. Murgia, Phys. Rev. D 70, 074009 (2004).
- (6) F. Yuan, arXiv:hep-ex/0804.3047v2.
- (7) D. Sivers, Phys. Rev. D 41, 83 (1990).
- (8) J. Collins, Nucl. Phys. B 396, 161 (1993).
- (9) L. C. Bland, arXiv:hep-ex/0602012.