Depth dependent local structures in thin films unraveled by grazing incidence x-ray absorption spectroscopy
Abstract
A method of using X-ray absorption spectroscopy (XAS) together with resolved grazing incidence geometry for depth profiling atomic, electronic, chemical or magnetic local structures in thin films is presented. The quantitative deconvolution of thickness-dependent spectral features is performed by fully considering both scattering and absorption formalisms. Surface oxidation and local structural depth profiles in nanometric FePt films are determined, exemplifying the application of the method.
I Introduction
Magnetic thin films have attracted a lot of attention due to their extremely high-density magnetic recording applications (Weller and Doemer, 2000). In this regard, a clear understanding of the macroscopic magnetic properties requires a substantial knowledge of its dependence with layers thicknesses (Johnson et al., 1996) and the complex microstructural effects frequently localized at the interface with the substrate or the surface of the films. Such effects can be studied using experimental techniques able to peer selectively in the depth of the films. In a previous letter (Souza-Neto et al., 2006) we presented qualitative results using x-ray absorption spectroscopy (XAS) with resolved grazing incidence (GI) to clarify the thickness-dependent magnetic properties in nanometric CoPt films. A depth dependent chemical order was revealed and the magnetic behavior was interpreted within this framework. In the present paper we provide a rigorous quantitative method for the deconvolution of the local atomic, chemical and magnetic structural depth profiles. This method is then illustrated by its application to oxidized FePt thin films (Martins et al., 2006). The proposed approach makes GI-XAS a unique tool to address the depth dependence of the local structural parameters, suitable for nanometric structures where this dependence is a crucial issue. Moreover this method provides a new venue to rigorously determine depth dependent electronic structure profiles using XANES (x-ray absorption near edge structure), which turns out to be crucial in understanding striking artifical interface materials (Souza-Neto et al., 2009; Chakalian et al., 2007).
Although the general phenomena of scattering and absorption of x-rays by the condensed matter are nowadays quite well understood (Als-Nielsen and McMorrow, 2001), they still are normally explored from unconnected viewpoints. A few well established techniques surpass this general rule with interconnected scattering and absorption techniques, providing invaluable additional selectivity compared to each approach used separately. DAFS (diffraction anomalous fine structure) gives site selectivity and local structural information (Stragier et al., 1992). XAFS (x-ray absorption fine structure) extracted from reflectivity data gives local structural information from surfaces and interfaces (Keil et al., 2005). XSW (x-ray standing wave) locates impurities in bulk crystals and nanostructures using an interference field that provides spatial dependence to the x-ray spectroscopic yields from atoms within the field (Bedzyk et al., 1989). Similarly, glacing-incidence x-ray fluorescence (GIXRF) is a sensitive probe of chemical composition as a function of depth (deBoer, 1991). These techniques are based on similar approaches to the one presented here, however they are limited to near-perfect crystal structures, require well defined geometries and/or give a limited set of information.
II Grazing incidence x-ray absorption spectroscopy
X-ray absorption spectra contain information about the ground state of the selected element in a material (local symmetry, oxidation and spin states, spin-orbit coupling in the and orbitals, crystal field, covalence and charge transfer). As a matter of fact, in the case of transition metals essentially structural information is obtained from the K edges, while more magnetic and electronic information is usually deduced from edge. XAS is not a surface technique by itself, since the atenuation length of hard x-rays is of a few micrometers in any material. However, in the grazing incidence geometry near the critical angle for total reflexion, the x-ray beam is confined within a few nanometers from the surface. For this film studies, this confinement has the considerable advantage of minimizing the substrate contribution.
The grazing incidence x-ray absorption measurements were performed at the Brazilian Synchrotron Light Laboratory (LNLS - Laboratório Nacional de Luz Síncrotron). The setup includes 20 m-vertical slits limiting the beam size on the sample mounted on a high precision goniometer. XANES spectra were collected in the fluorescence mode at the D04B-XAFS1 beamline (Tolentino et al., 2001) with a Si (111) channel-cut monochromator. The incident beam intensity was monitored using a first ion-chamber. The reflected beam and fluorescence emission were simultaneously collected using a second ion-chamber and a 15-elements Ge detector, respectively. The fluorescence emission and/or x-ray reflectivity curves were used to calibrate and select with an accuracy of the working grazing angle corresponding to a chosen penetration depth profile. For an accurate energy calibration, the transmission through an Iron metal reference foil was monitored using a third ion-chamber.
The collected absorption spectra measured by the fluorescence yield is a mix of contributions coming from different depths. To get quantitative information we must deconvolve them into their absorption contributions from each depth (z) into the films at each photon energy (E) and grazing angle (). The electromagnetic radiation amplitude at each set of (E, , z) must be known to weightly sum the absorption contributions as function of energy and angle (), as follows:
| (1) |
where is the radiation intensity as function of E, z and ; is the absorption spectrum contribution at the depth z and is the normalizing factor . The main difficulty to determine each by solving this equation is the initial calculation of , which depends on how the layers structure of the film dynamically refract and reflect the incident radiation, as a function of energy and depth. The formalism adopted to determine this intensity and the way to extract the depth dependence from GI-XAS spectra are described in the following section.
II.1 Refracted and reflected amplitudes as a function of the penetration depth, photon energy and incident angle
Several approaches (Born and Wolf, 1993; Henke et al., 1993; Yun and Bloch, 1990; Mikulík, 1997; Als-Nielsen and McMorrow, 2001; deBoer, 1991; Authier, 2001; Baron, 1995; Stepanov et al., 1998; Lee et al., 2003; Parrat, 1954) can be used to estimate the transmissivity of x-rays inside a material. Those based on the dynamical diffraction theory give the most accurate results near the critical angle of total external reflection. We deal here with conditions near the critical energy and angle for absorption and reflectivity resonances. Hence the method must include all dynamical reflections and refractions conditions to determine the internal electromagnetic wave amplitude in the samples. To fulfill these requirements we apply an approach analogous to the recursive Parrat’s reflectivity method (Parrat, 1954) to calculate the refracted and reflected amplitudes at every depth within a film formed by layers, each one with different chemical contributions.
Following the definitions by Parrat (1954), we consider an electromagnetic wave propagating into a material:
| (2) |
where and are the real and imaginary part of the complex refraction index (Als-Nielsen and McMorrow, 2001; Henke et al., 1993; Chantler, 2000) .
The continuity at each interface between the media and of a film with layers gives the twin equation :
| (3) | |||||
where for each media and is a phase factor taking into account the absorption, where is the half penetration in the media . and are the total and reflected electric field amplitudes in the media . The solution of the equation 3 for the reflected amplitude can be recursively determined by
| (4) |
where and .
The reflectivity at the interface between the air (or vacuum) and the film is obtained after previous determination of at all others interfaces inside the film, considering that , as the infinitely thick substrate does not add any reflection.
The electromagnetic radiation amplitude at each depth () inside a thin film can be determined in the same way by solving the equations 3 to inform the amplitude at each layer and depth . Isolating in equation 3 and using the value , one straightforwardly obtains:
| (5) |
can be recursively determined from the previous knowledge of the elements and calculated for the total reflectivity. Consequently, the amplitude at the upper interface of layer is :
| (6) |
with incident amplitude on the film surface ().
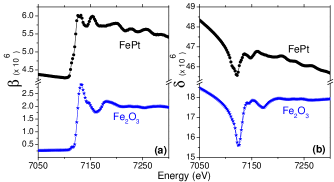
The amplitude inside the layer at an arbitrary position relative to the top of the layer is then and the radiation intensity inside this layer is . The total intensity at each depth is given by the set of considering each thicknesses and all possible . The angle and energy dependences contained in the complex terms are fully mathematicaly and computationally considered, where and are the components of the refraction index, as shown in figure 1 for FePt and compounds.
II.2 Depth dependence of XAS spectra
The electromagnetic radiation intensity described above is used to determine the depth profile of XANES experimentally obtained in the grazing incidence geometry. This is performed by fitting XANES spectra for several grazing angles around the critical angle, considering the x-ray attenuation inside the material. The result of this process is the stratification in layers (of thickness ) of the XANES information. The XANES spectra for each depth are fitted as a linear combination of reference spectral contributions previously determined. As the structure of layers inside the film can change dynamically in the fitting process, the intensity must be calculated at each self-consistent fitting iteration.
To determine the depth dependence of , it must be found a set of data that when convoluted with in the equation 1 simultaneously fits measured for several . This is more easily done rewriting the equation 1 in a discrete form considering the sum in with steps of in depth:
| (7) |
where , , and .
It is easily seen that the proportional contribution (PC) for each layer at depth for the signal is determined by . If the experimental spectra can be considered as a linear combination of several independent contributions of XANES features, can be considered as a linear combination of spectral contributions (j) each one weighed by a factor :
| (8) |
where is the normalization factor .
The objective of determining all absorption contributions () and its equivalent weight () for each depth can be achieved by fitting the experimental spectra with equation 9. Is important to note that since for each spectral contribution at each layer is included on both and of equation 7, the deconvolution of must be a self-consistent procedure in terms of . In other words, must be computed at every iteration of the fitting procedure.
III Application: depth profile in a FePt magnetic thin film
The FePt film studied here was grown by sputtering from pure targets of elemental Fe and Pt. It was deposited on MgO(100) substrate with a pre-deposited Pt fcc(100) buffer layer. The substrate temperature was kept at 500°C to ensure a good chemical order and perpendicular magnetic anisotropy (Martins et al., 2006). The composition and thickness of the film was checked by Rutherford Backscattering Spectroscopy (RBS) confirming the equiatomic ratio (51% Fe and 49% Pt) and a thickness of 103 nm for the FePt layer.
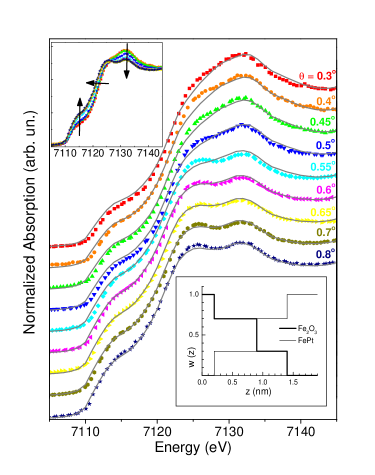
When deposited at high substrate temperature (> 400°C) FePt thin films without cap layer protection are easily oxidized materials (Na et al., 2001). The presence of a surface oxidation is clearly observed in the GI-XAS measurements at the smallest grazing angle presented on figure 2, and the oxide is identified as . The contribution of the oxide layer decreases rapidly for increasing angles, indicating that this layer is limited to a few Å. This is clearly seen by the decreasing (increasing) feature at 7133 (7115) eV and the shift of the spectra to lower energies presented in figure 2 (upper inset).
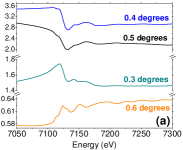
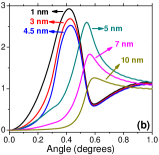
Simple tabled or calculated and components of the refraction index (Henke et al., 1993; Chantler, 2000) cannot be used to calculate , given that it would include approximations not valid when the spectral features near a critical energy (absorption edge) are the desired information. The imaginary component of the experimental refraction index was obtained for reference FePt and samples using their absorption spectra scaled to tabled absolute values far from the absorption edges (Henke et al., 1993; Chantler, 2000), as shown in figure 1a. Kramers-Kronig transforms(Ohta and Ishida, 1988; Bertie and Zhang, 1992; Peterson and Knight, 1973; Hoyt et al., 1984; King, 2002, 2006; Cross and Frenkel, 1999) were used to determine the correspondent real component (fig. 1b). Figure 3 shows the simulated intensity for a model thick FePt film with a flat 5 nm layer on its surface, using equation 6 and the refraction index data for each layer presented in figure 1. The XANES structures must definitively be taken into account when determining the experimental refraction index in order to include all energy/angle dependences in , as is ratified by the strong non-linear dependence on for different grazing angles shown in fig. 3a. The intensity at = 7130eV for representative values is shown in fig. 3b, which exemplifies multiple reflection interference effects near the critical angle for each penetration. The interference condition for the first layer (5 nm) is drastically different from the resonances for the deeper layers, where the contributions arise essentially from the FePt alloy. These simulations emphasizes the strong need to consider all dynamical reflections at the interfaces to accurately calculate .
On the other hand it is worth noting that although corrections due to fluorescence self-absorption effects might be important in some cases, these effects are not significant for the angular range and penetration depth discussed here (<1% in the final error bars).
Equation 9, considering the iteratively determined , was used to simultaneously fit the experimental XANES spectra taken at several grazing angles (fig. 2). Reference XANES spectra of and FePt were used in the fit.
The several experimental spectra simultaneously fitted, shown in figure 2, enable us to determine the complex layers structure in the depth profile, beyond a simply oxidized thickness determination. Different models of layers structure were considered for the oxidized FePt surface. Although a flat top oxide layer is well-suited to illustrate the general behavior, it is by far not the right solution to fit our data. The depth profile analysis shows clearly that the oxide not only covers the FePt film but penetrates beneath the film giving rise to a fractionated buried layer composed of the oxide and FePt. The best fit model turns out to be a gradient between a thin oxidized surface with pure layer and intermediate layers of both oxide and metal alloy down to 1.4 nm from the surface. The top 100% oxide layer is 0.2 nm thick, followed by two mixed layers with 70% and 30% of and 0.7 and 0.5 nm thick, respectively. The weight function w for each component is shown in the lower inset in figure 2.
It has been reported (Na et al., 2001) that for FePt films an Fe oxide layer would form on the surface due to Fe migration to the oxide/metal interface during the growth at high temperatures. As a result, there might be a composition variation with increasing film depth. In the metallic layer just below the oxide, Fe content should be lower than that of as-deposited film while Pt content should be higher. Our results confirm a compositional variation over the film depth, but supports a more complex picture. As known from literature, sputtered metallic films have some tendency to form pillars. We interpret the gradient as resulting from the decoration of these pillars by the oxide that fills the empty space between pillars and oxidizes the very interfacial Fe atoms, rather than a continuous rough surface.
We should finally include an additional remark about the resolution of the depth profiles. Due to the exponential decay of the radiation intensity inside the film, the depth probed and final resolution of the method are intrinsically correlated and strongly dependent to the contrast between the refraction index of each layer material in the film. For instance, in the /FePt case the refraction index of is factor three smaller than for the FePt material. In this case the profile variation is confined within 2 nm near the surface and the depth resolution is of order of one angstrom. If the compositional gradient were deeper into the film, the profile resolution would be lower for the internal layers.
IV Conclusion
Scattering and absorption phenomena are intrinsically intercorrelated when grazing incidence reflection and refraction are combined to x-ray absorption spectroscopy. The approach of GI-XAS presented in this article fully considers both scattering and absorption formalism for depth profiling the atomic, electronic, chemical or magnetic local structures in thin films with nanometric resolution. This formalism, not facing intrinsic limitations or approximations, can be applied to deconvolve the depth dependencies of not only XANES information as exemplified here, but also XRF (x-ray fluorescence) and XMCD (x-ray magnetic circular dichroism) signals in the fluorescence or reflectivity channels from thin films and multilayers.
Acknowledgements.
This work is partially supported by LNLS/ABTLuS/MCT. NMSN acknowledges the grants from CNPq and CAPES.References
- Weller and Doemer (2000) D. Weller and M. F. Doemer, Annual Review of Material Science 30, 611 (2000).
- Johnson et al. (1996) M. T. Johnson, P. J. H. Bloemen, F. J. A. den Broeder, and J. J. de Vries, Rep. Prog. Phys 59, 1409 (1996).
- Souza-Neto et al. (2006) N. M. Souza-Neto, A. Y. Ramos, H. C. N. Tolentino, A. Martins, and A. D. Santos, Appl. Phys. Lett. 89, 111910 (2006).
- Martins et al. (2006) A. Martins, M. C. A. Fantini, N. M. Souza-Neto, A. Y. Ramos, and A. D. Santos, J. Magn. Magn. Mat. 305, 152 (2006).
- Souza-Neto et al. (2009) N. M. Souza-Neto, D. Haskel, Y. C. Tseng, and G. Lapertot, Phys. Rev. Lett. (in press) arxiv/0808.0865, 1 (2009).
- Chakalian et al. (2007) J. Chakalian, et al., Science 318, 1114 (2007).
- Als-Nielsen and McMorrow (2001) J. Als-Nielsen and D. McMorrow, Elements of Modern X-ray Physics (John Wiley and Sons, 2001).
- Stragier et al. (1992) H. Stragier, et al., Phys. Rev. Lett. 69, 3064 (1992).
- Keil et al. (2005) P. Keil, D. Lutzenkirchen-Hecht, and R. Frahm, Europhysics Letters 71, 77 (2005).
- Bedzyk et al. (1989) M. J. Bedzyk, G. M. Bommarito, and J. S. Schildkraut, Phys. Rev. Lett. 62, 1376 (1989).
- deBoer (1991) D. K. G. deBoer, Phys. Rev. B 44, 498 (1991).
- Tolentino et al. (2001) H. C. N. Tolentino, et al., J. Synchrotron Rad. 8, 1040 (2001).
- Born and Wolf (1993) M. Born and E. Wolf, Principles of Optics: Electromagnetic theory of propagation, interferenceand diffraction of light (Pergamon Press, 1993).
- Henke et al. (1993) B. L. Henke, E. M. Gullikson, and J. C. Davis, Atomic Data and Nuclear Data Tables 54, 181 (1993).
- Yun and Bloch (1990) W. B. Yun and J. M. Bloch, J. Appl. Phys. 68, 1421 (1990).
- Mikulík (1997) P. Mikulík, Ph.D. thesis, Univerité Joseph Fourier - Grenoble I (1997).
- Authier (2001) A. Authier, Dynamical Theory of X-Ray Diffraction (Oxford University Press, 2001).
- Baron (1995) A. Q. R. Baron, Ph.D. thesis, Stanford University (1995).
- Stepanov et al. (1998) S. A. Stepanov, et al., Physical Review B 57, 4829 (1998).
- Lee et al. (2003) D. R. Lee, et al., Physical Review B 68, 224409 (2003).
- Parrat (1954) L. G. Parrat, Phys. Rev. 95, 359 (1954).
- Chantler (2000) C. T. Chantler, J. Phys. Chem. Ref. Data 29, 597 (2000).
- Na et al. (2001) K. Na, J. Na, H. Kim, P. Jang, and S. Lee, IEEE TRANSACTIONS ON MAGNETICS 37, 1302 (2001).
- Ohta and Ishida (1988) K. Ohta and H. Ishida, Applied Spectroscopy 42, 952 (1988).
- Bertie and Zhang (1992) J. E. Bertie and S. L. Zhang, Can. J. Chem. 70, 520 (1992).
- Peterson and Knight (1973) C. W. Peterson and B. W. Knight, Journal Of The Optical Society Of America 63, 1238 (1973).
- Hoyt et al. (1984) J. J. Hoyt, D. DeFontaine, and W. K. Warburton, Journal Of Applied Crystallography 17, 344 (1984).
- King (2002) F. W. King, J. Opt. Soc. Am. B 19, 2427 (2002).
- King (2006) F. W. King, Journal Of Physics A-Mathematical And General 39, 10427 (2006).
- Cross and Frenkel (1999) J. O. Cross and A. I. Frenkel, Rev. Sci. Instrum. 70, 38 (1999).