Size and Time Rescaling at the Paraelectric to Ferroelectric Phase Transition in BaTiO
Abstract
We describe length and time rescaling across the paraelectric to ferroelectric phase transition in BaTiO3. Small ferroelectric clusters are unable to grow in the paraelectric phase and exist for a short period of time only. The onset of the phase transition invokes a rescaling of both size and time lenghts as necessary ingredients for ferroelectricity to come into existence. The growing of ferroelectric domains involves correlated chains of Ti-O dipoles, which causes domain wall rigidity and domain shape stability. Ferroelectric nanodomains may host islands of opposite polarization (antiferroelectric defects), which appear as an intrinsic feature of the growing BaTiO3 ferroelectric material.
pacs:
77.80.-e, 02.70.Ns, 07.05.Tp, 77.84.DyFerroelectric materials are broadly employed as capacitors and memory materials. However, even for the classical compound BaTiO3 (BTO), microscopic details on the cubic paraelectric (PE) and on the ferroelectric (FE) phases and phase transformations (from cubic to tetragonal, orthorhombic and rhombohedral phases on lowering temperature) remains puzzling. A macroscopic electrical polarization reflects some amount of coherent behavior in the atomic displacements. In BaTiO3, the off-center diplacement of Ti atoms creates a net electric dipole moment. In terms of domain growth, a critical size spaldin may thus be required for the ferroelectric state to be stable with respect to the competing electrostatic energy, caused by an asymmetric charge distribution. Recently, theoretical marco and experimental fong evidence on fundamental size limits in ferroelectricity has been provided, and important insights into device scalability have been collected. Simulations stachiotti ; krakauer ; krakauer-2 and experiments ziebinska ; tai indicate the existence of dynamic polar clusters already in the paraelectric, cubic phase, as local precursors of longer range ferrodomains. This suggests a rescaling of sizes as a fundamental ingredient of ferroelectricity, rather than a size scale within a certain ferroelectric state. Rescaling was shown to play a key role in relaxor systems, recently dmowski .
In this Letter, along this line, we perform MD simulations on the phase transition (PT) from PE cubic (c) to FE tetragonal (t) in BTO (= 393 K) for understanding ferroelectric domain formation. For this, we use transition path sampling molecular dynamics (TPSMD)dellago as a means to elucidate mechanistic details of phase transitions dellago ; prl-1 ; prl-2 ; chemistry ; cdse and to extract scale and time lengths (this work).
Two main models for ferroelectricity, the displacive cochran-displ and the order-disorder model comes-od-1 ; bersunker-od-2 ; chaves-od-3 have been proposed over the years, which account for a subset of experimental facts lines . In the displacive model, the softening of TO phonon modes detected by neutron scattering harada is microscopically connected to Ti leaving the center of the oxygen octahedra at the transition onset. EXAFS, XANES ravel or X-ray diffuse scattering highlight the relevance of <111> Ti displacements already in the cubic phase. Molecular dynamics (MD) simulations stachiotti-2 indicate a crossover from displacive soft mode to order-disorder dynamics close to the transition temperature (KNbO3). The implicit time averaging stern-nmr of NMR experiments zalar leads to Ti distortion along <100>, whereby the instantaneous displacements are along <111> ravel . The interaction of off-center Ti displacements and soft modes are the main ingredients of the Grishberg and Yacoby model girshberg-yacoby , applied to BTO pirc . Shell model stachiotti and effective Hamiltonian MD krakauer point out the prevalent role of chain-like correlations, which are not disappearing above . First principles calculations conclude the off-center position of Ti in cubic BTO cohen . In a recent DFT-based approach goddard the fundamental role of antiferroelectric (AFE) coupling between Ti-O chains of opposite polarization is indicated.
The inclusion of local <111> Ti distortions, coupled to O shifts into short-ranged chains is thus a key move for explaining controversial aspects like active Raman signals in the cubic phases, x-ray absorption fine structures, phonon modes damping and diffuse scattering.
While these facts strongly support the central role of domains for ferroelectric properties, no clear picture of domain formation across the ferroelectric transition has been provided yet. Especially, the role and change of AFE and FE couplings, and the spatial outreach of chains in different ferroelectric phases remain unclear.
To address these questions, we have performed TPSMD simulations on the paraelectric to ferroelectric phase transition in BaTiO3, using the polarizable shell interatomic potential of Sepliarsky et al. sepliarsky in the anisotropic NpT ensemble dlp .
TPSMD is an iterative process and requires an initial trajectory dellago . The latter was chosen in a regime of Ti positions shifted off-center from the ideal cubic arrangement, corresponding to the displacive model. This regime is quickly abandoned in the course of simulations, and a clear tendency to grow Ti-O chains along the ct transition appeared. In the course of TPSMD a too narrow box would translate into an increased difficulty to stabilize the tetragonal configuration on chain growth. We used this intrinsic length rescaling indicated by the simulation itself to define an appropriate size of the simulation system. Successive enlargement of the box dimensions showed that a 12 unit cells system is an adequate size to study ferrodomain formation.
The distinction between cubic and tetragonal structures was ensured by an order parameter, based on monitoring cell parameter changes, and on collecting time-averaged statistics over Ti displacements (see details below).
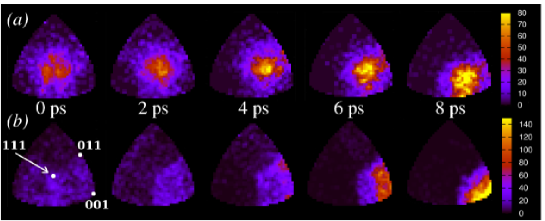
To better cover the diverse (microscopic & macroscopic) aspects of the PEFE phase transition in BTO, we present in the following a threefold analysis of the simulation results: (a) evaluation of instantaneous and time-averaged Ti-displacements (Fig. 2) with respect to <111> directions (Fig. 4), for direct comparison with EXAFS measurements (time-resolved method), (b) simulation of diffuse scattering (DS, Fig. 2) (c) elucidation of ferrodomain growth, domain morphologies and boundaries (Figs. 1 &3),
Instantaneous and time-averaged Ti displacements.
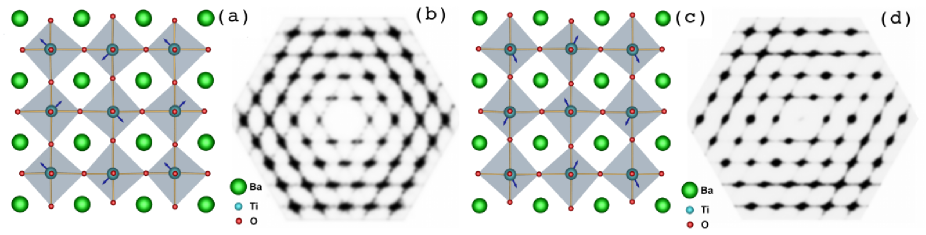
Both PE and FE BTO phases host Ti displacements, connected over oxygen into dynamic -(-Ti-O-)- chains. The Ti environment is essentially rhombohedral in the FE phase, due to the contraction of three Ti-O bonds and elongation of the remaining three (cf. Fig. 2b), a pattern which is locally present already in PE BTO. The degree of deviation of Ti displacements from the closest <111> direction amounts 12.5 ∘, in agreement with XAFS results, 11.8 1.1∘, and comparable with the 10.8∘ based on the AFE/FE model goddard . Instantaneous projections of Ti displacements indicate <111> shifts in both the PE and FE phases, whereby on time averaging they only survive in the t phase, along [001] (Fig. 4).
Diffuse scattering.
The existence of dynamic chains gives rise to the appearance of X-ray DS in the form of {100}*-type reciprocal planes intersecting {111}* plane (Fig. 3) discus . The extinction of a set of directions (Fig. 2(d)) is due to Ti shift ordering in the FE phase. The existence of locally anti-parallel arrangements of Ti shifts highlights the role of AFE coupling within both FE and PE BTO. The coexistence of FE and AFE couplings both in the FE and the PE phases carries the appearance of DS. A modified pattern due to a changed chain timescale and shift ordering in the FE phase is responsible for the extinction of a set of {010}* diffuse planes, an effect that can be suppressed upon doping Liu . The nature of DS is clearly related in PE and FE BTO. To better understand this point, especially with respect to the extent of FE and AFE couplings, we now proceed to a full domain analysis across the PT.
Chains and ferrodomain growth.
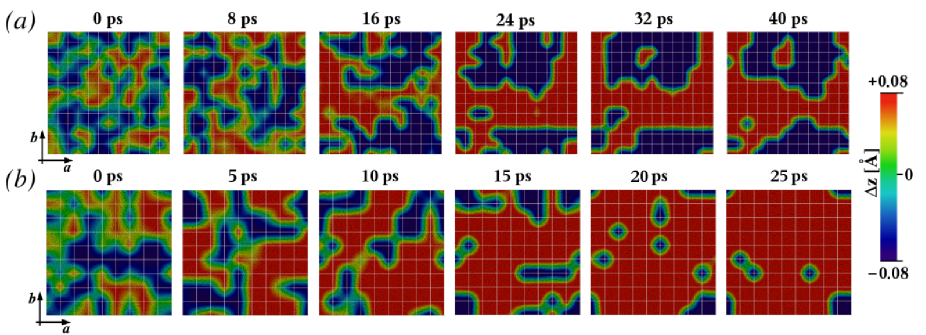
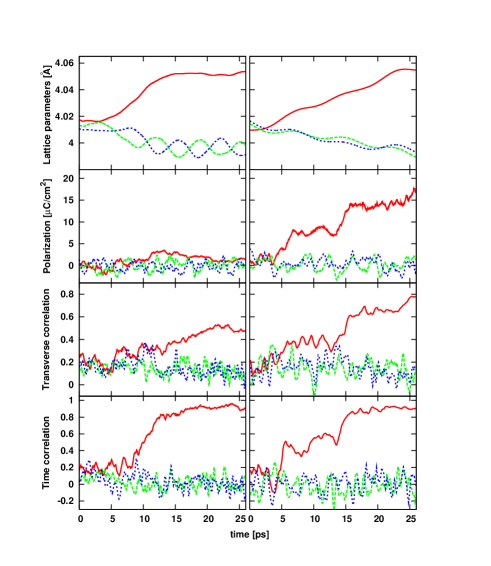
To trace the progress of phase transition during TPSMD, besides cell shape changes, we calculated transverse correlation transverse and time autocorrelation of Ti-O chain formations. We considered time-averaged Ti displacements over 200 fs. Transverse correlation is an appropriate quantity to monitor the progress of domain growth as well as FE and AFE couplings, which appear as vector field features in Fig. 1,a. Therein, different colors are associated with different Ti displacement directions () and overall domain polarization, red for upwards () and blue for downwards (). The existence of polar clusters already in the PE phase (0-8 ps) can be clearly seen, associated with AFE/FE interactions. The (fast) time scale of cluster aggregation/decomposition is less than 1 ps, for a cluster size up to 2-3 unit cells of locally rhombohedral pattern, supporting recent experiments ziebinska ; tai . However, setting in at 8 ps, a dramatic change in chain dynamics marks the onset of the transition. The dynamically correlated clusters grow larger and literally freeze into domains. The overall slow down of the process continues (20-30 ps) until a smooth landscape of 180∘ polar domains is reached (40 ps). A quantitative description of the transition in terms of order parameter changes is given in Fig. 3. Relative variation of lattice parameters amounts to =1.01, in agreement with the experimental value of 1.009 kwei-av_str . The value of spontaneous polarization (Fig. 3) due to the formation of domains is (on the average) vanishing, with a hidden tendency of the polarization component to drift. The non-zero value of the transverse correlation (Fig. 3) along all three Cartesian axes already in the PE phase is related to polar cluster formation. The increase of transverse correlation, which is a direct indicator of domain growth, surpasses the timescale of the abrupt change of dynamics in the system, the latter measured in terms of time autocorrelation (Fig. 3). The critical slowing down and regime change takes place between 8-12 ps. At the crossover the system transforms from floppy-dynamic (polar clusters) into almost static (domains). During domain formation the z component of the velocity vectors of Ti positions decouples from the other two and vanishes. In this regime, contrary to the PE phase, any further domain evolution in the FE phase requires a whole chain to flip. Clearly, there is a marked rescaling of critical lengths in going from PE to FE, already noticed above, in terms of size of polar regions, from clusters to domains, as well as with respect to range and selection of AFE couplings. A precise size rescaling of chain growth correlation lengths and a detailed representation of AFE/FE couplings in the PE and FE phases, as well as domain morphologies are the main results of this analysis. Additionally our dynamic simulations provide details on the time scale of domain formation and domain boundaries (Fig.1, green). In fact, while the PE phase is floppy and may host distant, time-decorrelated polar clusters (coarse and mobile domain boundaries), FE domain formation is a slower process, with long-ranged correlation lengths within domains and a changed chain flip response (narrow and rigid domain walls). The latter is responsible for trapping narrow AFE islands within larger domains (Fig. 1(a), 24, 32, 40 ps). This effect is characteristic of the PT, and reflects an intrinsic properties of BTO to accumulate AFE defects within FE domains. This is expected to affect the switching response of BTO.
Chains and ferrodomain growth, .
To verify this effect we have performed another set of TPSMD simulations under an external static electric field along . This was achieved by applying different initial values to the two transition branches (very large value for ct, tiny for tc), and incorporating field value reduction (ct) or enhancement (tc) into TPSMD, until an equal value was reached, 60 . As the field favorizes t BTO, a unit cells simulation box suffices here. The changes in the order parameters are represented in Fig. 3. To a shortened transition time corresponds a smoother change of the lattice parameters. The component of the polarization increases up to a value of about 17.5 , close to the experimental value of 17.0 kwei-av_str . Both transverse correlation and time autocorrelation of chain growth indicate a two step mechanism, at 5-15 ps and at 15-20 ps. The transverse correlation reveals further domain growth after 20 ps. A pure electrostrictive scenario would imply growth of one domain at the expenses of the other after 10 ps under the effect of the field. In BTO however, the tendency of placing AF chain defects within large FE domains is kept, and survive in the mature, single domain BTO after 25 ps, to the extent that the final steps are affected by AF chain dynamics only.
In conclusion, we have presented an atomistic investigation of the
paraelectric to ferroelectric phase transition in BTO.
Dynamical polar subcritical clusters,
already present in the cubic paraelectric phase,
grow into larger ferroelectric nanodomains while the Ti-O dipole dynamics is slowing down.
Like in relaxors, local polar moments hints at localized phonons. Unlike relaxors, size rescaling in BTO restores a lattice dynamics more close to perfect ordered crystals (with the rhombohedral phase as limiting case of perfect dipole order), while in relaxors only the slow down process assists the formation of mesoscopic regions with local polarization. Along this line, the size and time rescaling resulting from our TPSMD simulations may represent a general scheme for thinking about ordering phenomena in classic and relaxor ferroelectrics.
M.P. acknowledges the Polish Ministry of Education and Science (Grant # N N202 023334) and the IMPRS in Dresden
(Klaus-Tschira Foundation scholarship). ZIH Dresden is acknowledged for computational time.
References
- (1) N. A. Spaldin, Science 304, 1606 (2004).
- (2) M. Nuñez and M. Buongiorno Nardelli, Phys. Rev. Lett 101, 107603 (2008).
- (3) D. D. Fong et al., Science 304, 1650 (2004).
- (4) S. Tinte et al., Ferroelectrics 237, 345 (2000).
- (5) H. Krakauer et al., J. Phys. Cond. Mat. 11, 3779 (1999).
- (6) R. Yu and H. Krakauer, Phys. Rev. Lett. 74, 4067 (1995).
- (7) A. Ziębińska et al., J. Phys. Cond. Mat. 20, 142202 (2008).
- (8) R.Z. Tai et al., Phys. Rev. Lett. 93, 087601 (2004).
- (9) W. Dmowski et al., Phys. Rev. Lett. 100, 137602 (2008).
- (10) C. Dellago et al., Lect. Notes Phys. 703, 349 (2006).
- (11) D. Zahn and S. Leoni, Phys. Rev. Lett. 92, 250201 (2004).
- (12) S. E. Boulfelfel et al., Phys. Rev. Lett. 99, 125505 (2007).
- (13) S. Leoni, Chem. Eur. J. 13, 10022 (2007)
- (14) S. Leoni et al., Proc. Natl. Acad. Sci. 105, 19612 (2008),
- (15) W. Cochran, Phys. Rev. Lett. 3, 412 (1959).
- (16) R. Comes et al., Solid State Commun. 6, 715 (1968).
- (17) I. B. Bersuker, Phys. Lett. 20, 589 (1966).
- (18) A. S. Chaves et al., Phys. Rev. B 13, 207 (1976).
- (19) M.E. Lines, A.M. Glass, Principles and Applications of Ferroelectrics and Related Materials (Clarendon, Oxford, 1977).
- (20) J. Harada et al., Phys. Rev. B 4, 155 (1971).
- (21) B. Ravel et al., Ferroelectrics 206, 407 (1998).
- (22) M. Sepliarsky et al., Comput. Mat. Sci. 10, 51 (1998).
- (23) E.A. Stern, Phys. Rev. Lett. 93, 037601 (2004).
- (24) B. Zalar et al., Phys. Rev. Lett. 90, 037601 (2003).
- (25) Y. Girshberg and Y. Yacoby, Solid State Commun. 103, 425 (1997).
- (26) R. Pirc and R. Blinc, Phys. Rev. B 70, 134107 (2004).
- (27) R. E. Cohen, Nature 358, 136 (1992).
- (28) Q. Zhang et al., Proc. Natl. Acad. Sci. 103, 14695 (2006).
- (29) M. Sepliarsky et al., Curr. Opin. Solid State Mater. Sci. 9, 107 (2005).
- (30) W. Smith and T. J. Forester, J. Mol. Graphics 14 (1996)
- (31) Diffuse scattering was calculated with DISCUS discus-ref on averaging over 0.1 ps.
- (32) Th. Proffen and R.B. Neder, J. Appl. Cryst. 30, 171 (1997).
- (33) Y. Liu et al., Appl. Phys. Lett. 91, 152907 (2007).
- (34) The transverse correlation of the () component of displacement is calculated as: , . is the vector of Ti displacement. The indices refer to neighbor cells in the transverse directions.
- (35) G. H. Kwei et al., J. Phys. Chem. 97, 2368 (1993).