Dynamic networks and directed percolation (28 January 2009)
Abstract
We introduce a model for dynamic networks, where the links or the strengths of the links change over time. We solve the model by mapping dynamic networks to the problem of directed percolation, where the direction corresponds to the evolution of the network in time. We show that the dynamic network undergoes a percolation phase transition at a critical concentration , which decreases with the rate at which the network links are changed. The behavior near criticality is universal and independent of . We find fundamental network laws are changed. (i) For Erdős-Rényi networks we find that the size of the giant component at criticality scales with the network size for all values of , rather than as . (ii) In the presence of a broad distribution of disorder, the optimal path length between two nodes in a dynamic network scales as , compared to in a static network.
Network theory has answered many questions concerning static networks Albert ; Barabasi ; Cohen ; Pastor ; Newman but many real networks are dynamic in the sense that their links, or the strengths of their links, change with time. For example, in social networks friendships are formed and dissolved, while in communication networks, such as the Internet, the load (weight) on the links changes continually. The challenges posed by such dynamic networks are beginning to be addressed. For example, Kempe et al. have studied algorithms for broadcasting or gossiping in dynamic networks Kempe while Volz and Meyers have studied the epidemic SIR model on dynamic networks Volz .
Fundamental questions that have been extensively studied in static networks are still open for dynamic networks. Here we ask: (i) Is there a critical concentration of links for which the dynamic network undergoes a percolation phase transition, above which order of the network nodes are still connected and below which the network breaks into small clusters? (ii) If so, what is the percolation threshold for which the transition occurs, and how does it depend on the dynamics? (iii) What are the properties near criticality?
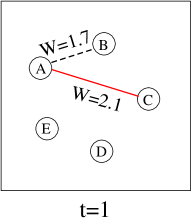
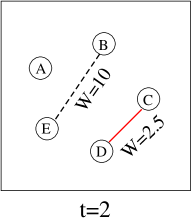
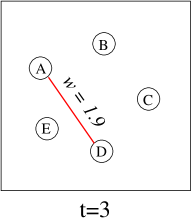
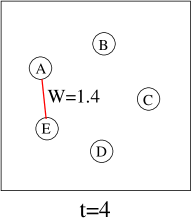
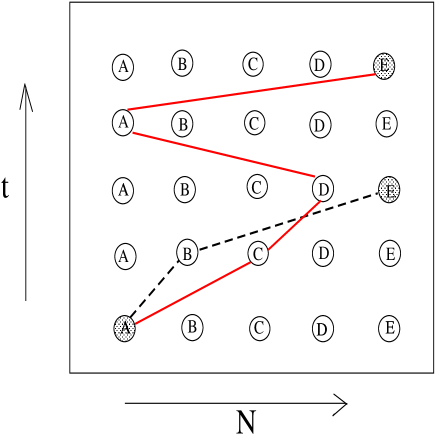
Consider an -node network with links that change over time. Each link has a lifetime drawn from a Poisson distribution, and is replaced by a new link between two randomly-selected nodes after its lifetime expires (Fig. 1). We define a unit time step as the time required for a walker to traverse one link; we also assume that when traversing the network one can only remain for a limited time at each node. Even if there is no path between nodes and at a specific time, a walker traversing the network may be able to pass from point A to point B because new links are continually appearing. Likewise, even if a path between A and B exists at a given time it may be disconnected before a walker is able to traverse it (Fig. 1).
In order to represent the time evolution of the network we add to our network representation another axis, which corresponds to a time axis. Each layer along the time dimension corresponds to a network state at some time [Fig. 2(a)]. Our new network representation includes all the information regarding the network dynamics.
We now argue that percolation on a dynamic network is equivalent to the problem of directed percolation (DP) in infinite dimensions DP ; DP2 . A percolation process can be described as an invasion of a liquid in a porous media where the flow between two neighboring pores is permitted with some probability and blocked with probability . This process undergoes a phase transition at the critical probability . For the liquid will spread throughout the media, while for the liquid will be constrained to a finite area. At exactly the liquid fills the incipient infinite cluster (called the giant component in network theory). Directed percolation (DP), a special kind of percolation, is a process in which the spread is limited to a direction that is defined to be the longitudinal axis DP ; DP2 . While non-directed percolation has been successfully applied to networks Cohen ; Callaway ; Percolation_SF ; Percolation_directed_SF and is widely used for studying network stability Cohen ; Callaway ; LPP ; Cohen-3 , the analog of DP in networks has not been previously studied.
In a dynamic network the direction has the following interpretation. The evolution of the network in time plays the role of the direction and the additional time axis presented in our model acts as an additional longitudinal (vertical) axis that is the hallmark of DP [Fig. 2(a) and Fig. 1]. The correspondence between percolation on dynamic networks and DP on regular networks allows us to apply the results known from DP at criticality to dynamic networks.
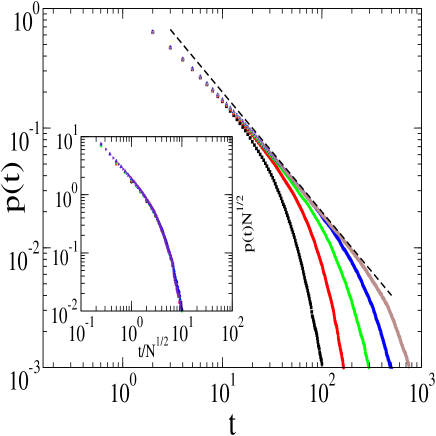
Networks can be regarded as infinite dimensional structures since no spatial constraints exist. Therefore we expect the critical properties of dynamic networks to be the same as DP in infinite dimensions. The relevant critical properties for DP are DP ; DP2 : (i) , the number of nodes reached at time , scales as ; (ii) The giant component size, scales as ; and (iii) , the survivability (the probability of reaching layer when growing a cluster), scales as . Figures 2(b) and 3(a) present simulation results confirming these scaling relations.
To learn about the size-dependent properties of dynamic networks we determine the DP properties as a function of the network size , rather than as a function of . In DP at criticality, the infinite dimensional relationship between , the width in the transverse axes, and , the length in the longitudinal axes, is . The upper critical dimension is the lowest dimension for which the system has the properties of an infinite dimensional system. For DP this value is ( corresponds to the longitudinal axis), so the relation between the system size at the upper critical dimension and the size of a dynamic network is given by (the power comes from the transverse dimensions of ). Since we conclude that:
| (1) |
Therefore for a dynamic network of size at criticality, decays exponentially after a time , with exponentialy_decays . Figure 2(b) presents simulation results for the survivability of the giant cluster in a dynamic network at criticality. The figure shows that, for different values of and , , as expected from DP in infinite dimensions. The exponential decay for can also be seen, in agreement with Eq. (1). The inset of Fig. 2(b) shows the collapse of survivability data after scaling by , supporting again Eq. (1).
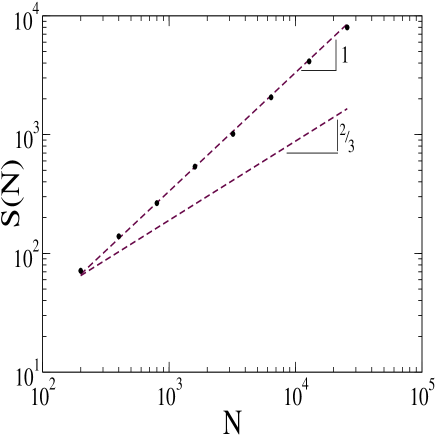
The size of the giant component as a function of is derived by substituting Eq. (1) in the DP relation .
| (2) |
Figure 3(b) presents simulation results illustrating this scaling relationship, as well as a corresponding relationship for static networks, where is known to scale as ER ; Bollobas . for static networks is also known to decay exponentially after a time . The two systems clearly have different behavior and properties at criticality, and thus belong to two different universality classes.
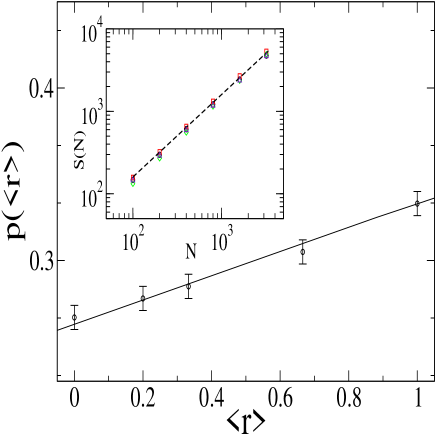
Next we show that the behavior of dynamic networks at criticality is universal and independent of the rate in which the links are changed [inset of Fig. 4(a)]. We do find, however, that the critical concentration, , for which the phase transition occurs depends on the average lifetime of the links [Fig. 4(a)]. The formula for on Erdős-Rényi dynamic networks is given by note3 :
| (3) |
where is the average rate with which the links change and is the average degree. Fig. 4(b) presents simulation results for at different values of indicating the network undergoes a phase transition at some critical value of . The inset of Fig. 4(a) shows that for several different values of at , as expected due to the universality of the critical exponent in dynamic networks. The agreement of our simulations with the formula for [Eq. (3)] is shown in Fig. 4(a).

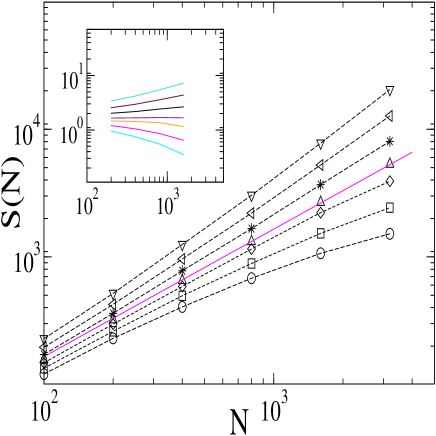
The correspondence to DP can also predict the general scaling of the optimal path in a dynamic network with a broad distribution of disorder. In a network where weights are assigned to links, the optimal path between any two nodes is defined as the path along which the sum of the weights is minimal. In the limit of a broad distribution of disorder, Ref. Braunstein has shown that, at criticality, the optimal path exists mainly along the giant cluster. Therefore for static networks the optimal path length scales with the average distance between nodes on the percolation cluster: . In our dynamic network model the average distance between nodes on the percolation cluster scales as , suggesting that in dynamic ER networks the optimal path scales as
| (4) |
Figure 5 shows simulation results for the optimal path length in a dynamic network compared to a static network. The results for dynamic networks are in full agreement with Eq. (4).

What makes the results in a dynamic network so different from the static case? The difference lies in the number of available configurations. While in static networks the percolation cluster is composed from paths built from network nodes, in dynamic networks the network is represented by nodes Note2 . The evolution of the network over time generates many more possible configurations, enabling the percolation cluster to become much larger. Substituting in the percolation cluster formula for static networks, , yields , which further confirms our results for in dynamic networks.
The explanation for the optimal path being longer in directed networks is that it can include loops. For example, an optimal path reaching some node at may find it necessary to return to that node at if at node is more optimally connected to the destination node. In a static network the optimal path does not include loops since any link connecting node at was also available at therefore any loop will only increase the total weight.
Representing a dynamic network as a directed network [Fig. 2(a)] composed of nodes allows the “same” node to be counted more then once in the percolation cluster, therefore requiring that the distinct number of nodes on the percolation cluster also scale with . To determine the number of different nodes of the original network in a component of size on the directed network, consider the following argument: The links between consecutive layers of the directed network are chosen randomly. Therefore, each link leads to a random node in the original network independently and with uniform distribution. The probability to reach a new node by following a link, assuming that nodes have already been visited, is . The expected number of distinct nodes reached after links have been followed from the starting node is therefore . This reduces to which indicates that for large
| (5) |
Thus, when the size of a component in the directed network is of order a finite fraction of the visited nodes are new and the size of the induced component on the original network is also of order .
In summary, we introduced a model for dynamic networks which was solved by a comparison with directed percolation in infinite dimensions. The DP longitudinal axis is mapped to the time axis along which the dynamic network evolves. We showed that dynamic networks exhibit different properties and critical exponents near criticality. Therefore they belong to a different universality class than static networks. While in static networks , the size of the giant component at criticality, scales as , in dynamic networks . Even though the properties of dynamic networks are universal and independent of the rate at which the links are changed, the critical concentration, , for which the phase transition occurs depends on . We also showed that the optimal path in dynamic networks scales as , compared to in static networks.
We thank the Israel Science Foundation, Yeshaya Horowitz Association and The Center for Complexity Science, EU Daphnet project, DOE and ONR for financial support, and N. Madar and R. Bartsch for discussions.
References
- (1) R. Albert and A.-L. Barabási, Rev. Mod. Phys. 74, 47 (2002).
- (2) R. Albert et al., Nature 406, 378 (2000).
- (3) R. Cohen et al., Phys. Rev. Lett. 85, 4626 (2000).
- (4) R. Pastor-Satorras and A. Vespignani Phys. Rev. Lett. 86, 3200 (2001).
- (5) M. E. J. Newman, Phys. Rev. E 66, 016128 (2002).
- (6) D. Kempe, J. Kleinberg, and A. Kumar, Proc. 32nd ACM STOC. (2000); Proc. 33rd ACM STOC. (2001).
- (7) E. Volz and L. A. Meyers, Proc. Royal Soc. B (2007); J. Royal Soc. Interface, doi:10.1098/rsif.2008.0218 (2008).
- (8) P. Erdős and A. Rényi, Publ. Math. (Debrecen), 6, 290 (1959); A. Publ. Math. Inst. Hung. Acad. Sci. 5, 1760 (1960).
- (9) B. Bollobás, Random Graphs (Academic Press, Orlando, 1985).
- (10) W. Kinzel, in Percolation Structures and Processes, edited by G. Deutscher, R. Zallen, and J. Adler (Hilger, Bristol, 1983).
- (11) H. Hinrichsen, Adv. Phys. 49, 815 (2000).
- (12) D. S. Callaway et al., Phys. Rev. Lett. 85, 5468 (2000).
- (13) R. Cohen et al., Phys. Rev. E 66, 036113 (2002).
- (14) N. Schwartz et al., Phys. Rev. E 66, 015104 (2002).
- (15) E. Lopez et al., Phys. Rev. Lett. 99, 188701 (2007).
- (16) R. Cohen et al., Phys. Rev. Lett. 86, 3682 (2001).
- (17) Reversing the relation from DP we get , implying that if we limit the distance (instead of the conventional way in DP of limiting the time ) we will obtain a cutoff in the known critical exponents after time . The equivalent for networks would be a cutoff after a crossover time (based on Eq. (1)).
- (18) For Erdős-Rényi static networks the percolation threshold is given by . Since at criticality the average number of new nodes reachable from a given node approaches 1, . However, for percolation on our dynamic network model where a node can be revisited since the links may change, there are two limits. First, for networks having links with a long average lifetime, a node reached in a percolation process is connecetd to an additional link (through which it was reached) on top of the links to which an average node is connected. Such a node has a higher effective average degree that depends on the probability , to return to a previous node. The second limit is for networks changing constantly. In this case the degree of a node reached in a percolation process is a random variable with no memory, and its effective average degree remains . Therefore, the value of in dynamic networks depends on the rate at which the links change and includes a combination of both limits. A good approximation for the probability of a node visited in a percolation process to be revisited is obtained when considering the first order contribution of more than one path to return to the original node after two steps. This leads to . The theoretical line in Fig. 4 was calculated according to this approximation.
- (19) L. A. Braunstein et al., Phys. Rev. Lett. 91, 168701 (2003).
- (20) The directed network representation of a dynamic network as shown in Fig. 2(a) includes nodes where according to Eq. (2).