Simulation of the Polarized Sky at 1.4 GHz
Abstract:
We present results from simulations of the extragalactic polarized sky at 1.4 GHz. As the basis for our polarization models, we use a semi-empirical simulation of the extragalactic total intensity (Stokes ) continuum sky developed at the University of Oxford (http://scubed.physics.ox.ac.uk) under the European SKA Design Study (SKADS) initiative, and polarization distributions derived from analysis of polarization observations. By considering a luminosity dependence for the polarization of AGN, we are able to fit the 1.4 GHz polarized source counts derived from the NVSS and the DRAO ELAIS N1 deep field survey down to approximately 1 mJy. This trend is confirmed by analysis of the polarization of a complete sample of bright AGN. We are unable to fit the additional flattening of the polarized source counts from the deepest observations of the ELAIS N1 survey, which go down to mJy. Below 1 mJy in Stokes at 1.4 GHz, starforming galaxies become an increasingly important fraction of all radio sources. We use a spiral galaxy integrated polarization model to make realistic predictions of the number of polarized sources at Jy levels in polarized flux density and hence, realistic predictions of what the next generation radio telescopes such as ASKAP, other SKA pathfinders and the SKA itself will see.
Simulation Results
We model the polarized source count data (Figure 1) using a luminosity dependence for the polarization of FRI and FRII AGN described by with W Hz-1 and W Hz-1. We use Gaussian initial fractional polarization distributions with . We set a maximum allowed of for FRI AGN and for FRII AGN. Our best fit values of the power-law index are: and . From analysis of polarized sources in the NVSS catalogue, [1] found a median fractional polarization () of 1.77% for sources with Stokes fluxes from 100–200 mJy and a of 1.46% for sources with flux greater than 200 mJy. From our model, we find and , in good agreement with the observational results from the NVSS.
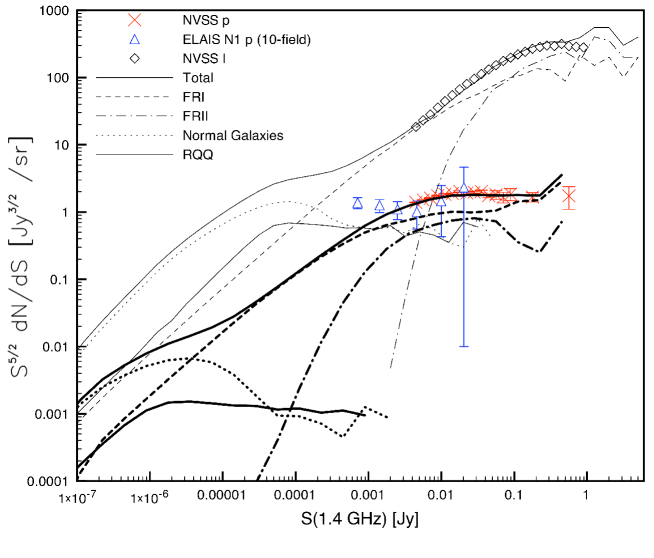
Ricci et al. (2009), in preperation, who have redshift information for a complete sample of sources brighter than 1 Jy at 5 GHz, find a correlation between and that directly supports our value of . We are able to find an equally good fit to the polarized source count data using a redshift dependancy for the polarization of FRI and FRII AGN but the data from Ricci et al. does not favour this interpretation. However, neither parameterization could provide fits to the additional flattening of the faintest polarized source counts indicating a possible sub-population of highly polarized AGN. Note that the FRI/FRII distinction, from the simulation [2], is not based on morphology but on the traditional FRI/FRII luminosity divide.
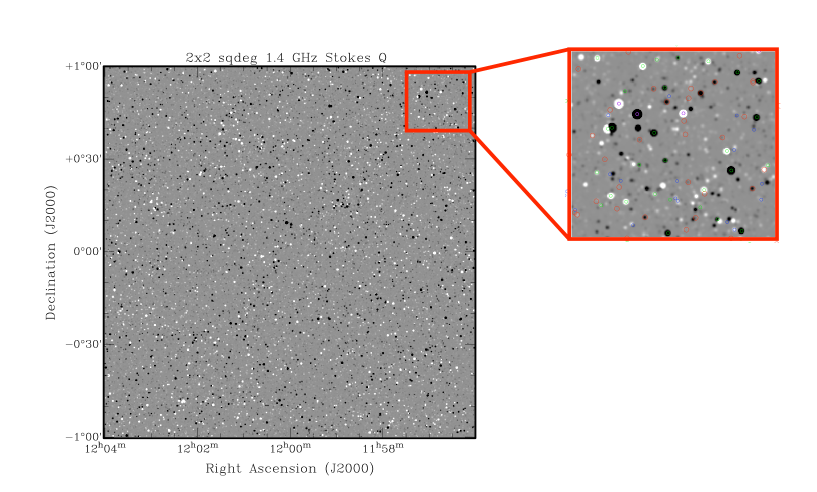
Figures 2 is a realization of a deg2 image of the polarized sky in Stokes Q with a resolution of 18 arcseconds, using the luminosity dependence model for the polarization of FRI and FRII AGN. For the normal star-forming galaxies we use the spiral galaxy model of [4] to generate distributions at multiple wavelengths. We then interpolate linearly in between the model values for each galaxy according to it’s emitted wavelength (i.e., ). Note that due to the shorter rest frame wavelength, the rise in the polarized source counts for the normal galaxies is steeper than the rise in their Stokes counts (see Figure 1). A more comprehensive presentation of these results will be included in Stil et al. (2009), in preparation.
References
- [1] Tucci, M., Martínez-González, E., Toffolatti, L., González-Nuevo, J., De Zotti, G. 2004, MNRAS, 349, 1267
- [2] Wilman, R. J., et al., 2008, MNRAS, 388, 1335
- [3] Taylor, A. R., et al., 2007, ApJ, 666, 201
- [4] Stil, J. M., Krause, M., Beck, R., Taylor, A. R., 2008, ApJ, accepted, arXiv:0810.2303