Magnetic field variations and seismicity of solar active regions
Abstract
Dynamical changes in the solar corona have proven to be very important in inducing seismic waves into the photosphere. Different mechanisms for their generation have been proposed. In this work, we explore the magnetic field forces as plausible mechanisms to generate sunquakes as proposed by Hudson, Fisher & Welsch. We present a spatial and temporal analysis of the line-of-sight magnetic field variations induced by the seismically active 2003 October 29 and 2005 January 15 solar flares and compare these results with other supporting observations.
keywords:
Sun: flares — Sun: helioseismology — Sun: oscillations — Sun: magnetic fields1 Introduction
Over time the study of the Sun has revealed the relationship between the magnetic field inside the Sun and the processes that occur in the upper layers of the solar atmosphere. Apparently, this relationship works in both directions. Recently, the influence of flares on the solar photosphere and the solar interior has been determined (Kosovichev & Zharkova, 1998; Donea & Lindsey, 2005; Donea et al., 2006; Moradi et al., 2007; Martínez-Oliveros et al., 2007; Martínez-Oliveros, Moradi & Donea, 2008). This relationship is partly seen in the seismicity of the active regions that hosted the flare. In this context, seismicity is defined as the surface manifestation of the refracted back to the surface acoustic waves induced by the flare.
Various scenarios have been proposed to explain the solar seismicity, and in particular to explain the absence of seismic activity in a majority of flares. Under these assumptions, sunquakes can be generated by different physical processes: i) Kosovichev & Zharkova (1998)argue that sunquakes are generated by chromospheric shocks resulting from the explosive ablation of the chromosphere by high-energy electrons. This shock propagates through the photosphere and into the solar interior; ii) Donea et al. (2006)suggested that the sudden heating of the low photosphere (back-radiative warming (Machado et al., 1989)) contributed to seismic emission into the solar interior; iii) the direct interaction of high-energy protons with the photosphere, observed in some flares seismically active, has also been proposed as a possible mechanism of seismic excitation (Donea & Lindsey, 2005; Zharkova & Zharkov, 2007); iv) finally, Hudson, Fisher & Welsch (2007) have recently introduced an alternative idea for the coupling of flare energy into a seismic wave, namely the “McClymont magnetic jerk” produced during the impulsive phase of acoustically active flares. The jerk is produced when the coronal loop collapses and the magnetic field lines relax, reducing the total amount of magnetic free energy in the system. This relaxation makes the field lines in the photosphere become “more horizontal”. Therefore, changes in the Lorentz force on the photosphere may excite acoustic waves into the surface and subsurface of the Sun. Based on this work and previous results from Sudol & Harvey (2005) and Hudson (2000), Hudson, Fisher & Welsch (2007) estimated the mechanical work applied to the photosphere by a sudden coronal restructuring. The energy estimates are similar to those based on our helioseismic observations (Donea & Lindsey, 2005) and suggest that the “McClymont Jerk” can account for the seismic activity of solar flares.
In this Letter we expand upon the work of Sudol & Harvey (2005) on flare-associated magnetic field changes by making temporal and spatial studies of the line-of-sight magnetic field of two very well studied active regions associated with sunquakes. We follow the steps described in Sudol & Harvey (2005), using data from the Michelson Doppler Imager (MDI) onboard the Solar and Heliospheric Observatory (SOHO), and compare these results with helioseismic holography images for the specified flares (Donea & Lindsey, 2005; Moradi et al., 2007; Martínez-Oliveros & Donea, 2008) and Global Oscillations Network Group (GONG++) Intensity continuum.
This Letter adds new results to our previous work (Martínez-Oliveros & Donea, 2008). Our aim is to determine whether there are any persistent changes in the magnetic field associated with two major flare generated seismic sources.
2 Observations and Analysis
Sunquakes, are a phenomena associated with highly impulsive and abrupt processes. So, in order to determine the influence of the variation of magnetic field (McClymont Jerk) in their generation it is necessary to correlate the different spatial and temporal properties of different signals (magnetic, acoustic, etc.). First, we created time variation plots of the magnetic field as described in Sudol & Harvey (2005), looking for changes in the line-of sight magnetic field, which could lead to a seismic response of the solar photosphere. We use for this study SOHO-MDI datasets which were remapped to a postel projection centred at the seismic source. Then, we analysed an area of pixels covering the main features of the seismic source. We employed maps of acoustic power and egression power of the seismic sources as detailed in Donea & Lindsey (2005); Moradi et al. (2007); Martínez-Oliveros & Donea (2008).
From previous investigations (Kosovichev & Zharkova, 2001; Sudol & Harvey, 2005), we know that the time variation of the magnetic field changes during flares can be represented by a first order step-like function. Following Sudol & Harvey (2005), we fitted for each individual pixel in the analysed pixels area, the temporal profile of the magnetic field with the following step-like function using a Levenberg-Marquardt least-squares minimisation algorithm,
| (1) |
where and account for the strength and the evolution of the background field, is step half-time, is the half-size of the step and is related to the slope of the step function. As we are interested in correlations between the seismicity presented by the active region and the change of the magnetic field, we restrict our analysis to those pixels for which the value of the parameter was range between minutes from the time reported by GOES as the maximum.
Then, we have generated a map with pixel-size areas where we measured step-like magnetic field variations. Accordingly to Hudson, Fisher & Welsch (2007) these areas are good candidates for the generation of sunquakes. If these changes are associated with the generation of sunquakes they should be located in regions where the excess of acoustic power is observed. We are going to apply the best-fitting method described in equation (1) to two seismic events that occurred on 2003 October 29 and 2005 January 15.
2.1 The highly seismic events of 2003 October 29 and 2005 January 15
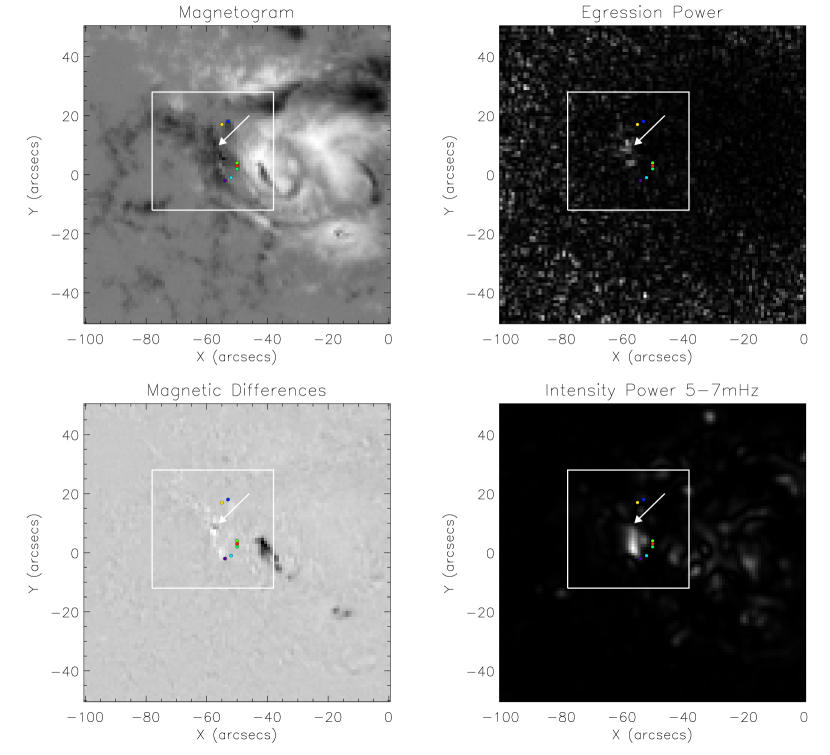
In 2003 the active region AR10486 hosted two flares with GOES soft X-ray intensities of X17 and X10 on 28 and 29 October, respectively. Donea & Lindsey (2005) studied the seismicity of these flares, detecting two sunquakes induced by these flares. The seismic region produced on 29 October was composed of a single compact source located close to the east end of the active region as identified in egression power maps obtained by the local technique named helioseismic holography (Donea, Braun, & Lindsey, 1999). The flare began at 20:41 UT, reaching maximum at 20:49 UT and finishing at 21:01 UT. The seismic source developed to its maximum around 20:43 UT as reported by Donea & Lindsey (2005). Figure 1 shows the morphology of the magnetic AR10486 in the form of a SOHO MDI magnetogram, an egression power map at 6 mHz and an intensity continuum power map. Magnetic differences during the flare are also shown clearly identifying regions where the magnetic field changed. The area of interest is shown by the white rectangle in Figure 1. In all maps one can see the localised response of the photosphere (magnetic, acoustic and white light) to the impulsive flare. Remarkably, there is strong spatial correlation between the seismic source (indicated by the arrow) and the white light power signature (Donea & Lindsey, 2005).
 |
 |
Following the studies of Sudol & Harvey (2005) we have examined the temporal profile of the magnetic field over each pixel in the area shown by the rectangle in Figure 2. Similarly, step-like changes in the magnetic field have been identified in some pixel-size areas of this active region. One MDI pixel represents about 1.4 Mm spatial resolution. Figure 1 shows the relative position of these pixels in maps of different emissions. We found that no pixel with a clear step-like behaviour of the magnetic field appears inside the detected seismic regions. This results casts doubt on whether the “McClymont magnetic jerk” can account for the seismic activity of the 2003 October 29 solar flare.
 |
 |
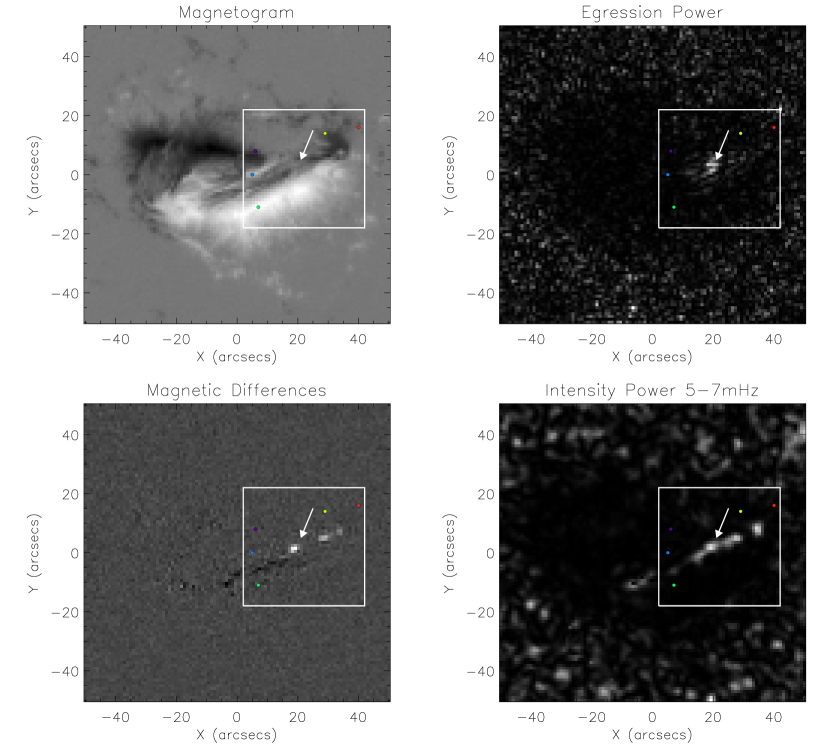
The second flare of interest, occurred on 2005 January 15 in the active region AR10720, which produced 5 more X-class solar flares. (2006) and Moradi et al. (2006a, b) reported a powerful seismic transient generated by the X1.2 flare of January 15. Properties of the seismic ripples generated by this event were later analysed by Kosovichev (2006). Moradi et al. (2007) and Martínez-Oliveros & Donea (2008) compared the seismic source morphology with other supporting observations. They emphasised the spatial coincidence between the strong compact acoustic source and signatures of hard X-ray emission, suggesting that high-energy electrons played an important role in triggering the seismic event. Also, it was shown that the acoustic emission occurred at the location of conspicuous white-light signatures, suggesting that the radiative back-warming mechanism was also relevant in transporting energy into the low photosphere.
Using the best-fitting method described in equation (1) we have searched for any abrupt and permanent changes in the magnetic field of the seismic areas of AR10720 shown by the arrow in Figure 2. We have detected few points with a significant step-like function ( G) offset from the seismic structures. A fitting parameter minutes off the flare maximum (00:43 UT) has been taken. In addition, the steepening happened in a gradual manner and it was not sudden as required for the generation of seismic waves (Donea & Lindsey, 2005).
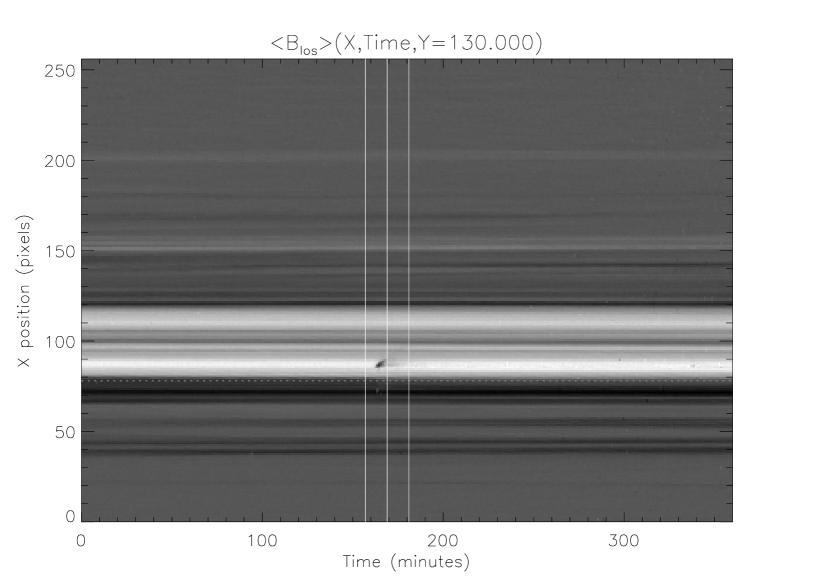
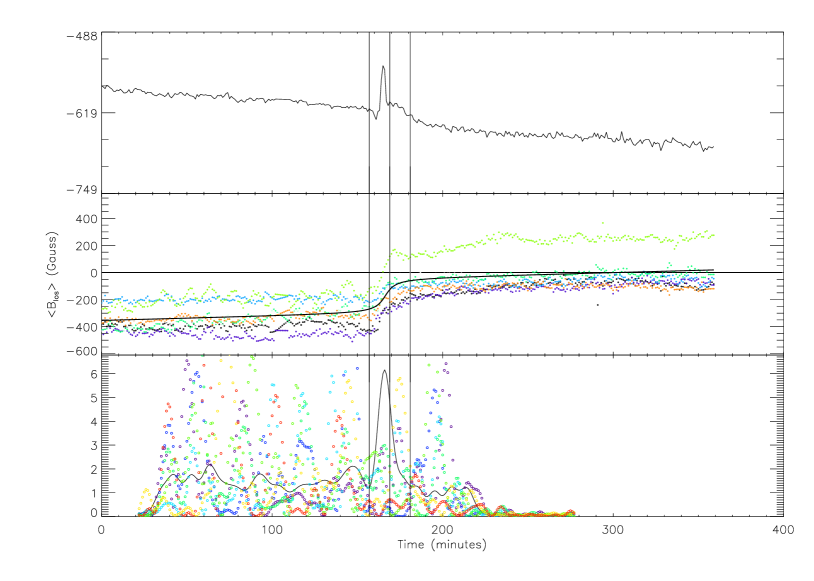
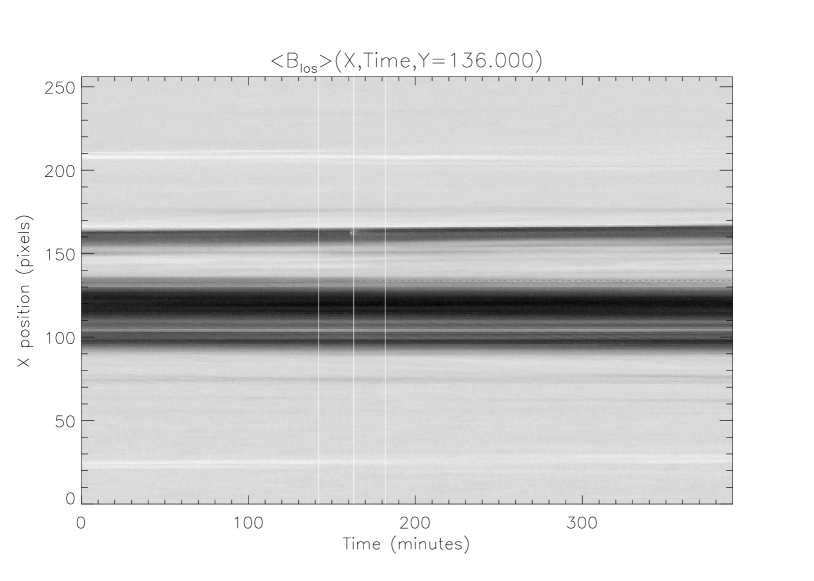
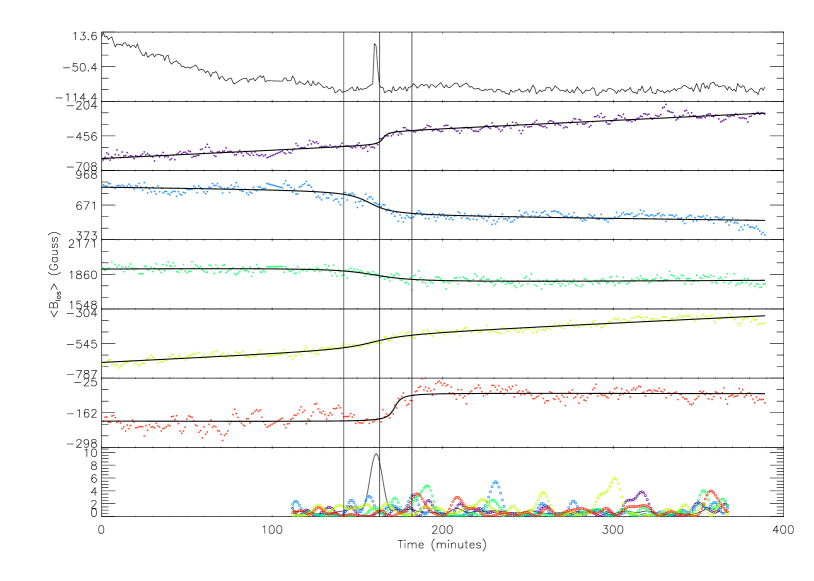
Temporal profiles of the line-of-sight (l-o-s) magnetic field of the representative points and of the highly seismic regions are shown in Figures 3 and 4. We also include the best-fit of equation (1) to the plots to illustrate the field changes. Most of the pixels in the maps showing fast changes in the magnetic field (left bottom panels in Figures 1 and 2) display transients. We also show the time variation of the egression power, which is the signature of any seismic source at the corresponding location. As the representative points are located in regions of the outer penumbra or quiet sun, the 6 mHz egression power of each pixel becomes comparable with the emission of the sunquake. This fact is clearly seen in Figure 3.
3 Discussion
In the last year, seismicity induced by solar flares of different intensities, from M6.7 to X17, has been observed (Donea & Lindsey, 2005; Donea et al., 2006; Moradi et al., 2007; Kosovichev & Zharkova, 1998; Martínez-Oliveros et al., 2007; Martínez-Oliveros, Moradi & Donea, 2008). Different mechanisms of generation for seismic waves have been proposed and it is clear that in all of them the magnetic field plays not only an important, but a decisive role. The dynamical character of the magnetic field is perhaps a principal phenomenon in all of these mechanisms. These dynamic changes are, according to Hudson, Fisher & Welsch (2007), responsible for the seismic emissions observed on the solar surface.
We analysed two seismically active solar flares, and studied the variations of the line-of-sight magnetic field looking for sudden changes in the value of the magnetic field strength. We studied the temporal and spatial properties of the pixels associated with these variations and their correlation with proxies of the seismicity, such as excess in white light emission and magnetic transients. In both cases we found a good temporal correlation between the magnetic field variations and the maximum of the GOES soft X-rays flux. However, we did not find a good spatial correspondence between the representative points and the sunquakes acoustic emission at 5–7 mHz; and what is more interesting, these pixels do not correlate spatially with the magnetic transients observed in the magnetic differences. In the case of the 2003 October 29 flare, the representative points are localised near the seismic source, similar to what Sudol & Harvey (2005) identified. The 2003 October 29 solar flare shows the desired behaviour for the McClymont jerk effect “to work”, a sudden change in the l-o-s magnetic field strength. In the case of the 2005 January 15 solar flare, the representative points are dispersed all over the analysed region, presenting no spatial correlation with the seismic sources. These results show that a substantial step-like change in the magnetic field strength cannot always be associated with a seismic source during a flare. Transient magnetic events seem to dominate the seismic areas of the 2005 January flare. They have also been detected in a number of flares, some of which were acoustically active and others of which were not (detectably). These magnetic signatures are spatially and temporally consistent with the acoustic signatures. However, we question the reliability of the magnetic signatures during and some time following a white light flare.
Another interesting aspect is related to the suddenness effect: Are the impulsive changes of the magnetic field of the order of minutes (10 minutes in the cases of the 2003 October 29 and 2005 January 15 solar flares) sudden enough to generate seismic waves via the Lorentz magnetic force?
Limited by the existing observations, we conclude that the “McClymont jerk” mechanism may still contribute, in parallel with the chromospheric shocks driven by sudden, thick-target heating of the upper and middle chromosphere (Kosovichev & Zharkova, 1998; Donea & Lindsey, 2005) and the “back-warming,” to building enough strength to trigger a seismic source.
These results also show that it is necessary a more detailed study of the magnetic field fine structures and their temporal variation is required, making use of the photospheric vector magnetograms as provided for example by Hinode. This will make it possible to study the real changes in the magnetic field configuration and structure. Eventually these kinds of studies could lead us to an understanding of the role of magnetic forces in enhancing the seismicity of flaring active regions.
Acknowledgement: The authors would like to sincerely thank Prof. Paul Cally and Dr. Charlie Lindsey for their helpful and interesting comments that helped the progress of this work.
References
- (1) Besliu-Ionescu, D., Donea, A.-C., Cally, P. S., Lindsey, C., 2006, Romanian Astron. J. Supp., 16, 203
- Donea, Braun, & Lindsey (1999) Donea, A.-C., Braun, D. C., & Lindsey, C., 1999, ApJ, 513, L143
- Donea & Lindsey (2005) Donea, A.-C., & Lindsey, C., 2005, ApJ, 630, L1168
- Donea et al. (2006) Donea, A.-C., Besliu-Ionescu, D., Cally, P. S., Lindsey, C., Zharkova, V. V., 2006, Solar Phys., 239, 113.
- Hudson (2000) Hudson, H. S., 2000, Astrophys. J., 531, L75
- Hudson, Fisher & Welsch (2007) Hudson, H. S., Fisher, G. W. & Welsch, B. J.: 2008, in Subsurface and Atmospheric Influences on Solar Activity, ASP Conference Series, R. Howe and R. Komm (eds.), 383, 221.
- Kosovichev & Zharkova (1998) Kosovichev, A. G., & Zharkova, V. V., 1998, Nature, 393, 317
- Kosovichev & Zharkova (2001) Kosovichev, A. G., & Zharkova, V. V., 2001, Astrophys. J., 550, L105
- Kosovichev (2006) Kosovichev, A. G., 2006, Solar Phys., 238, 1
- Machado et al. (1989) Machado, M. E., Emslie, A. G. and Avrett, E. H., 1989, Solar Phys. 124, 30
- Martínez-Oliveros et al. (2007) Martínez-Oliveros, J.C., Moradi, H., Besliu-Ionescu, D.,Donea A.-C, Cally, P., 2007, Solar Phys. 245, 121
- Martínez-Oliveros, Moradi & Donea (2008) Martínez-Oliveros, J.C., Moradi, H., Donea A.-C, 2008, Solar Phys. 251, 613.
- Martínez-Oliveros & Donea (2008) Martínez-Oliveros, J.C. and Donea A.-C, 2008, Mon. Not. Roy. Astron. Soc. 389, 1905.
- Moradi et al. (2007) Moradi, H., Donea, A.-C., Lindsey, C., Besliu-Ionescu, D., Cally, P. S. 2007, Mon. Not. Roy. Astron. Soc., 374, 1155
- Moradi et al. (2006a) Moradi, H., Donea, A.-C, Besliu-Ionescu, D., Cally, P.S., Lindsey, C., Leka, K., 2006, in Solar MHD Theory and Observations: A High Spatial Resolution Perspective, ASP Conference Series, J. Leibacher, R. F. Stein, and H. Uitenbroek (eds.), 354, 168
- Moradi et al. (2006b) Moradi, H., Donea, A.-C, Lindsey, C., Besliu-Ionescu, D., Cally, P.S., 2006, in SOHO 18/GONG 2006/HELAS I, Beyond the spherical Sun, ESA (SP-624), K. Fletcher (ed), Sheffield, UK, CDROM, p.66.1
- Sudol & Harvey (2005) Sudol, J.J. & Harvey, J.W., 2005, Astrophys. J., 635, 697
- Zharkova & Zharkov (2007) Zharkova V. V. & Zharkov S., 2007, Astrophys. J., 664, 573