On the origin of the scatter around the Fundamental Plane: correlations with stellar population parameters
Abstract
We present a fundamental plane (FP) analysis of 141 early-type galaxies in the Shapley supercluster at based on spectroscopy from the AAOmega spectrograph at the AAT and photometry from the WFI on the ESO/MPI 2.2m telescope. The key feature of the survey is its coverage of low-mass galaxies down to km s-1. We obtain a best-fitting FP relation in the band. The shallow exponent of is a result of the extension of our sample to low velocity dispersions. Considering the subsample of km s-1 galaxies, the FP relation is , consistent with previous studies in the high-luminosity regime. We investigate the origin of the intrinsic FP scatter, using estimates of age, metallicity and /Fe. We find that the FP residuals anti-correlate (3) with the mean stellar age in agreement with previous work. However, a stronger (4) correlation with /Fe is also found. These correlations indicate that galaxies with effective radii smaller than those predicted by the FP have stellar populations systematically older and with over-abundances larger than average, for their . Including /Fe as a fourth parameter in the FP, the total scatter decreases from 0.088 dex to 0.075 dex and the estimated intrinsic scatter decreases from 0.068 dex to 0.049 dex. Thus, variations in /Fe account for 30 of the total variance around the FP, and 50 of the estimated intrinsic variance. This result indicates that the distribution of galaxies around the FP are tightly related to the enrichment, and hence to the timescale of star-formation. Our results appear to be consistent with the merger hypothesis for the formation of ellipticals which predicts that a significant fraction of the scatter is due to variations in the importance of dissipation in forming merger remnants of a given mass.
keywords:
galaxies: abundances, galaxies: ellipticals, galaxies: formation, galaxies: fundamental parameters, galaxies: structure1 Introduction
Early-type galaxies are observed to obey a set of scaling relations that connect their photometric and kinematic properties (e.g. Kormendy relation, Kormendy 1977, Faber-Jackson relation, Faber Jackson 1976). Among these, the most notable, due to its surprising small scatter ( dex), is the relation between effective radius , mean surface brightness within the effective radius and central velocity dispersion (Djorgovski & Davis, 1987; Dressler et al., 1987). In the three-dimensional space (, , ), elliptical galaxies populate a tight plane known as the fundamental plane (FP) and usually expressed in the form:
| (1) |
If elliptical galaxies formed a homologous family, i.e. systems with density, luminosity and kinematical structures equal over the entire early-type sequence and with constant mass-to-light ratios, then the virial theorem predicts a correlation with , . However, observations show that the plane is somewhat “tilted” with respect to virial expectations, with best-fit scalings , (e.g. Jørgensen et al., 1996).
The origin of the FP tilt has been much debated and can be interpreted as the breakdown of either of the two assumptions in the virial expectation. A systematic variation in the mass-to-light ratio along the FP could be due to variations in the stellar content (age, metallicity or IMF) and/or the amount of dark matter among ellipticals. Performing detailed dynamical analyses of 25 galaxies with SAURON integral-field stellar kinematics to , Cappellari et al. (2006) find the “tilt” almost exclusively due to real M/L variations of the form , while structural and dynamical non-homologies have negligible effects. They also find the variation of the dynamical M/L ratio to correlate with the H line-strength, and ascribe most of the tilt to stellar population (age) effects. On the other hand (e.g. La Barbera et al. 2008a,Trujillo et al. 2004) other authors find that the tilt is not primarily driven by stellar populations, but instead results from other effects, such as non-homology.
Although the FP relation is quite tight, there is none the less a significant scatter around the plane that cannot be attributed to measurement errors. The origin of this intrinsic component has been investigated by many authors. Jørgensen et al. (1996) found that they were unable to reduce the scatter by introducing additional parameters, such as ellipticity or isophotal shape of the galaxies, into the FP relation. Variations in stellar populations along the sequence of early-type galaxies are found to be partially responsible for the intrinsic scatter (e.g. Gregg 1992; Guzman Lucey 1993; Guzman, Lucey, Bower 1993). Prugniel and Simien (1996) studying the correlation between the residuals from the FP and the residuals from the colour and Mg2 line-strength vs. luminosity relations, found that blue and low-Mg2 elliptical galaxies deviate systematically from the value predicted by the FP. Following this evidence Forbes et al. (1998), studying a sample of non-cluster galaxies, found that the residuals of the FP correlate with the ages of the galaxies, i.e. that the scatter of the FP is partly due to variation in galaxy age at a given mass, and in particular to variations in the time of the last starburst. On the contrary, they found that the effect of changes in metallicity is negligible. Similar results were obtained by Reda et al. (2005) analysing a sample of isolated galaxies: some objects deviate from the FP relation having lower M/L ratio and this was interpreted as due to their younger stellar populations, probably induced by recent gaseous merger. The same conclusions were reached by Wuyts et al. (2004) for two high-redshift clusters. They found that the residuals from the FP correlate with the residuals from the H - relation. This confirms the role played by stellar populations in determining the appearance of the FP, with relations appearing more dispersed for samples of galaxies that are more dispersed in age.
The existence of the FP, its small observed scatter and the tilt have presented a long standing challenge to theoretical models explaining the origin of early-type galaxies. In fact, whatever the scenario of formation and evolution of early-type galaxies is, it has to be able to explain the existence of such a tight correlation and its deviation from virial expectations and therefore to link galaxy structure and dynamics with their star-formation histories.
In the recent years, observations and simulations have broadly supported the galaxy merging scenario which fits naturally into the CDM hierarchical cosmology (e.g. Steinmetz & Navarro, 2002). In the hierarchical scenario ellipticals form through the merging of disk galaxies (Toomre & Toomre, 1972; Toomre, 1977). In the merging context, significant new insights have been made through large-scale gas dynamical simulations of galaxy mergers (Robertson et al., 2006), indicating that for lower mass galaxies, dissipation becomes increasingly important, driving nuclear starbursts that contribute larger mass fractions, and producing systematic trends with mass in both the structures and stellar populations of the remnant ellipticals (Hopkins et al., 2008). The FP tilt then arises as a direct consequence of the systematic trends with mass of the importance of dissipation during mergers. In the same scenario of galaxy formation, the origin of the intrinsic scatter in the FP arises as a combination of the scatter in the total baryon-to-dark matter content of the progenitor galaxies, and variations in the dissipational fractions at fixed stellar mass. This latter factor should be observable as correlations between the residuals from the FP and the stellar population parameters, and represents a critical test of the merger scenario (Hopkins et al., 2008), through the predicted coevolution of the stellar populations and structures of elliptical galaxies.
The increasing importance of dissipation in the formation of low-mass galaxies and the different mechanisms that drive the evolution and the star-formation histories for low- and high-mass galaxies (Haines et al. 2007) should be reflect in variations with mass of the structural and kinematical properties and hence in variations both in the shape and orientation of the FP for these two families of galaxies. It should also be noted that non-merger origins may be important for lower mass galaxies, whose evolution turns out to be primarly driven by the mass of their host halo, probably through the combined effects of tidal forces and ram-pressure stripping (Haines et al. 2007).
To date no large homogeneous sample of galaxies covering both the giant and dwarf regime exists. Although many FP datasets for systems as different as BCGs, normal Es, dEs, dSphs have been analysed and compared to look for changes in (Zaritsky et al., 2006), these studies suffer from the non-homogenity of the samples both in terms of differences in measuring the quantities entering the FP (for example different fits to derive structural parameters, different apertures to measure the velocity dispersion) as well as the selection of galaxies themselves. The form of the FP obtained can be influenced by all of these criteria.
In this paper we present a FP analysis of 141 early-type galaxies from the Shapley supercluster () with both new -band surface photometry measurements and published velocity dispersion measurements from Smith et al. (2007). The sample is randomly selected down to and represents the largest homogeneous sample of low-mass early-type galaxies with reliable velocity dispersions down to km s-1. In Section 2, we present the photometric and spectroscopic data (including velocity dispersion measurements and spectral indices) and the catalogue of “newly derived” structural parameters; the morphological classification is described in Section 3. Our FP fits for the overall and high- ( km s-1) samples are presented in Section 4, which discusses how the selection criteria can affect the values of the FP coefficients and mimic a possible curvature of the plane. In Section 5 we quantify the contribution of stellar population to the intrinsic scatter. We discuss our results in Section 6 and give a summary in Section 7. The origin of the tilt of the FP will be investigated in a forthcoming paper.
Throughout this paper we use H km s-1 Mpc-1, and . With this cosmology 1 arcsec kpc at and the distance modulus is 36.69.
2 The data
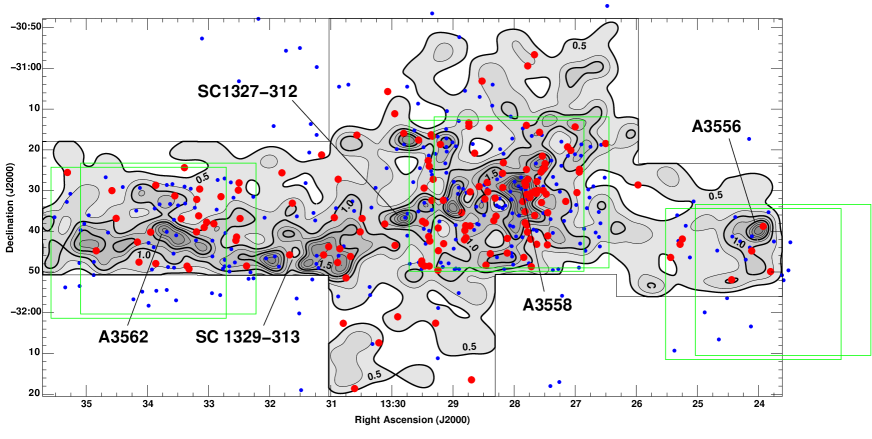
The sample of galaxies used in this work consists of 141 early-type galaxies (red points in Figure 1) distributed throughout entire Shapley Optical Survey (SOS, Mercurio et al. 2006) area, but mainly located in high-density regions (i.e. cluster cores). The sample selection is summarized in Table 1. In the region covered by SOS there are 378 confirmed supercluster members. Here we analyse the sample of 141 galaxies which have all the following characteristics: (i) an early-type morphology (see Section 3), (ii) reliable surface photometry, (iii) a measured velocity dispersion and (iv) an insignificant H emission (EW(HÅ).
2.1 Spectroscopic data
Spectra were obtained using the AAOmega fibre-fed spectrograph at the Anglo-Australian Telescope. A full description is given by Smith, Lucey & Hudson (2007, hereafter SLH); we summarize some key points here. The spectroscopic sample limit is in the cluster cores, with galaxies selected from the NOAO Fundamental Plane Survey (NFPS; Smith et al., 2004) images (green boxes in Figure 1). Outside of these regions, brighter galaxies were selected from the 2MASS Extended Source Catalogue (). The fibre diameter of 2 arcsec corresponds to 1.9 kpc. Long integrations resulted in high signal-to-noise ratios, S/N45 per Å for km s-1 and S/N90 per Å for km s-1. Velocity dispersions were measured with respect to the best-matching simple stellar population (SSP) templates. The errors were estimated from Monte Carlo simulations, and are dex at km s-1 and dex for km s-1. The spectral resolution of 3.2 Å (82 km s-1 instrumental dispersion) allows the recovery of velocity dispersions as low as 40 km s-1. However, some galaxies in the sample remain kinematically unresolved, i.e. have velocity dispersions consistent with zero. When comparing the new velocity dispersion measurements with those previously obtained from the NFPS (having a factor lower S/N), SLH find the new velocity dispersions of low- objects to be systematically lower by dex, which they attribute to a combination of higher signal-to-noise and the use of a range of SSP templates rather than individual K-giant stars. The absorption index data are tabulated by SLH. Here we also make use of single-burst equivalent ages, metallicities (Z/H) and abundance ratios (/Fe) estimated using the models of Thomas, Maraston Bender (2003). Details of this process, and the stellar population parameters for each galaxy are provided by Smith, Lucey Hudson (2009). The resulting scaling relations between the three stellar population parameters and velocity dispersion are:
| (2) |
Typical errors for galaxies with in the range 50–100 km s-1 are 14 in age, 0.05 dex in [Z/H] and 0.04 dex in /Fe, while they reduce to half these values for galaxies with km s-1.
In this work we refer to velocity dispersions measured into an aperture of re/8. We have corrected our velocity dispersions (ap) acquired with fibres of 1 arcsec radius (rap) to the apertures of re/8 following Jørgensen et al. (1995):
| (3) |
Hereafter, we adopt the notation 0 = for the velocity dispersion corrected to this fiducial aperture.
Starting from the sample of galaxies observed by SLH we select those 396 galaxies belonging spectroscopically to the Shapley supercluster (, blue and red points in Figure 1).
2.2 Imaging data
For photometry we refer to the SOS survey (Mercurio et al., 2006; Haines et al., 2006). The SOS is based on data acquired with the WFI camera (4 2 mosaic of 2k 4k CCDs with a pixel scale of 0.238′′ pixels) mounted on the ESO/MPI 2.2-m telescope at la Silla observatory. -band imaging was acquired in good seeing conditions ( arcsec) for eight contiguous fields covering a region of 2 deg2 centred on the Shapley supercluster core (see Figure 1). Five exposures were obtained for each field giving a total exposure time of 1200 s for the mosaic images (240 s 5). The reduction was carried out with the ALAMBIC pipeline (version 1.0, Vandame 2004) and the catalogue was produced with the SExtractor package (Bertin & Arnouts, 1996), plus a set of procedures designed to remove spurious detections (bad pixels, cosmic rays, etc) and correct the photometry for blended sources. The survey is complete to (). For more details see Mercurio et al. (2006). SOS photometry is available for 378 supercluster galaxies observed by SLH, all of which are detected at signal-to-noise levels greater than 100 in each exposure, such that reliable structural parameters can be derived.
2.3 Structural parameters
Structural parameters were derived using the software 2DPHOT described by La Barbera et al. (2008b). This is an automated tool measuring both integrated and surface photometry of galaxies and is furnished with several tasks to carry out reliable star-galaxy separation, PSF modelling and estimation of catalogue completeness. The main steps of the 2DPHOT algorithm are: i) creation of a clean catalogue of the input image with SExtractor; ii) estimation of the FWHM and the definition of “sure stars”; iii) construction of an accurate PSF model taking into account both possible spatial variations as well as deviation of stellar isophotes from circularity; iv) derivation of structural parameters (effective radius , mean surface brightness , Sersic index , total magnitude mtot, etc.) by fitting galaxy images with 2D PSF-convolved Sersic models, as well as the measure of the fit accuracy ().
The measurement of structural parameters is strictly dependent both on the PSF model and on the signal-to-noise ratio. Since the mosaic SOS images are obtained by stacking jittered images to cover the gap regions between the eight CCDs, the signal-to-noise ratio is not constant among the images being lower in the overlapping gap area. Moreover, in the gap area the PSF turns out to be poorly defined due to its spatial variations. We removed the galaxies in these regions from our sample and performed the surface photometry only for galaxies in highest S/N regions (224 galaxies), where the PSF is well defined. We correct our mean surface brightnesses for cosmological dimming (= 0.208 mag/arcsec2), galactic extinction (= 0.147 mag, Schlegel et al. 1998) and k-correction ( = 0.05, Poggianti 1997) and convert from mag arcsec-2 to log expressed in physical units pc-2 through log(206265 pc/10 pc)) where MR⊙=4.42 is the solar absolute magnitude (Binney Merrifield 1998).
2.4 Measuring the uncertainties in effective radius and mean surface brightness
To derive the errors, we measure the structural parameters on the five single exposures (, with ), assuming that the observed spread of their values is directly related to the S/N on the final mosaic used to derive the structural parameters entering the FP.
Due to the size of the sample (five exposures) only two scale estimators can be considered reliable (Beers et al., 1990): the classical standard deviation and the that obtained by the gapper algorithm . The gapper is a robust scale indicator (Wainer & Thissen, 1976) based on the gaps between ordered statistics which has a high level of efficiency for samples as small as five objects. If we have measures of a quantity x ranked in increasing order (x1,x2,…xn-1,xn), according to the gapper algorithm we can measure a robust scale indicator as:
| (4) |
where
| (5) |
To avoid an overestimation of the errors due to the presence of outliers, we first compute the of the and distributions and reject all values that deviate more than 3 from the median value, before subsequently computing the classical standard deviation as well as the covariance matrices of the clipped sample for both variables (, , cov[]).
The errors on the mosaic value of and ( and respectively) are given by and , where is the number of measures available. The typical errors on the logarithms of effective radius () and mean surface brightness () are 0.03 and 0.04, respectively. These errors explicitly include the effects of noise in the galaxy, but not the presence of neighbouring objects. We have estimated the effect of the latter, by repeatedly placing copies of the galaxies one-by-one at random positions across the same CCD image (where the PSF should remain constant) and reapplying 2DPHOT, finding the variations in the structural parameters to be consistent with the previously obtained errors, albeit with a small number (%) of outliers when the galaxy is placed very close to a bright star or galaxy.
3 Morphological classification
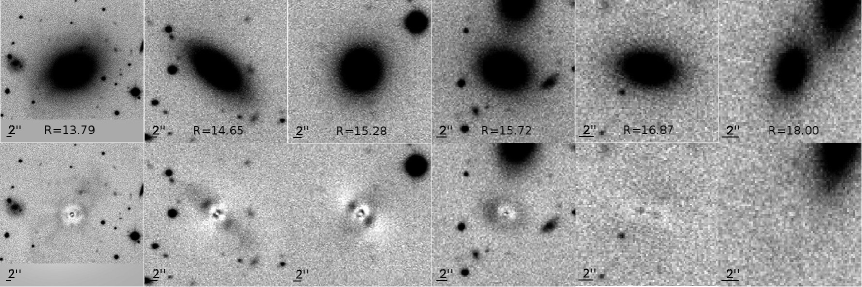
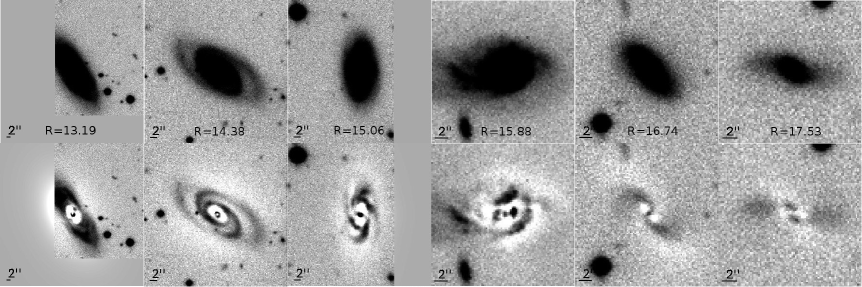
We have morphologically classified the 224 galaxies with available surface photometry, by inspection of the residual maps provided by 2DPHOT. We denote as “late-type” all galaxies showing signs of spiral arms or asymmetric disturbance, and as “early-type” all those with no such structures. The resolution of SOS images does not allow any finer classification, for example into elliptical and lenticular galaxies, since the presence of a residual disk can be seen only in particular cases, i.e. when it is very bright, widespread or edge-on. In Figure 2 we show some illustrative examples of galaxies classified as early- and late-types, covering the full range of magnitudes studied here. We have checked this classification by comparing our results with those of Thomas & Katgert (2006) for a subsample of 54 galaxies belonging to A3558 and A3562, finding perfect agreement. In their classification galaxies were subdivided into E, S0, Se and Sl classes (the latter being early and late spirals). Our early-type sample contain only galaxies classified as E and S0 by Thomas & Katgert (2006).
The strong correlation between the Sersic index and luminosity (Young & Currie, 1994; Caon et al., 1993) prevents any morphological classification based on Sersic index alone. Graham & Guzmán (2003) show that the values of Sersic index of dE, ordinary E/S0 galaxies and BCGs follow a trend from to , whereby brighter galaxies have larger values of . In Figure 3 we demonstrate the equivalent trend for our galaxy sample,

plotting the Sersic index distribution as function of morphological type and magnitude. The median value of for early-type (filled circles) and late-type (open circles) galaxies are shown for each magnitude bin (chosen to contain the same number of galaxies), while the “error bars” indicate the inter-quartile values. As pointed out by Graham & Guzmán (2003) the distribution of for early-type galaxies is shifted towards higher values with increasing luminosity. Late-type galaxies have lower values of at all magnitudes, but there is not a clean a priori separation between the two morphological classes.
The morphological classification results in a sample of 141 early-type galaxies and 44 late-type or irregular galaxies, while 31 galaxies are removed from the sample since they are not kinematically resolved, and 8 are removed as having significant H emission (EW(HÅ). We summarize the characteristics of the sample in Table 1, while in Table 2 we report structural and kinematical parameters with the corresponding errors for the 141 galaxies used in the following section.
| Sample selection | |
|---|---|
| Galaxies with spectra | 565 |
| Cluster members () | 396 |
| Cluster members in SOS region | 378 |
| Cluster members in SOS region with surface photometry | 224 |
| Galaxy classification | |
| early-type | 141 |
| late-type | 44 |
| unresolved kinematically | 31 |
| with EW(H | 8 |
| ID | RA(J2000) | Dec(J2000) | Rtot | ||||||||
|---|---|---|---|---|---|---|---|---|---|---|---|
| (km/s) | (kpc) | pc-2 | |||||||||
| TMASSJ13274662-3059237 | 13:27:46.6 | -30:59:24 | 15.166 | 2.201 | 0.010 | 0.904 | 0.042 | 1.766 | 0.070 | 10.708 | 1.25 |
| NFPJ132828.6-313205 | 13:28:28.6 | -31:32:04 | 15.404 | 2.112 | 0.012 | 0.308 | 0.002 | 2.861 | 0.004 | 1.589 | 6.43 |
| NFPJ132738.0-313041 | 13:27:38.0 | -31:30:41 | 16.549 | 2.044 | 0.016 | 0.038 | 0.004 | 2.943 | 0.008 | 2.283 | 1.31 |
| NFPJ133408.2-314735 | 13:34:08.1 | -31:47:34 | 16.083 | 1.757 | 0.097 | 0.682 | 0.044 | 1.842 | 0.059 | 3.518 | 2.03 |
| TMASSJ13295423-3201001 | 13:29:54.2 | -32:00:59 | 15.229 | 2.153 | 0.010 | 0.475 | 0.005 | 2.597 | 0.007 | 4.617 | 1.17 |
| NFPJ132656.0-312528 | 13:26:56.0 | -31:25:27 | 14.813 | 2.031 | 0.007 | 0.797 | 0.007 | 2.118 | 0.011 | 5.452 | 1.99 |
| TMASSJ13294834-3115580 | 13:29:48.3 | -31:15:58 | 14.075 | 2.296 | 0.004 | 0.984 | 0.023 | 2.043 | 0.035 | 6.945 | 1.15 |
| NFPJ132810.5-312310 | 13:28:10.5 | -31:23:09 | 13.868 | 2.267 | 0.004 | 1.108 | 0.043 | 1.875 | 0.067 | 7.796 | 1.48 |
| NFPJ132426.5-315153 | 13:24:26.5 | -31:51:53 | 14.857 | 2.302 | 0.006 | 0.506 | 0.036 | 2.685 | 0.051 | 8.414 | 1.38 |
| NFPJ132923.8-314832 | 13:29:23.2 | -31:48:32 | 15.060 | 1.718 | 0.062 | 0.972 | 0.046 | 1.673 | 0.073 | 9.545 | 1.77 |
4 The fundamental plane of R18 Shapley galaxies
For the FP we use the representation of Equation 1 where is the effective radius measured in kpc, is the central velocity dispersion corrected to an aperture of radius re/8 in km s-1 (see Section 2.1) and is the mean surface brightness within expressed in pc-2. To derive the value of , and we adopted the orthogonal fit which minimizes the quantity:
| (6) |
i.e. the sum of the absolute residuals perpendicular to the plane. This is less sensitive to outliers than the classic least-squares method (Jørgensen, Franx & Kjægaard, 1996, hereafter JFK96). For the full sample of 141 galaxies we found:
| (7) |
where the errors on coefficient are computed via a bootstrap procedure. The above relation presents a scatter of 0.088 dex in the log re direction. We estimate the intrinsic contribution to the scatter by subtracting in quadrature from the rms scatter, the observational errors on each variable taking into account the correlation between the errors on the effective radius and surface brightness. We obtain an intrinsic scatter = 0.068. When deriving the the errors on distance estimated through the standard deviation of the redshift distribution are also considered.
To take into account the different uncertainties on , , along the plane, a weighted fit is adopted. Following Cappellari et al. (2006) we add in quadrature to the measurement errors the intrinsic scatter orthogonal to the FP, . The fitting function to be minimized is:
| (8) |
where the sum is extended over all sample galaxies and where
| (9) |
The intrinsic scatter, , is adjusted to give the expected value of 0.8 per degree of freedom (the mean absolute value of a standardised gaussian distribution is 0.8). The resulting equation for the FP is:
| (10) |

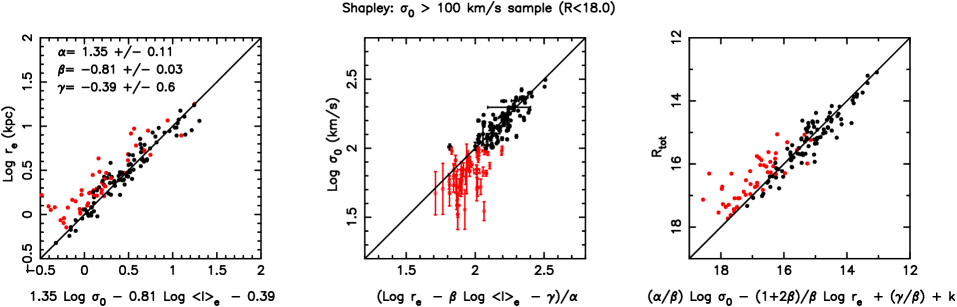
The orthogonal and weighted fits are consistent, demonstrating that the results are robust to the effects of the larger uncertainties (0.01 dex for km s-1 and 0.05 for km s-1) for the lowest mass galaxies. The scatter in the log re direction is now equal to 0.092, while its intrinsic component is 0.070. Figure 4 shows the two edge-on FP views (left and central panels) and its trend along the direction of luminosity (right panel).
The value of the coefficient obtained for the Shapley sample, is significantly lower than the typical values of 1.2–1.3 reported for samples dominated by giant galaxies (e.g. JFK96). If we restrict our sample to galaxies with 100 km s-1 (high- sample, 91 galaxies) we obtain the FP relation:
| (11) |
with the overall scatter in reduced to 0.090. In Figure 5 we plot the FP as fitted for the high- sample (black points). Galaxies with km s-1 are also reported for comparison (red dots). The value of the high- sample is closer to those of other authors. The lower value found for the total sample is thus probably due to the extension of our sample to very low mass galaxies, down to 50 km s-1. The improved method used to obtain the velocity dispersions, as well as the high signal-to-noise levels of the spectra, can produce systematic effects on the resultant values of , particularly for low- objects. SLH find that velocity dispersions obtained using single, old, solar-metallicity models instead of templates with different metallicities (as used in this paper) are overestimated by % for km s-1 galaxies and by % for km s-1. As a result, in our sample the low- values are systematically lower than those of previous samples (e.g. NFPS sample), causing an increase of the FP tilt of about 10–15. The impact of the low- limits is explored further in Section 4.2. We notice that results presented in Section 5 and discussed in Section 6 has been checked to be independent of cuts.
4.1 Comparison with Coma
Besides the range of velocity dispersions, the determination of the three FP coefficients is strictly dependent on other factors such as the selection criteria of the sample, the fit algorithm and the procedure used to derive structural and kinematical parameters (Kelson et al., 2000). We address this problem comparing our FP with the previous work by JFK96. Their sample consists of 81 early-type galaxies down to Gunn in the central region of Coma cluster. For this section, we have corrected our velocity dispersions to their standard fixed aperture of 0.595 kpc of radius. To analyse the consistency of the two samples, in Figure 6
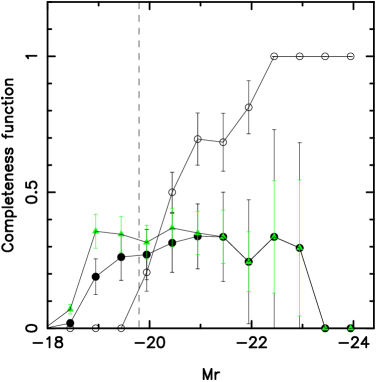
we plot the spectroscopic completeness functions (CFs) of the Coma (open circles) and Shapley (filled circles) FP samples as a function of magnitude. The magnitudes of the Shapley galaxies are converted from to the Gunn- photometric system according to the typical colour of for elliptical galaxies (Fukugita et al., 1995). The Coma CF is computed using the JFK96 FP sample and the complete photometric catalogue of early-type Coma galaxies published by Jørgensen & Franx (1994). The limiting magnitude of the Coma sample is M (dashed line). The Coma sample is complete at bright magnitudes, but the completeness declines rapidly towards zero at the faint magnitude limit. In contrast, about 30% of Shapley galaxies are spectroscopically observed and have available velocity dispersion measurements independent of magnitude down to M. In the magnitude bins fainter than M, the Shapley CF declines gently due to an increasing fraction of galaxies with surface brightnesses and velocity dispersions too low for successful measurements, before dropping rapidly in the faintest bin. Green triangles represent the CF of Shapley galaxies observed spectroscopically with no regards to successful velocity dispersion measurements: the decline at faintest magnitude has now disappeared except for the faintest bin (M). The distribution reflects well the random selection criteria of our spectroscopic survey for galaxies. To compare the FPs of the two samples we have selected from Shapley only early-type galaxies with M and km s-1 (hereafter “matched” sample) corresponding roughly to the limits of the Coma FP sample. This new sample consists of 88 galaxies. The FP of the “matched” sample is:
| (12) |
with a scatter equal to 0.08 dex in log re direction. In Figure 7

we plot the edge-on view of the FP for the “matched” sample (filled circles). Coma galaxies (open circles) are reported for comparison. Since in JFK96 the value of H0 is set equal to 50 km s-1 Mpc-1, the effective radii of Coma galaxies have been shifted by a factor –0.146 dex. Both the distributions and the dispersions of the two samples are consistent, in fact the FP for Coma sample, as found by JFK96 is:
| (13) |
The possible reasons for the remaining slight differences between the two FPs could be the different sampling at the brightest magnitudes of the two datasets, and the different procedures used to obtain the structural parameters, since JFK96 fit their early-type galaxies with de Vaucouleurs profiles.
4.2 A curved surface or a selection effect?
Observing the high- fit (see Figure 5) it is notable that all galaxies with velocity dispersions less than 100 km s-1 (low-mass galaxies) are systematically displaced above (left panel) or below (central panel) the best-fit plane as defined by the high- sample. In particular, the log edge-on view suggests that low-mass galaxies do not follow the same relation as massive galaxies. Thus, at face value, the FP appears curved, as suggested also by other studies (JFK96, Zaritsky et al. 2006, D’Onofrio 2008, Nigoche-Nietro 2008) investigating the curvature of the FP as a function of mass and/or luminosity. Studying a sample of 69 faint early-type galaxies in the core of Coma cluster, Matković & Guzmán (2005) find a similar behaviour for the relation, with dwarf galaxies having a trend () shallower than that observed for elliptical giant systems () .
In Figure 8, we investigate this possible curvature by analysing the dependence of as a function of different low- limits.

We cut the galaxy sample at various values of and estimate the FP coefficients through the weighted orthogonal fit procedure. One can see that increases systematically as the cut moves to higher values, removing more galaxies from the sample. The values of for the whole sample (=1.060.06) and for the highest- cuts (=1.720.28) differ by more than twice the standard errors, indicating a possible curvature of FP. To investigate if these observed variations of with the sample selection are due to a real curvature of the FP, or induced by selection effects, a set of simulations were performed. We constructed 1000 mock catalogues using the observed values of log and log and the value of log assigned using the relation:
| (14) |
where, in this case, = 0.92, = –0.78, and = 0.496 are the coefficients obtained by fitting the FP of the overall Shapley sample with log as the dependent variable, = 0.099 is the observed scatter in the log direction, and N(0,) is a Gaussian random variable with zero mean and standard deviation of . For each mock catalogue we evaluate the relative change in () between the orthogonal fits obtained for the whole sample and after applying a cut at km s-1. The resulting histogram of values is shown in Figure 9,

where the dashed line indicates the computed directly for the Shapley sample. This shows that the observed change in is fully consistent with that expected for a linear relation. Moreover, in Figure 10

we compare the FP edge-on projection (Eq. 11) for the observed high- sample (solid symbols) and a simulated sample obeying the overall Shapley FP relation (open symbols). The two samples show similar behaviour, with the same apparent curvature such that galaxies with low velocity dispersions are placed systematically below the FP relation. Given that the simulated sample is defined to follow a linear relation, this suggests that the apparent curvature in Figure 5 can be explained solely by selection biases. Hence, in spite of the wide-range in velocity dispersions covered by our sample, this is not sufficient to distinguish between either a linear or curved FP relation, but there is no convincing evidence for the latter in our data.
5 FP residuals and stellar populations
We find that for the Shapley FP, the contribution of the intrinsic scatter (0.070) to the total scatter (0.092) is larger than that of the measurement errors (0.060). Taking advantage of the wide variety of indices derived by SLH we investigate the possible origin of the intrinsic scatter of the FP analysing the correlations between both spectral indices (Mgb, Fe5015, Fe4383, H, HgF, HdF) and stellar population parameters (age, metallicity, -enhancement) and the residuals from the FP.
5.1 FP residuals vs. single spectral indices
All of the many spectral indices are known to correlate with , which, if not corrected for, could produce spurious correlations with the FP residuals. To avoid this problem, rather than use the spectral indices themselves, we consider their residuals with respect to the index-log relation. For each index, we fitted first the index-log relation, shown in Figures 11 and 12 (bottom panels) for metallicity- and age- sensitive indices respectively, and then determine the residuals with respect to that relation (middle panels). In the figures, the upper panels show the index-log residuals versus the residuals from the FP in the log re direction. For each relation, we quantify the product-moment correlations between the residuals and spectral index through the correlation factor and the bisector least-squares fit, assuming that the distributions are both Gaussian. Uncertainties in and the fits are estimated through 10000 Monte Carlo realizations, taking into account the errors on each value. These values together with the probability that two quantities with correlation factor are not correlated are reported in Figures 11 and 12.
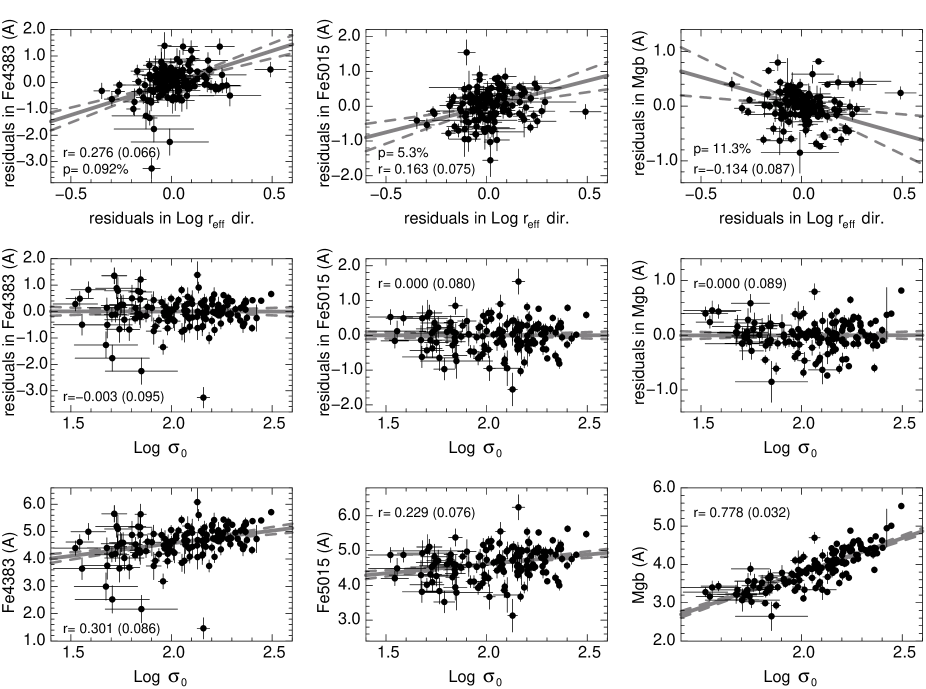
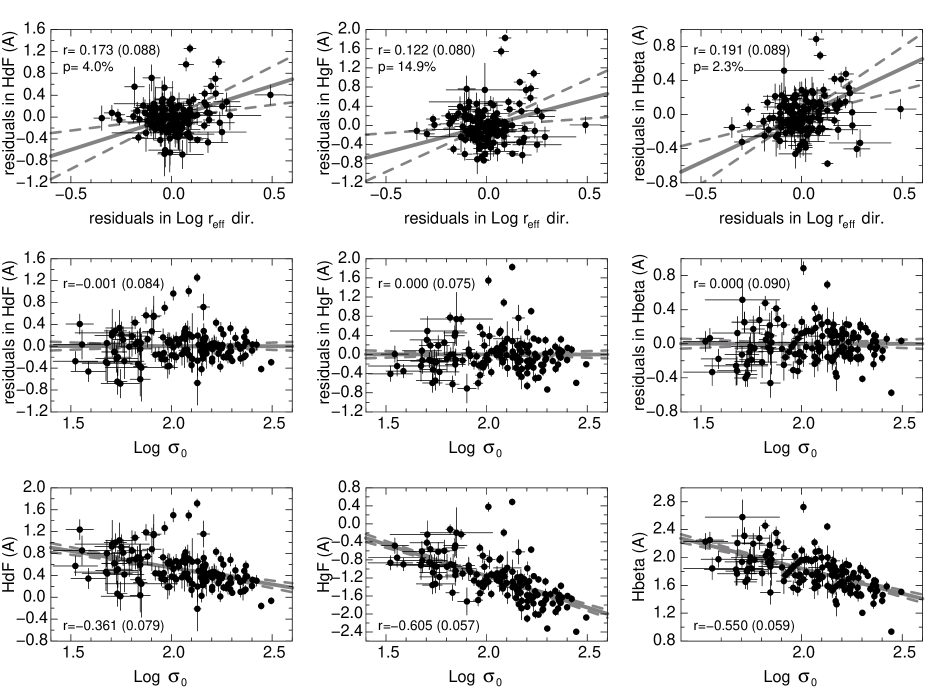
Among the primarily metal-sensitive indices (Figure 11), the strongest dependence is found for Fe4383, which is correlated with FP residuals at the 4 level. A similar but weaker correlation is obtained for Fe5015. For Mgb, however, a weak correlation is obtained in the opposite sense. Thus galaxies which are more compact than expected from the FP have lower Fe4383 indices than expected for their , but higher Mgb indices than expected for their . This already provides a hint that the physical driver for the residual trends is not the total metallicity, but instead the ratio between Mg and Fe abundances. The Balmer lines show weak positive correlations, such that galaxies with strong index values (for their ) are more diffuse than predicted by the FP. This could be caused either by age or by metallicity effects, since the Balmer lines are sensitive to both parameters to some extent.
5.2 FP residuals vs. stellar population parameters
Using a single spectral index it is not possible to disentangle between the effects of age and metallicity. In this section, we use estimates of age, metallicity and -enhancement (/Fe) derived from the index measurements by means of a multi-index procedure, to provide more physically meaningful information (Smith et al. 2009).
As for the single spectral indices, the three stellar population parameters age, metallicity and /Fe correlate strongly with as shown by the scaling relations of Equation 2, therefore we first compute the residuals of stellar population parameters with respect to these relations. The lower panels of Figure 13 show the stellar population residuals against characterized, by construction, by the absence of correlations between the residuals and log itself. The top panels show the resultant correlations between the age, metallicity and /Fe residuals (left, middle and right panel respectively) and the FP residuals along the log projections.
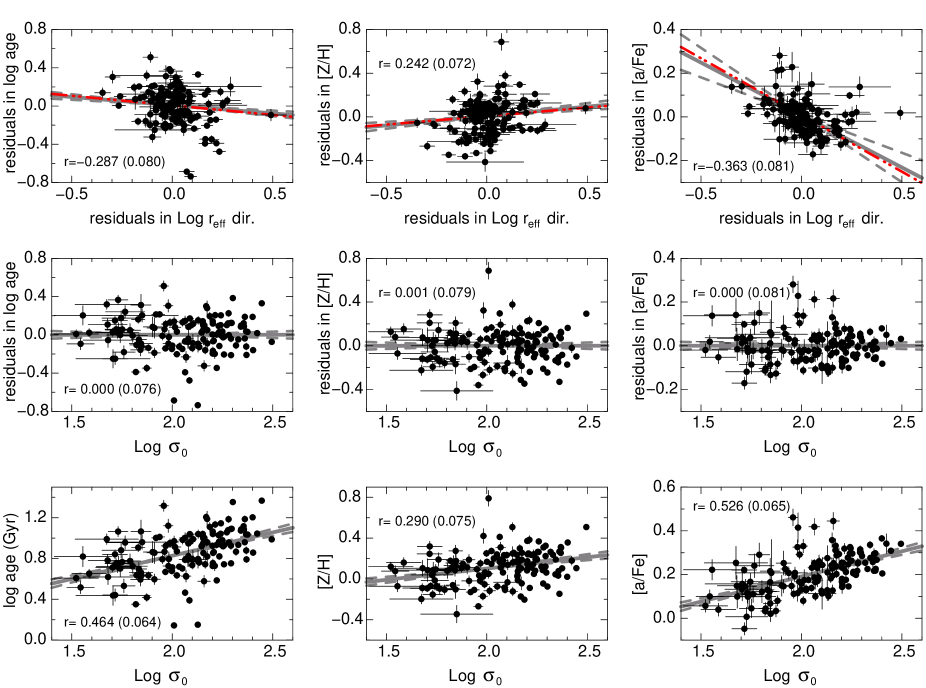
Both age and /Fe are seen to be strongly anti-correlated (at 3 and 4 respectively) with the residuals computed in the direction, while metallicity shows a positive correlation with the FP residuals along the same axis. We find these correlations to be independent of the range of covered, for example obtaining consistent results when using only the high- sample. In Table 3 we summarize the probability for all the cases.
| Mgb | Fe5015 | Fe4383 | Hbeta | HgF | HdF | Log age | Z/H | /Fe |
| 11.3% | 5.3% | 0.092% | 2.3% | 14.9% | 4.0% | 0.056% | 0.38% | 0.001% |
We note that in the figures 11, 12 and 13, the velocity dispersion enters into both axes, since each quantity is a residual from a relation involving . The errors are hence correlated which will produce a bias towards positive correlations. For each of the primary SSP parameters we measure the level of this bias through Monte Carlo simulations, based on fake data in which there are no intrinsic correlations. Firstly, for each galaxy we assign fake SSP values (age, Z/H, /Fe) following the previously derived index- relations, and having the same rms intrinsic scatter in the SSP value about the relation. We then perturb each of the values log , log , and log by their uncertainties for each galaxy, and recalculate the residuals about the FP and the index- relation as before. Through these simulations, we measure this bias ( r), i.e. the difference in the correlation coefficient, due to the correlated measurement errors in and finds:
| (15) |
We see that this bias contributes to the observed correlation between the metallicty and FP residuals, but acts to oppose the anti-correlations seen for age and -enhancement. In each case the effect of the bias is small, being at a level of 10% of the observed correlation. The relation between residuals obtained taking into account this bias is shown in figure 13 by the red dot-dashed line.
It should be remembered that the stellar population parameters presented here are derived through fixed apertures covering only the galaxy centres. Therefore, if galaxies have significant population gradients, the observed trend could be due to sampling the central stellar populations at different radii. In the case of metallicity, this may be a factor, as early-type galaxies are observed to have negative metallicity gradients (Kuntschner et al. 2006; Rawle et al. 2008) of the order dex in [Z/H]. However, spatially-resolved spectroscopy of early-type galaxies show that they generally have flat radial trends in age and /Fe (Sánchez-Blázquez et al. 2007; Rawle et al. 2008), indicating that the anti-correlation of age and abundance ratios with the FP residuals in the log and log directions is robust.
The strong correlations found between the stellar population parameters, principally the /Fe, and the residuals of the FP suggest that its scatter is in part due to variations in the stellar populations at fixed galaxy . To this aim we fit the modified FP relation:
| (16) |
where the stellar population parameter sppi is, in turn, enhancement, age and metallicity of the galaxies, and study the variation induced in the scatter by keeping and fixed as in Eq. 14 and allowing to vary to minimize the FP scatter. It is necessary to keep and fixed as each of the stellar population parameters correlate strongly with , and hence would introduce spurious variations in . The results obtained are listed in Table LABEL:fit_4dim, where the second column indicates the estimated strength of the spp term , the following two columns indicate the overall scatter in the log direction after the addition of the spp term, and the relative intrinsic scatter, and the final column the rms contribution of the ssp term to the scatter in log .
| spp | rms in log re dir. | intrinsic FP rms | spp rms contribution | |
|---|---|---|---|---|
| - | 0.088 | 0.068 | ||
| /Fe | 0.075 | 0.049 | 0.047 | |
| Log age | 0.084 | 0.063 | 0.026 | |
| Z/H | 0.087 | 0.066 | 0.016 |
The fit with the most significant coefficient () is the fit with the /Fe as fourth parameter. In the case of age and metallicity, the new coefficient is non-zero at just the 3 level, indicating the weaker impact of these parameters on the fundamental relation.
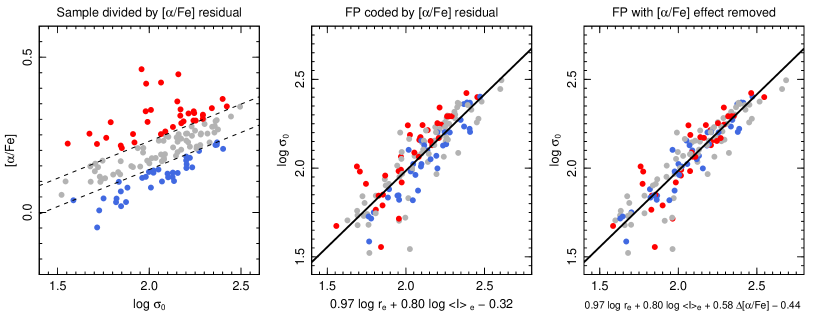
While it seems that none of the additional spp terms reduce the overall scatter significantly, the relative impact of the three spp terms becomes clearer when considering the intrinsic scatter (i.e. after accounting for the measurement uncertainties). Both the relation including the effect of age and metallicity have an intrinsic scatter of , only marginally lower than the value without the spp term, while in the case of /Fe the intrinsic scatter is reduced to 0.049. This is comparable to the rms contribution from the /Fe term (0.047), i.e. /Fe contributes around half of the intrinsic scatter, and indicates that the distribution of galaxies around the FP are tightly related to the enrichment, and hence to the timescale of star-formation. The /Fe dependence of the FP scatter is illustrated further in Figure 14 which demonstrates also the reduction in total scatter despite the introduction of measurement errors in /Fe. We split the Shapley sample into three groups (shown as red, grey and blue points in Figure 14) according to the position of each galaxy with respect to the /Fe-log relation (see left panel): the 50 of galaxies closest to the relation are plotted in grey, while the 25 with /Fe higher (lower) than expected for their are plotted in red (blue). A modest reduction in total scatter is seen, despite the introduction of uncertainty due to /Fe measurement errors.
Furthermore the total FP scatter is reduced by including the extra terms, in spite of the fact that the SSP parameters are subject to their own substantial uncertainties. This implies there must be a still greater reduction in the intrinsic FP scatter.
6 The origin of the intrinsic scatter
JFK96 pointed out that the dispersion around the FP relation is not completely due to the measurement errors but has an intrinsic scatter whose nature is not yet understood. The existence of this intrinsic scatter was interpreted as due to another “fundamental” parameter characterising the family of early-type galaxies. In many of the previous works on the FP (see Section 1), a strong effort has been made to find correlations between the FP residuals and different line-indices considered to be representative of a particular stellar population parameter (for example H for age, Mg2 for metallicity etc).
In Section 5 we showed that the FP residuals are strongly correlated with estimated stellar population parameters especially with the -abundance ratio (/Fe). Given that age and /Fe are known to correlate strongly for galaxies of a given mass, while age and metallicity anti-correlate (e.g. Proctor & Sansom 2002; Smith et al. 2007b), it is not clear which of the three parameters drives the correlations. However, the fact that the strongest correlation is observed for the /Fe suggests that this parameter is playing the major role, while age and metallicity trends just reflect their mutual correlations. The trends observed for the metallicity indices also suggest that the /Fe is driving the correlations. In fact, the positive correlations between the Z/H dependent indices Fe4383 and Fe5015 combined with the negative correlation for Mgb, is consistent with an anti-correlation for the abundance ratio /Fe. Moreover, we found that about half of the FP intrinsic variance is due to variations in the stellar populations as described by the -enhancement trend, while the other stellar population parameters seem to contribute rather less to the intrinsic scatter.
It has long been realised (Tinsley 1980) that in the study of galaxy formation and evolution, a major role can be played by the analysis of the abundance ratios, due to them being relatively model independent and primarily affected by stellar nucleosynthesis and the initial mass function (Matteucci 1996). In particular, the ratio between the so-called elements (synthesized in type II supernovae) and iron (mainly from delayed type Ia events) is widely accepted to be affected by the characteristic timescale of star-formation, the elements and iron having different production timescales (Greggio & Renzini 1983). According to the simplest and widely accepted scenario, a galaxy with a high value of /Fe has experienced many type II SNe events, but almost no SNe of type Ia during the major epoch of star-formation: this constrains the timescale for this epoch of stellar formation to be shorter than 3108 years.
Our results suggest that the galaxies which formed their stars over a shorter duration (high /Fe) are also those which are more compact. Such a pattern may be expected in a dissipational merger inducing a nuclear sturburst. Vazdekis, Trujillo and Yamada (2004), studing 21 early-type galaxies already claimed the existence of a correlation between Sersic index and Mg/Fe ratio (i.e. between galaxy structure and stellar population), even if they did not correct for correlations with . They interpreted their results as more massive galaxies having their star formation quenched on shorter time-scales. Although, in agreement with our finding, their analysis is based on to a smaller sample spanning a narrower range of velocity disperisons and luminosities with compared to our Shapley sample making any comparisons difficult.
Hopkins et al. (2008) make specific predictions for the effects of varying the dissipational fraction on the remnant spheroids of a given mass, resulting in correlations between the structural and stellar population parameters. By considering identical progenitor disks (at ) with initial gas fractions following an exponential star-formation history with time-scale , we have that the gas fraction at the time of the merger (and hence dissipational fraction in the merger-induced starburst) will scale as . If the remaining gas is then consumed in the central star-burst, producing a passively-evolving spheroid remnant, then the dissipational fraction will increase for earlier mergers, and hence mean stellar age. Hopkins et al. (2008) also show that ellipticals formed through mergers with higher dissipation fractions should be more -enriched. As merger remnants involving more dissipation, like those between more gas-rich disks, are expected to yield larger mass fractions formed in nuclear starbursts, which reduce significantly the effective radii of the remnant, we should expect both mean stellar age and /Fe to anti-correlate with the residuals in the direction.
We observe clear correlations between the FP residuals and age and /Fe, with those galaxies of a given mass with effective radii smaller than predicted by the FP to have stellar populations systematically older and with higher abundances than average, fully consistent with the predictions of Hopkins et al. (2008).
7 Summary and Conclusions
We have derived the FP of a sample of 141 early-type galaxies in the Shapley supercluster at . Velocity dispersions and stellar population parameters were derived from the spectroscopic data of Smith et al. (2007), while R-band photometry is from the Shapley Optical Survey (Mercurio et al., 2006). The final sample extends down to M+3 in magnitude and 50 km s-1 in . Using the software 2DPHOT (La Barbera et al. 2008b) we derived for each galaxy the structural parameters , , , and by fitting a 2D PSF-convolved Sersic model. The morphological classification was performed by eye and checked with those of Thomas & Katgert (2006) for a subsample of 54 galaxies finding complete agreement.
Adopting a weighted fit (see Eq. 8) we derived the FP: for the 141 early-type R18 galaxies. The low value of can be related to the extension of our sample towards very low values of velocity dispersion and and also to the method used to determine . Considering the subsample of km s-1 galaxies the FP turns out to follow the relation which is consistent with the Coma FP obtained by JFK96. Observing the significant change in the value between the total and the high- samples, we investigate the possible curvature of the FP. Applying the same cuts to a simulated sample following a linear FP relation, we ascertain that the observed curvature can be explained by selection effects. Departure from a linear trend of the FP relation has been claimed by D’Onofrio et al. (2008), and Desroches et al. (2001) found that the faint-end luminosity cut influences the coefficient of the FP, in agreement with Nigoche-Netro (2008). Similar results were found by Hyde Bernardi (2008) studying the FP residuals along the plane. However, these works pointed out that conclusive evidence of the FP curvature needs either more robust statistics or higher accuracy in the velocity dispersion estimates for low mass systems.
The most important result of this work is our demonstration that the FP residuals are correlated with stellar population characteristics (line- strength indices and derived SSP parameters). In particular, FP residuals are anti-correlated both with the -element abundance ratio, /Fe, and with galaxy age resulting in trends whereby galaxies more compact than expected from the FP relation have stellar pupulations systematically older and with higher abundances than average. Previous studies have reported correlations of the FP residuals with stellar age (e.g. Forbes et al. 1998; Reda et al. 2005). Although our FP residual do show a correlation with age, we recover a much stronger signal for /Fe than for age, suggesting that this is the more fundamental dependence. Indeed, a multiple regression analysis suggests there is no age correlation at fixed /Fe, but a very strong /Fe correlation at fixed age. The correlation between /Fe and FP residuals does not indicate a direct causal effect, since varying /Fe at fixed age and Z/H has little effect on the stellar mass-to-light. Instead, the correlation suggests that the structural properties and the star-formation history are both dependent on some unobserved aspect of the galaxy assembly process. At face value, our results are broadly consistent with recent galaxy merger simulations, which predict a sequence of formation mechanisms governed by the varying importance of dissipation (Hopkins et al. 2008). In this scenario, mergers with a higher initial gas-fraction trigger more centrally-concentrated starbursts, and higher abundances due to the short duration of star-formation in the burst.
Acknowledgments
AG gratefully acknowledges the hospitality of the University of Birmingham during her stays there, where some of the work was performed. CPH acknowledges financial support from STFC. RJS is supported by STFC rolling grant PP/C501568/1 “Extragalactic Astronomy and Cosmology at Durham 2005–2010”.
This work was carried out in the framework of the collaboration of to the FP7-PEOPLE-IRSES-2008 project ACCESS “A Complete CEnsus of Star-formation and nuclear activity in the Shapley supercluster”.
We thank the anonymous referee for his/her comments which helped to improve this work.
References
- Beers et al. (1990) Beers T. C., Flynn K., Gebhardt K., 1990, AJ, 100, 32
- Bender et al. (1992) Bender R., Burstein D., Faber S. M., 1992, ApJ, 399, 462
- Bernardi et al. (2003) Bernardi M., et al., 2003, AJ, 125, 1866
- Bertin & Arnouts (1996) Bertin E., Arnouts S., 1996, A&A, 117, 393
- Bertin et al. (2002) Bertin G., Ciotti L., Del Principe M., 2002, A&A, 386, 149
- Binney et al. (1998) Binney & Merrifield, 1998, in Galactic Astronomy, Princeton Univeristy Press
- Caon et al. (1993) Caon, N., Capaccioli M., D’Onofrio M., 1993, MNRAS, 265, 1013
- Cappellari et al. (2006) Cappellari M., et al., 2006, MNRAS, 366, 1126
- Djorgovski & Davis (1987) Djorgovski S., Davis M., 1987, ApJ, 313, 59
- D’Onofrio et al. (2008) D’Onofrio et al., 2008, arXiv:0804.1892
- Dressler et al. (1987) Dressler et al., 1987, ApJ, 313, 42
- Faber & Jackson (1976) Faber S. M. Jackson R. E., 1976, ApJ, 204, 668
- Forbes et al. (1998) Forbes et al., 1998, ApJ, 508, 43
- Fukugita et al. (1995) Fukugita M., Shimasaku K., Ichikawa T. A. W., 1995, PASP, 107, 945F
- Gerhard et al. (2001) Gerhard O., Kronawitter A., Saglia R. P., Bender R. 2001, AJ, 121, 1936
- Graham & Guzmán (2003) Graham A. W., Guzmán R., 2003, AJ, 125, 2936
- Gregg (1992) Gregg M., 1992, ApJ, 384, 43
- Greggio Renzini (1983) Greggio L Renzini A., 1983, A.A, 118, 217.
- Guzman Lucey (1993) Guzman R. Lucey J. R., 1993, MNRAS, 263, L47.
- Guzman, Lucey Bower (1993) Guzman R., Lucey J. R., Bower R. G. 1993, MNRAS, 265, 731.
- Haines et al. (2006) Haines C. P., Merluzzi P., Mercurio A., Gargiulo A., Krusanova N., Busarello G., La Barbera F., Capaccioli M., 2006, MNRAS, 371, 55
- Haines et al. (2007) Haines C. P., Gargiulo A., La Barbera F., Mercurio A., Merluzzi P., Busarello G., 2007, MNRAS, 381, 7
- Hopkins et al. (2008) Hopkins P. F., Cox T. J., Hernquist L., 2008, ApJ, 689, 17
- Jørgensen & Franx (1994) Jørgensen I., Franx M., 1994, ApJ, 433, 553
- Jørgensen et al. (1995) Jørgensen I., Franx M., Kjægaard P., 1995, MNRAS, 276, 1341
- Jørgensen et al. (1996) Jørgensen I., Franx M., Kjægaard P., 1996, MNRAS, 280, 167 (JFK96)
- Kelson et al. (2000) Kelson D. D., Illingworth G. D., van Dokkum P. G., Franx M., 2000, ApJ, 531, 184
- Kormendy (1976) Kormendy J., 1976, ApJ, 218, 333
- Kroupa (2001) Kroupa P., 2001, MNRAS, 322, 231
- Kuntcshner (2006) Kuntschner et al., 2006, MNRAS, 369, 497
- La Barbera et al. (2008a) La Barbera F., Busarello G., Merluzzi P., de la Rosa I., Coppola G., Haines C. P., 2008a, ApJ, 689, 913
- La Barbera et al. (2008b) La Barbera F., de Carvalho R. R., Kohl-Moreira J. L., Gal R. R., Soares-Santos M., Capaccioli M., Santos R., Sant’Anna N., 2008b, PASP, 120, 681
- Maraston (2005) Maraston C., 2005, MNRAS, 362, 799
- Matković & Guzmán (2005) Matković A. Guzmán R., 2005, MNRAS, 362, 289
- Matteucci (2003) Matteucci F., 1996, Fundamentals of Cosmic Physics, Vol. 17, pp. 283-396
- Mercurio et al. (2006) Mercurio A., Merluzzi P., Haines C. P., Gargiulo A., Krusanova N., Busarello G., La Barbera F., Capaccioli M., Covone G., 2006, MNRAS, 368, 109
- Nelan et al. (2005) Nelan J. E., Smith R. J., Hudson M. J., Wegner G. A., Lucey J. R., Moore S. A. W., Quinney S. J., Suntzeff N. B., 2005, ApJ, 632, 137
- Nigoche-Netro et al. (2008) Nigoche-Netro A. et al., 2008, preprint, asrto-ph 08051142
- Pahre et al. (1999) Pahre M. A., Djorgovski S. G., de Carvalho R. R., 1999, ASP Conference Series, Vol. 163, 17
- Poggianti (1997) Poggianti B. M., 1997, AAS, 122, 399
- Proctor & Sansom (2002) Proctor R. N. & Sansom A. E., 2002, MNRAS, 333, 517
- Prugniel & Simien (1996) Prugniel P. & Simien F., 2002, AA, 309, 749
- Rawle et al. (2008) Rawle T. D., Smith R. J., Lucey J. R., Swinbank A., 2008, MNRAS, 389, 1891
- Reda et al. (2005) Reda F. et al., 2005, MNRAS, 360, 693
- Robertson et al. (2006) Robertson B., Cox T. J., Henquist L., Franx M., Hopkins P. F., Martini P., Springel V., 2006, ApJ, 641, 21
- Sánchez-Blázquez et al. (2006) Sánchez-Blázquez P., et al., 2006, MNRAS, 371, 703
- Sánchez-Blázquez et al. (2007) Sánchez-Blázquez P., Forbes D. A.; Strader J., Brodie J., Proctor R., 2007, MNRAS, 377, 759
- Schlegel et al. (1998) Schlegel D. J. et al., 1998, ApJ, 500, 525
- Smith et al. (2004) Smith R. J., et al., 2004, AJ, 128, 1558
- Smith et al. (2007) Smith R. J., Lucey J. R., Hudson M. J., 2007, MNRAS, 381, 1035 (SLH)
- Smith et al. (2009) Smith R. J., Lucey J. R., Hudson M. J. 2009, MNRAS, submitted
- Steinmetz (2002) Steinmetz M. Navarro J. F., 2002, NewA, 7, 155
- Thomas et al. (2003) Thomas D., Maraston C., Bender R., 2003, MNRAS, 339, 897
- Thomas et al. (2004) Thomas D., Maraston C., Korn A., 2004, MNRAS, 351, L19
- Thomas et al. (2005) Thomas J., Saglia R. P., Bender R., Thomas D., Gebhardt K., Magorrian J., Corsini E. M., Wegner G., 2005, MNRAS, 360, 1355
- Thomas & Katgert (2006) Thomas T., Katgert P., 2006, A&A, 446, 31
- Tinsley (1980) Tinsley B. M., 1980, Fund Cosmic Phys., 5, 287
- Toomre & Toomre (1972) Toomre A., Toomre J., 1972, ApJ, 178, 623
- Toomre (1977) Toomre A., 1977, in Evolution of Galaxies and Stellar Populations, ed. B. M. Tinsley & R. B. Larson, 401
- Trujillo et al. (2004) Trujillo I., Burkert A., Bell E. F., 2004, ApJL, 600, 39
- Vandame (2004) Vandame B., 2004, PhD thesis
- Vazdekis, Trujillo & Yamada (2004) Vazdekis A., Trujillo I., Yamada Y. 2004, ApJ, 601L
- Young & Currie (1994) Young C. K., Currie M. J., 1994, MNRAS, 268, L11
- Wainer & Thissen (1976) Wainer H. & Thissen D., 1976, Psychometrika, 41, 9
- Wuyts et al. (2004) Wuyts S. et al., 2004, ApJ, 605, 677
- Zaritsky et al. (2006) Zaritsky D., Gonzalez A. H., Zabludoff A. I., 2006, ApJ, 638, 725