Looking outside the Galaxy:
the discovery of chemical anomalies in 3 old Large Magellanic Cloud
clusters111Based on
observations collected at the Very Large Telescope of the
European Southern Observatory
(ESO), Cerro Paranal, Chile, under programme 080.D-0368(A).
Abstract
By using the multifiber spectrograph FLAMES mounted at the ESO-VLT, we have obtained high-resolution spectra for 18 giant stars, belonging to 3 old globular clusters of the Large Magellanic Cloud (namely NGC 1786, 2210 and 2257). While stars in each cluster showed quite homogeneous iron content, within a few cents of dex (the mean values being Fe/H]= –1.750.01 dex, –1.650.02 dex and –1.950.02 dex for NGC 1786, 2210 and 2257, respectively), we have detected significant inhomogeneities for the [Na/Fe], [Al/Fe], [O/Fe] and [Mg/Fe] abundance ratios, with evidence of [O/Fe] vs [Na/Fe] and [Mg/Fe] vs [Al/Fe] anticorrelations. The trends detected nicely agree with those observed in Galactic Globular Clusters, suggesting that such abundance anomalies are ubiquitous features of old stellar systems and they do not depend on the parent galaxy environment. In NGC 1786 we also detected two extreme O-poor, Na-rich stars. This is the first time that a firm signature of extreme chemical abundance anomalies has been found in an extragalactic stellar cluster.
1 Introduction
Stars in Galactic Globular Clusters (GCs) are known to be homogenous in their overall metal content. However, in the recent years significant star-to-star abundance variations of some light elements (namely Li, C, N, O, Na, Mg, Al) have been discovered (see e.g. Gratton, Sneden & Carretta, 2004; Carretta, 2008a; Yong et al., 2008), suggesting that Galactic GCs harbor at least two sub-populations with different chemical abundance ratios. The normal population is similar to the halo field one, with average [O/Fe],[Mg/Fe] and [Al/Fe] enhanced by a factor 2-3 with respect to the solar value, and [Na/Fe] between solar and half-solar. The anomalous population has significant [O/Fe] and moderate [Mg/Fe] depletion, and significant (up to an order of magnitude) [Na/Fe] and [Al/Fe] enhancement with respect to the solar value. Moreover, super-O-poor stars in the [O/Fe] distributions have been measured in a few Galactic GCs, as in NGC 2808 (Carretta et al., 2006) and M13 (Sneden et al., 2004), reaching [O/Fe] –1.2 dex, while [Na/Fe] remains about constant.
The detection of abundance anomalies in extragalactic clusters is still controversial and only few and sparce measurements exist so far. Hill et al. (2000) analysed 3 giants of the old cluster NGC 2210 in the Large Magellanic Cloud (LMC), finding a general homogeneity for [O/Fe] ( +0.14 dex, = 0.10 dex) but a large spread for the [Al/Fe] ratio, with [Al/Fe]= +0.11 dex (= 0.32 dex). Johnson et al. (2006) discussed the chemical content of 4 LMC old clusters (namely, Hodge 11, NGC 1898, 2005 and 2019). All the stars analysed have normal [O/Fe] and [Na/Fe]: only one star in NGC 1898 shows a largely enhanced [Al/Fe]= +0.77 dex. Letarte et al. (2006) reported the chemical composition of 3 old clusters in Fornax, finding two stars (one in Fornax 1 and one in Fornax 3) with [O/Fe] +0.2 dex and enhanced [Na/Fe] +0.4 dex. These measurements, although too sparce to probe any scenario, suggest that chemical anomalies can be found also in old extragalactic globulars.
This Letter is the third, after Ferraro et al.(2006) and Mucciarelli et al.(2008), of a series of papers aimed at studying in an homogeneous way the chemical composition of a sample of LMC clusters. For all the targets the same analysis procedure and basic assumptions for model atmospheres, atomic data and solar values have been adopted. In this Letter we present chemical abundance patterns for 18 giants in 3 old clusters in the LMC (namely NGC 1786, 2210 and 2257), with the purpose of clarifying the level of chemical inhomogeneity within these stellar systems. The entire set of abundances for these clusters will be presented in a forthcoming paper.
2 Observations and chemical analysis
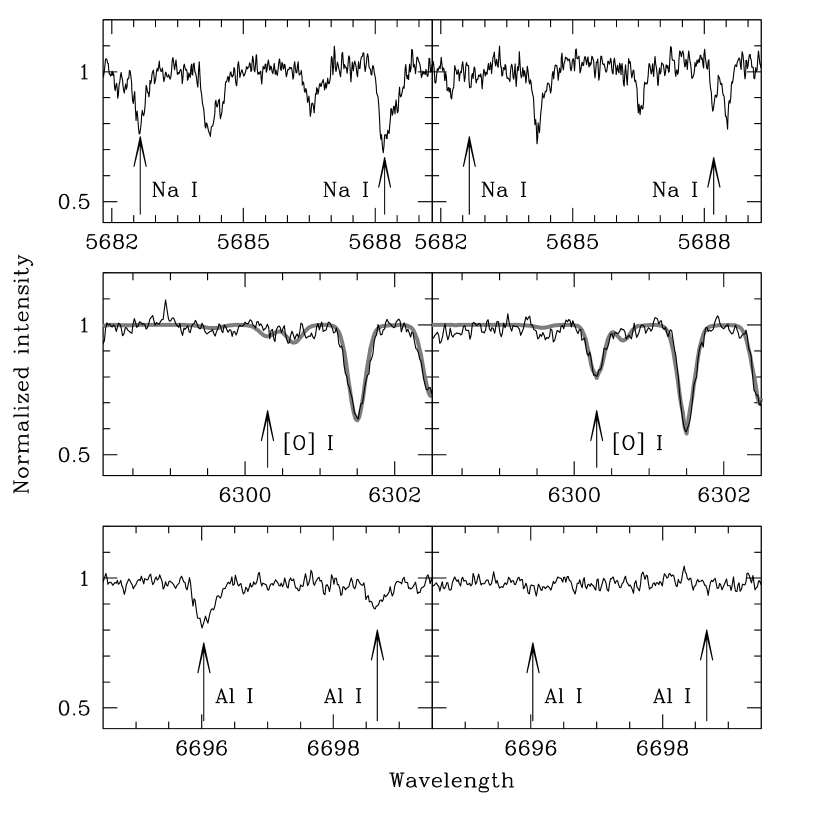
18 giants located in 3 old LMC clusters (NGC 1786, 2210 and 2257) have been observed with FLAMES at the ESO-VLT telescope (ID Proposal 080.D-0368(A)). The target stars have been selected along the Red Giant Branch of IR Color-Magnitude Diagram (A. Mucciarelli et al., 2009, in preparation) with typical 12.8–13.5 magnitudes and 0.6–0.8 colors. All the targets have been observed with the UVES Red Arm (covering the 4800-6800 wavelength range) and the HR 11 and HR 13 GIRAFFE/MEDUSA setups (covering the 5600-5840 and 6120-6400 ranges, respectively). The spectra have been acquired in series of 8-9 exposures of 45 min each and pre-reduced by using the UVES and GIRAFFE ESO pipeline 222http://www.eso.org/sci/data-processing/software/pipelines/, including bias subtraction, flat-fielding, wavelength calibration and spectrum extraction. Single spectra have been coadded (reaching S/N40-60 and S/N80-100 per pixel for the UVES and GIRAFFE spectra, respectively) and finally normalized to unity in the continuum. Radial velocities have been measured by using the IRAF task FXCOR, performing a cross-correlation between the targets and a template of similar spectral type, and heliocentric corrections have been applied. Fig. 1 shows portions of the UVES spectra for two stars of NGC 1786, with some lines of interest indicated.
The abundance analysis has been performed using the LTE spectral line analysis code ROSA (developed by Raffaele G. Gratton, private communication) and the model atmosphere grids of Kurucz (1993). The abundances of Fe, Na, Mg and Al have been computed from equivalent widths (EWs) measurements, while the O abundance has been obtained from spectral synthesis, to account for the contribution of the Ni line at 6300.34 to the line profile of the [O] I line at 6300.31 (for sake of comparison, when possible, we measured also the weaker [O] I line at 6363.8 ). Na abundances have been derived from the 5682-88 doublet and, when possible, the 6154-60 doublet, Mg has been measured from the 5711 and 6318 lines, while Al from the 6696-6698 doublet. O, Na and Mg lines are measured both in UVES and GIRAFFE spectra, while the Al lines are available only in the UVES spectra. Oscillator strengths and atomic data for the selected lines are as in Gratton et al. (2003), including those transitions for which accurate laboratory or theoretical log gf are available, with formal errors below 0.05 dex. Van der Waals broadening constants are from Barklem et al. (2000) and the classical Unsold (1955) approximation. Table 1 lists the wavelength, atomic parameters and measured EW for some lines, the complete version being available in electronic form. Adopted solar values are as in Gratton et al. (2003) who performed an analysis on the solar spectrum by using the same line-list and methodology adopted here. Corrections for LTE departure have been applied to the Na abundances, using those computed by Gratton et al. (1999). For some stars the Al or [O] I lines are too faint and we provide upper limits only, derived by using synthetic spectra (for [O] I) or (in the case of Al) computing the abundance corresponding to the minimum measurable EW. Guess values for and log g have been derived from dereddened JK photometry, by using the E(B-V) values reported by Persson et al. (1983) and the - relation by Alonso et al. (1999). Generally, the photometric well satisfies the excitation equilibrium and only for a few targets we re-adjusted the values in order to take into account residual trends between neutral iron abundances and excitation potential. Photometric gravities have been computed by using the isochrones of the Pisa Evolutionary Library (Cariulo, Degl’Innocenti & Castellani, 2004) and adopting a distance modulus of = 18.5 and an evolutionary mass of 0.85 . We re-adjusted also log g values by imposing the ionization equilibrium between Fe I and Fe II. Also microturbulent velocities have been derived empirically by minimizing residual trends between Fe I abundances and expected line strengths. For the GIRAFFE spectra, for which no Fe II line is available, gravities have been derived by using a suitable vs log g relationship, obtained from the UVES spectra.
3 Results
The average value of each abundance ratio (and the corresponding
internal error and dispersion) for all the stars observed in each
cluster is listed in Table 2, together with
the adopted atmospherical parameters.
Internal errors due to the EW measurement have been estimated
by dividing the line-to-line scatter obtained in each star from the
Fe I lines by the square root of the observed lines number.
First guesses of the stellar parameters are from photometric
information, then they are spectroscopically optimized.
This means that the measurements of , log g and
are not independent. By varying each stellar parameter by a given
amount and keeping the other fixed and
by summing in quadrature all these terms one can obtained an
upper limit to the total uncertainty in the derived abundance.
To better estimate the uncertainty associated to the atmospherical
parameters, we adopted the procedure already used by Cayrel et al. (2004) which
take also into account the covariance terms.
Since the largest uncertainties in the abundance determination arise
from the uncertainty in ,
we have varied the of our best model by +100 K
333This error corresponds to the 1 variation of
the slope between Fe I abundances and excitation potential.
and we repeated the analysis
procedure for star NGC 1786-1501, chosen as
representative of the entire sample, re-optimizing the other parameters.
This procedure provides variations of +0.08, +0.13, –0.07, –0.04 and
–0.05 dex for [Fe/H], [O/Fe], [Na/Fe], [Mg/Fe] and [Al/Fe], respectively.
The total error for each abundance ratio has been computed by the sum
in quadrature of the errors due to EW measurement and atmospherical
parameters.
In the following we schematically summarize the main results:
NGC 1786:
we measured seven stars, finding an iron content of [Fe/H]= –1.750.01
dex (= 0.02 dex) and an heliocentric radial velocity
= 264.3 km (= 5.7 km ).
These results are consistent with the Ca II triplet analysis by Olszewski et al. (1991)
that found [Fe/H]= –1.870.2 dex.
Two stars (#2310 and #2418) show large depletion
of [O/Fe] and [Mg/Fe], and large enhancement of [Na/Fe] and
[Al/Fe] (as measured in #2310 only).
Star #1501 shows normal [O/Fe] and largely enhanced
[Na/Fe] and [Al/Fe], while star #978 show depletion
of [O/Fe] and some enhancement of [Na/Fe].
NGC 2210:
we measured five giants, finding an iron content of
[Fe/H]= –1.650.02 dex (= 0.04 dex) and a mean heliocentric
velocity of = 337.5 km (= 1.9 km ).
The previous analysis by Olszewski et al. (1991) provides a lower iron content
([Fe/H]= –1.970.2 dex), while the high-resolution spectroscopic
analysis by Hill et al. (2000) provides [Fe/H]= –1.750.10 dex.
Both [O/Fe] and [Mg/Fe] appear normal and homogeneous,
with average values of [O/Fe]= +0.21 (= 0.09 dex) and
[Mg/Fe]= +0.33 (= 0.09 dex),
while [Na/Fe] and [Al/Fe] show a much larger spread. In particular,
stars #309 and #431 have large (0.5 dex) [Na/Fe] and [Al/Fe]
enhancement.
NGC 2257:
we measured six stars, finding an iron content of
[Fe/H]= –1.950.02 dex (= 0.04 dex) and heliocentric velocity
of = 299.4 km (= 1.5 km ).
The Ca II triplet analysis performed by Grocholski et al. (2006) provides
an higher iron content ([Fe/H]= –1.590.02 dex), while
the findings obtained by Hill (2004) by using high-resolution
spectroscopic point toward a lower value of iron ([Fe/H]= –1.860.10 dex).
Four (namely #189, #586, #842 and #993) out of six stars are [O/Fe] depleted
and [Na/Fe] enhanced. The other two (#136 and #295) stars have normal [O/Fe]
and enhanced [Na/Fe] and especially [Al/Fe] (+0.8 dex) with
respect to the solar value.
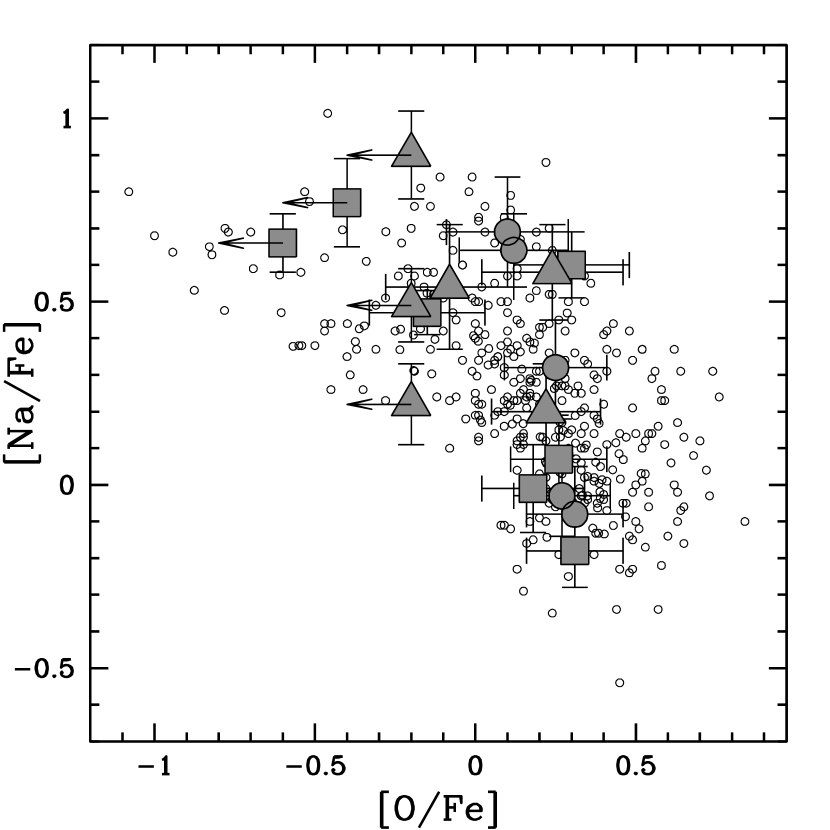
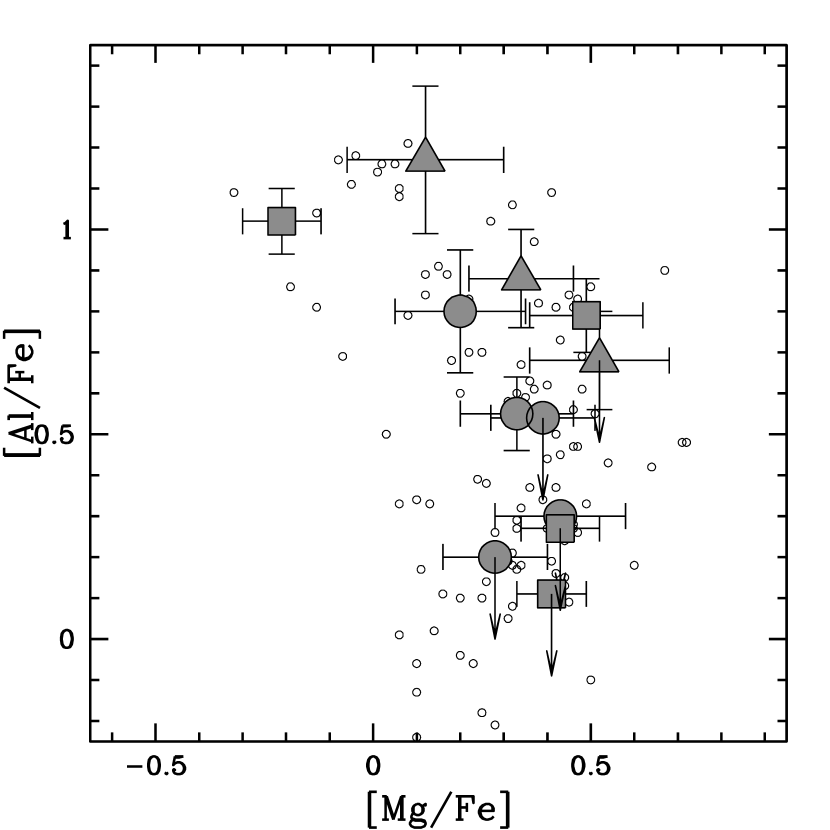
The analysis presented in this Letter demonstrates that the iron abundance (as well as the other iron peak and -elements, A. Mucciarelli et al., 2009, in preparation) is remarkably constant (within 0.1 dex) within each cluster. Conversely, the selected stars show a significant spread in the [Na/Fe] and [Al/Fe] abundance ratios, that largely exceed (at a level of 2-4 ) the observational error. Moreover, in the case of NGC 1786 and NGC 2257 also a large spread in [O/Fe] and [Mg/Fe] has been found. On the other hand, the star-to-star differences in the absorption line intensities of Na, O and Al can be easily appreciated from the comparison shown in Fig. 1: this evidence confirms that a real spread in the content of these elements does exist among stars within the same cluster. Fig. 2 shows the behaviour of [Na/Fe] as a function of [O/Fe] (left panel) and of [Al/Fe] as a function of [Mg/Fe] (right panel) for the observed stars (stars in different clusters are marked with different symbols, see caption). As apparent from the Figure, the measured abundance ratios define a trend that nicely matches the distribution observed in Galactic GCs (small circles), tracing the so-called Na-O and Al-Mg anticorrelations. In order to quantify the correlation between the observed abundances, we measured the Spearman rank coefficient finding = –0.65 between [O/Fe] and [Na/Fe] and = –0.50 between [Mg/Fe] and [Al/Fe], corresponding to a probability of 99% and 95%, respectively, that the two set of abundance ratios be anti-correlated. This is the first clear-cut evidence that Na-O and Al-Mg anticorrelations do occur in extragalactic clusters, suggesting that this feature might be ubiquitous to old globular clusters regardless of the parent galaxy environment.
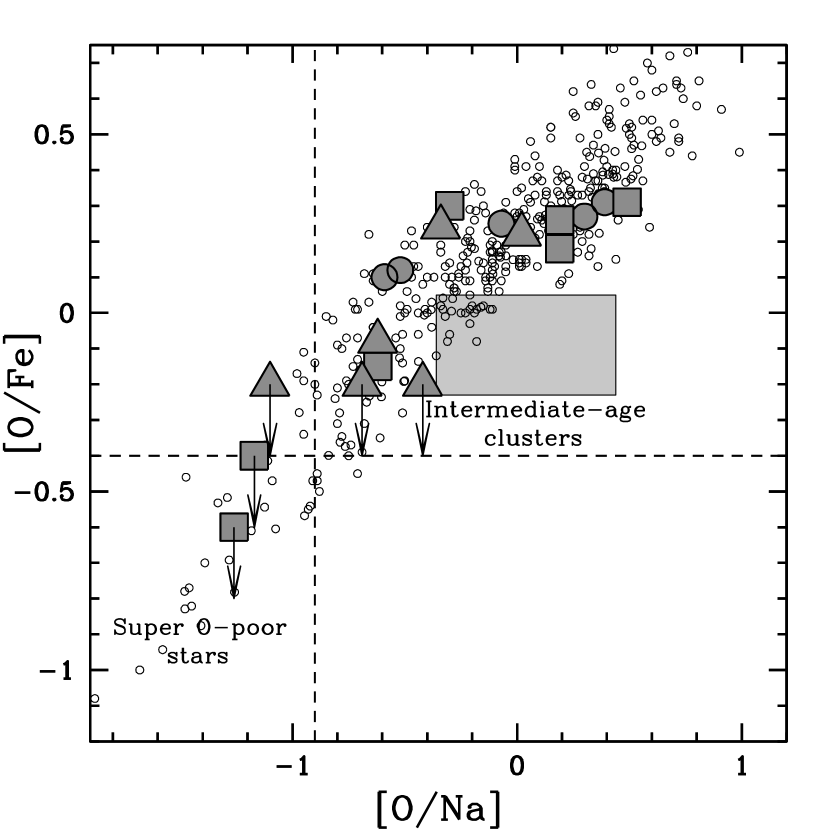
Fig. 3 shows the distribution of the [O/Fe] abundance ratio as a function of [O/Na] for the old LMC and Galactic GCs of Fig. 2. This plane is specially useful to trace the stars distribution along the Na-O anticorrelation and to better define the locus of the most extreme O-poor stars, defined as [O/Fe] –0.4 dex (Sneden et al., 2004) and/or [O/Na] –0.9 dex (Carretta et al., 2008b). It is also worth noticing that two stars (#2310 and #2418) in NGC 1786 are super-O-poor (with [O/Fe]–0.4 dex) and also largely depleted in [Mg/Fe] and (in the case of #2310) largely enhanced in [Na/Fe] and [Al/Fe]. This is the first time that an evidence of extreme chemical abundance anomalies has been firmly measured in an extragalactic stellar cluster.
4 Discussion and Conclusions
The two main results of this Letter are: (i) the first discovery of Na-O and Mg-Al anticorrelations in the metal content of extragalactic GCs; (ii) the first detection of super-O-poor stars in such objects. Chemical anomalies and anticorrelations detected in Galactic GCs are currently interpreted in a scenario where the anomalous stars have formed from the ashes of a previous generation able to pollute the pristine gas with material processed by proton-capture reactions. Although still matter of debate, two possible polluters have been proposed: intermediate-mass (3-8 ) AGB stars during the Hot Bottom Burning phase (Ventura et al., 2001; Ventura & D’Antona, 2008) and fast rotating massive stars (Decressin et al., 2007). Theoretical models by D’Antona & Caloi (2008) suggest that the second generation of polluted stars should be a significant fraction of the entire cluster population (50-70%) and also He enriched. Recently, Renzini et al. (2008) proposed a critical discussion of the possible self-enrichment scenarios, showing as only the AGB stars are able to produce subsequent generations with the observed features.
Several cluster parameters affect the development and the extension of the anticorrelations, i.e. density, mass, metallicity, orbital parameters. Chemical anomalies have been detected exclusively in the Galactic GCs (with a clearcut correlation between cluster mass and the [O/Na] distribution) and not in the less massive and dense Open Clusters (OCs) or in the field stars, pointing out that the environment density and mass play a key role in retaining the ejecta of the first generation. Less pronounced abundance anomalies at increasing cluster metallicity have been also suggested by theoretical models by Ventura et al. (2001) and Ventura & D’Antona (2008) in the framework of the AGB scenario. Moreover, the tight correlation showed by Carretta (2006) between the [O/Na] distribution and the orbital parameters of the Galactic GCs indicates that GCs less perturbed by the interactions with the Galactic Disk have more pronounced chemical anomalies.
The observations presented in this Letter demonstrate that this scenario can apply also to old clusters in the LMC. In Fig. 3, for sake of comparison, we have also plotted (as a large grey rectangle) the locus defined by 27 stars measured by Mucciarelli et al. (2008) in four intermediate-age LMC clusters and obtained by analysing high-resolution spectra with the same methodology adopted here. As apparent from the Figure, all the measured giants in the intermediate-age LMC clusters show [O/Na] values consistent with a normal pre-enriched stellar population while [O/Fe] (for a given [O/Na]) is systematically lower than in old GCs (either Galactic or in the LMC). A similar (slightly subsolar) abundance has been found also for the other -elements abundances (Mucciarelli et al., 2008). This is consistent with a pre-enrichment powered by both type II and Ia SNe over a long (10 Gyr) timescale.
The old LMC clusters studied here show mass and metallicity comparable with the ones of the Galactic GCs. The fact that, at variance with the older LMC and Galactic GCs, the intermediate-age LMC clusters do not show clear chemical abundance anomalies could be explained as a combined effect of high metallicity and moderate mass. Indeed, the four intermediate-age clusters studied by Mucciarelli et al. (2008) are significantly more metal-rich 444However a quantitative comparison with the predictions of the models by Ventura et al. (2001) and Ventura & D’Antona (2008) cannot be performed since they provided models up to a metallicity (Z= 0.004) which is too low to account for the intermediate-age LMC clusters (Z0.008-0.009). and less massive (M to , Mackey & Gilmore, 2003, D. Mackey, private communication) than the old LMC clusters studied here ( Mackey & Gilmore, 2003). It is worth noticing that these intermediate-age clusters are old enough to have already experienced self-enrichment (if any), because the pollution by AGB should work within the first 100 Myr of the cluster life.
The mass/metallicity threshold scenario also agrees with the fact that the few Galactic GCs with high metallicity ([Fe/H]–0.7 / –0.4 dex) and relevant abundance anomalies (as 47 Tuc, NGC 6388 and NGC 6441) are definitively the most massive clusters () in the Galactic system, while those with mass are all metal-poor.
The detection of abundance anomalies in the three old LMC clusters presented here suggests that old (relatively massive) metal-poor clusters can undergo self-enrichment process, regardless of the parent galaxy environment. The results presented here and in Mucciarelli et al. (2008), combined with the findings in the Galactic GCs and OCs, seem to suggest a mass/metallicity threshold effect that allows (if we consider the metal-rich regime) only very massive clusters to exhibit pronounced chemical anomalies. Moreover, due to not well known orbital parameters of the LMC clusters, we cannot exclude the effect due to the interaction with the Galaxy and SMC fields, similar to the one between several Galactic GCs and the Galactic Disk. Bekki & Chiba (2005) point out that the LMC and SMC are in the present-day binary orbit in the last 5 Gyr, while Besla et al. (2007) suggest as the LMC-SMC system is on its first close passage about the Galaxy, being entered in the Galactic virial radius less than 3 Gyr ago. These scenarios suggest as the most recent cluster populations could be strongly disturbed by the near tidal fields, both of the Galaxy and the SMC, pulling away the AGB ejecta and erasing the chemical signatures of the self-enrichment also in the intermediate-age cluster massive enough. On the other hand, the old clusters have been less affected by similar perturbations, retaining the first-generation gas. However, many more extragalactic clusters in the Magellanic Cloud and other Local Group galaxies need to be observed to further investigate the occurrence of this process with varying structural and physical cluster parameters and the host galaxy.
References
- Alonso et al. (1999) Alonso, A., Arribas, S., & Martinez-Roger, C., 1999, A&AS, 140, 261
- Bekki & Chiba (2005) Bekki, K., & Chiba, M., 2005, MNRAS, 356, 680
- Barklem et al. (2000) Barklem, P., Piskunov, N., & O’Mara, B. J., 2000, A&AS, 142, 467
- Besla et al. (2007) Besla, G., et al., 2007, ApJ, 668, 949
- Cariulo, Degl’Innocenti & Castellani (2004) Cariulo, P., Degl’Innocenti, S., & Castellani, V., 2004, A&A, 421, 1121
- Carretta et al. (2004a) Carretta, E.,et al., 2004, A&A, 416, 925
- Carretta et al. (2004b) Carretta, E., Bragaglia, A., & Cacciari, C., 2004, ApJ, 610, 25L
- Carretta et al. (2006) Carretta, E.,et al., 2006, A&A, 450, 523
- Carretta (2006) Carretta, E., 2006, AJ, 131, 1766
- Carretta et al. (2007a) Carretta, E., et al, 2007, A&A, 464, 927
- Carretta et al. (2007b) Carretta, E., et al, 2007, A&A, 464, 939
- Carretta (2008a) Carretta, E., 2008, Mem. Soc. Astron. Italiana, 79, 508
- Carretta et al. (2008b) Carretta, E., Bragaglia, A., Gratton, R. G., & Lucatello, S., 2008, arxiv:0811.3591v1
- Cayrel et al. (2004) Cayrel, R. et al., 2004, A&A, 416, 1117
- D’Antona & Caloi (2008) D’Antona, F., & Caloi, V., 2008, MNRAS, 390, 693
- Decressin et al. (2007) Decressin, T., et al., 2007, A&A, 464, 1029
- Ferraro et al. (2006) Ferraro, F. R., Mucciarelli, A., Carretta, E., & Origlia, L., 2006, ApJ, 645, 33L
- Gratton et al. (1999) Gratton, R. G., Carretta, E., Eriksson, K., & Gustafsson, B., 1999, A&A, 350, 955
- Gratton et al. (2001) Gratton, R. G. et al., 2001, A&A, 369, 87
- Gratton et al. (2003) Gratton, R. G., et al., 2003, A&A, 404, 187
- Gratton, Sneden & Carretta (2004) Gratton, R. G., Sneden, C., & Carretta, E., 2004, ARA&A, 42, 385
- Grocholski et al. (2006) Grocholski, A. J., Cole, A. A., Sarajedini, A., Geisler, D., & Smith, V. V., 2006, AJ, 132, 1630
- Hill et al. (2000) Hill, V., et al., 2000, A&AS, 364, 19
- Hill (2004) Hill, V., 2004, in Origin and Evolution of the Elements, ed. A. McWilliam & M. Rauch (Cambridge: Cambridge Univ. Press), 205
- Johnson et al. (2006) Johnson, J. A., Ivans, I. I.,& Stetson, P. B., 2006,ApJ, 640, 801
- Kurucz (1993) Kurucz, R. L., 1993, CD-ROM 13, Smithsonian Astrophysical Observatory, Cambridge
- Ivans et al. (2001) Ivans, I. I., et al., 2001, AJ, 122, 1438
- Letarte et al. (2006) Letarte, B., et al., 2006, A&A, 453, 547
- Mackey & Gilmore (2003) Mackey, A. D., & Gilmore, G. F., 2003, MNRAS, 338, 85
- Mucciarelli et al. (2008) Mucciarelli, A., Carretta, E., Origlia, L., & Ferraro, F. R., 2008, AJ, 136, 375
- Olszewski et al. (1991) Olszewski, E. W., Schommer, R. A., Suntzeff, N. B. & Harris, H. C., 1991, AJ, 101, 515
- Persson et al. (1983) Persson, S. E., et al., 1983
- Ramirez & Cohen. (2002) Ramirez, S. V., & Cohen, J., 2002, AJ, 123, 3277
- Renzini et al. (2008) Renzini, A., 2008, MNRAS, 122, 1429
- Sneden et al. (1997) Sneden, C., et al., 1997, AJ, 391, 354
- Sneden et al. (2004) Sneden, C., et al., 2004, AJ, 127, 2162
- Unsold (1955) Unsold, A., 1955, Physik der Sternatmoshparen
- Ventura et al. (2001) Ventura, P., D’Antona, F., Mazzitelli, I., & Gratton, R., 2001, ApJ, 550L, 65
- Ventura & D’Antona (2008) Ventura, P., & D’Antona, F., 2008, MNRAS, 385, 2034
- Yong et al. (2008) Yong, D., Grundahl, F., Johnson, J. A., & Asplund, M., 2008, ApJ, 684, 1159
| El. | E.P. | log gf | 1786-978 | 1786-1248 | 1786-1321 | 1786-1436 | 1786-1501 | 1786-2310 | |
|---|---|---|---|---|---|---|---|---|---|
| () | (eV) | (m) | (m) | (m) | (m) | (m) | (m) | ||
| O I | 6300.31 | 0.00 | -9.75 | syn | syn | syn | syn | syn | syn |
| O I | 6363.79 | 0.02 | -10.25 | syn | syn | syn | syn | syn | syn |
| Na I | 5682.65 | 2.10 | -0.67 | 26.0 | 17.9 | 10.0 | 0.0 | 47.8 | 58.2 |
| Na I | 5688.22 | 2.10 | -0.37 | 63.0 | 34.4 | 24.2 | 22.2 | 77.0 | 78.0 |
| Na I | 6154.23 | 2.10 | -1.57 | 0.0 | 0.0 | 0.0 | 0.0 | 9.3 | 0.0 |
| Na I | 6160.75 | 2.10 | -1.26 | 14.1 | 0.0 | 0.0 | 0.0 | 16.6 | 25.5 |
| Mg I | 5711.09 | 4.34 | -1.73 | 52.8 | 66.6 | 67.6 | 53.0 | 77.7 | 36.2 |
| Mg I | 6318.71 | 5.11 | -1.94 | 0.0 | 12.0 | 13.3 | 0.0 | 0.0 | 0.0 |
| ID | log g | [A/H] | [Fe/H] | [O/Fe] | [Na/Fe] | [Mg/Fe] | [Al/Fe] | spectrum | ||
|---|---|---|---|---|---|---|---|---|---|---|
| (K) | (dex) | (km ) | (dex) | (dex) | (dex) | (dex) | (dex) | |||
| SUN | 7.54 | 8.79 | 6.21 | 7.43 | 6.23 | |||||
| NGC 1786 | ||||||||||
| 978 | 4250 | 0.57 | –1.75 | 1.40 | –1.73 0.02 | –0.15 0.12 | 0.47 0.03 | 0.25 0.06 | — | G |
| 1248 | 4280 | 0.75 | –1.75 | 1.70 | –1.74 0.02 | 0.26 0.08 | 0.07 0.08 | 0.43 0.08 | 0.27 | U |
| 1321 | 4250 | 0.65 | –1.75 | 1.80 | –1.73 0.01 | 0.31 0.07 | –0.18 0.07 | 0.41 0.07 | 0.11 | U |
| 1436 | 4420 | 0.76 | –1.75 | 1.70 | –1.76 0.02 | 0.18 0.09 | –0.01 0.09 | 0.40 0.09 | — | G |
| 1501 | 4100 | 0.55 | –1.80 | 1.80 | –1.79 0.01 | 0.30 0.08 | 0.60 0.06 | 0.49 0.12 | 0.79 0.08 | U |
| 2310 | 4100 | 0.47 | –1.75 | 1.90 | –1.72 0.01 | –0.60 | 0.66 0.05 | –0.21 0.08 | 1.02 0.06 | U |
| 2418 | 4160 | 0.47 | –1.80 | 1.50 | –1.75 0.02 | –0.40 | 0.77 0.03 | –0.31 0.07 | — | G |
| Average | –1.75 0.01 | –0.01 0.14 | 0.35 0.14 | 0.22 0.13 | 0.55 0.16 | |||||
| 0.02 | 0.37 | 0.36 | 0.34 | 0.43 | ||||||
| NGC 2210 | ||||||||||
| 122 | 4300 | 0.60 | –1.65 | 1.70 | –1.66 0.02 | 0.31 0.08 | –0.08 0.11 | 0.39 0.11 | 0.54 | U |
| 309 | 4250 | 0.55 | –1.70 | 1.80 | –1.69 0.03 | 0.10 0.14 | 0.69 0.10 | 0.20 0.14 | 0.80 0.14 | U |
| 431 | 4200 | 0.70 | –1.65 | 1.80 | –1.67 0.02 | 0.12 0.11 | 0.64 0.07 | 0.33 0.12 | 0.55 0.08 | U |
| 764 | 4270 | 0.60 | –1.60 | 1.90 | –1.58 0.02 | 0.25 0.10 | 0.32 0.10 | 0.43 0.14 | 0.30 | U |
| 1181 | 4200 | 0.60 | –1.60 | 1.80 | –1.64 0.02 | 0.27 0.08 | –0.03 0.08 | 0.28 0.11 | 0.20 | U |
| Average | –1.65 0.02 | 0.21 0.04 | 0.31 0.16 | 0.33 0.04 | 0.48 0.10 | |||||
| 0.04 | 0.09 | 0.36 | 0.09 | 0.23 | ||||||
| NGC 2257 | ||||||||||
| 136 | 4290 | 0.65 | –1.90 | 1.95 | –1.94 0.02 | 0.22 0.11 | 0.20 0.11 | 0.34 0.11 | 0.88 0.11 | U |
| 189 | 4290 | 0.61 | –1.90 | 1.60 | –1.92 0.02 | –0.20 | 0.49 0.07 | 0.42 0.10 | — | G |
| 295 | 4360 | 0.96 | –2.00 | 1.50 | –1.95 0.03 | 0.24 0.18 | 0.58 0.10 | 0.12 0.18 | 1.17 0.18 | U |
| 586 | 4480 | 0.82 | –2.00 | 1.50 | –1.92 0.03 | –0.20 | 0.22 0.08 | 0.36 0.11 | — | G |
| 842 | 4320 | 0.95 | –1.90 | 1.50 | –1.96 0.02 | –0.08 0.15 | 0.54 0.10 | 0.52 0.15 | 0.68 | U |
| 993 | 4200 | 0.52 | –2.00 | 1.50 | –2.02 0.03 | –0.20 | 0.90 0.09 | 0.24 0.13 | — | G |
| Average | –1.95 0.02 | –0.04 0.08 | 0.49 0.11 | 0.33 0.06 | 0.91 0.10 | |||||
| 0.04 | 0.21 | 0.26 | 0.14 | 0.25 |