Thermal expansion of LaFeAsO: Evidence for high-temperature fluctuations
Abstract
We present measurements of the thermal expansion coefficient of polycrystalline LaFeAsO1-xFx (). The magnetic and structural transitions of the samples with give rise to large anomalies in , while the onset of superconductivity in the crystals with is not resolved. Above the structural transition, the thermal expansion coefficient of LaFeAsO is significantly enhanced. This is attributed to fluctuations, which also affect the electrical transport properties of the compound. The complete absence of these fluctuations in the superconducting samples even for is taken as evidence for an abrupt first-order type of suppression of the structural and magnetic transitions upon F doping.
pacs:
65.40.De,74.25.Bt,75.30.FvI Introduction
The family of layered -materials has been extensively studied since the discovery of superconductivity with transition temperatures up to 28 K in LaFeAsO1-xFx. Kamihara et al. (2008) In the meantime, has been increased to above 50 K Chen et al. (2008); Cheng et al. (2008); Liu et al. (2008); Ren et al. (2008a, b) by replacing La with other rare earths. Superconductivity has also been found in several related materials, such as Ba1-xKxFe2As2, Rotter et al. (2008a) LiFeAs, Pitcher et al. (2008); Tapp et al. (2008) or FeSe. Hsu et al. (2008) Interestingly, the evolution of superconductivity in LaFeAsO1-xFx seems to be related to the suppression of a magnetically ordered orthorhombic phase, which has been found in the undoped parent compound. Luetkens et al. (2008, 2009) In LaFeAsO, long range magnetic order probably of a spin density wave (SDW) type evolves below 137 K, de la Cruz et al. (2008); Klauss et al. (2008) while an orthorhombic distortion of the tetragonal high temperature phase has been observed at 156 K. The SDW ground state has also been established for isostructural Rare Earth (R) based , Drew et al. (2009) and even in the parent materials of other iron-pnictide superconductors such as with a different crystal structure but similar layers. Rotter et al. (2008b, a, c) However, while the structural and magnetic phase transitions are separated by about 20 K in the RFeAsO systems, they coincide for compounds of AFe2As2 type.
In this paper, we investigate polycrystalline LaFeAsO1-xFx () by means of thermal expansion measurements which sensitively probe the volume changes of the material. Large anomalies of the coefficient of linear thermal expansion are found at the structural and magnetic transitions of the samples with . For comparison we studied superconducting LaFeAsO1-xFx with , which exhibits neither the structural nor the magnetic phase transition. Interestingly, strong differences between the curves for the magnetic and the superconducting samples extend to temperatures well above the structural transition. We analyze these findings in view of our specific heat, X-ray diffraction and resistivity data. Our data provide clear evidence for strong fluctuations in LaFeAsO1-xFx () over a large range above the structural transition temperature . By contrast, no indication of fluctuations is found in the superconducting samples. We discuss the implications for the phase diagram of LaFeAsO1-xFx, particularly at the crossover from a magnetic to a superconducting ground state.
II Experimental Methods
The preparation and characterization of our polycrystalline samples has been described in detail in Ref. Kondrat et al., 2008. For the thermal expansion measurement a three-terminal capacitance dilatometer was utilized, which allows an accurate study of crystal length changes. To be specific, we measured the macroscopic length of the samples and calculated the coefficient of linear thermal expansion , which is the first temperature derivative of . The specific heat was studied in a Quantum Design PPMS by means of a relaxation technique. Electrical resistivity measurements were performed using a standard four-probe technique.
III Results
Figure 1 shows the linear thermal expansion coefficient of LaFeAsO between 5 K and 300 K. In the whole investigated temperature range, is found to be positive. This is in agreement with X-ray diffraction (XRD) data, which revealed a monotonically increasing lattice volume upon heating. Kondrat et al. (2008) For our polycrystalline samples the volume expansion coefficient is given as . Taking the volume at 300 K as an initial value we calculated the temperature dependence , which agrees with the unit-cell volume determined from XRD data published in Kondrat et al., 2008 (cf. inset of Fig. 2a). Below 30 K a small plateau is seen in our data, which is also present for the F-doped samples discussed below. The origin of this structure is unclear. However, it does not affect the discussion of our data, which focusses on the temperature region above 100 K.
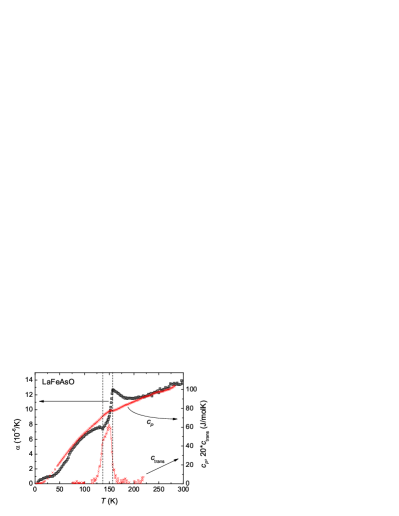
In Fig. 1, of LaOFeAs is shown in comparison to specific heat data . Below 120 K and above 200 K, roughly tracks the temperature dependence of , indicating an only weakly -dependent Grüneisen ratio . This observation implies a single energy scale in this temperature range and agrees to the assumption that mainly phonon degrees of freedom are relevant. Around 150 K both quantities exhibit anomalous contributions, which do not obey a Grüneisen scaling. The thermal expansion coefficient exhibits two huge anomalies with opposite sign, while the specific heat evolves rather smoothly with a small additional contribution, as will be discussed below. The anomalies in can be attributed to the structural and SDW transitions of the compound. The transition temperatures determined from the positions of the extrema are 137 K and 157 K, respectively. These values are close to those found in many other properties on the same samples, such as XRD, resistivity, magnetic susceptibility, Kondrat et al. (2008) SR, and Mössbauer spectroscopy. Klauss et al. (2008); Luetkens et al. (2009) Both transitions are also visible in the specific heat data, which signals anomalous entropy changes in this temperature regime. The anomalous specific heat can be determined by subtracting the phononic and electronic background estimated from a polynomial approximation of the data well above ( K) and below ( K) the transitions. Klingeler et al. (2002) The result of such a procedure is shown in Fig. 1 on an enhanced scale, where the two anomalies at and , respectively, are clearly visible.
The SDW formation at = 137 K generates a negative anomaly in the thermal expansion coefficient. For a second order phase transition, the slope can be determined from the jump height at in the specific heat and the volume thermal expansion coefficient using the Ehrenfest relation
| (1) |
with the molar volume . However, for the given compound a determination of and is not possible with satisfactory accuracy, due to the proximity of the structural and SDW transitions. Nevertheless, according to Equation 1 the negative anomaly in at qualitatively clearly implies a negative hydrostatic pressure dependence of . This finding is in line with resistivity investigations on LaFeAsO showing a lowering of under pressure with an initial slope of K/kbar. Okada et al. (2008)
Contrary to the magnetic ordering, the structural transition at = 157 K gives rise to a positive anomaly in . This anomaly is very broad, extending to temperatures far above . Extrinsic effects, in particular those originating from grain boundaries, cannot cause this broadening. The grain size of our polycrystalline material has been determined from electron microscopy to be some tens of micrometer.Kondrat et al. (2008) This renders a major contribution from grain boundaries to the thermal expansion coefficient as observed occasionally in nanocrystalline materialWagner (1992) unlikely. Moreover, while the grain size is rather unaffected by F-doping the width of the anomaly at changes systematically upon substitution of O by F, as shown below, which also confirms the intrinsic nature of the broadening. By contrast, the corresponding anomaly in is sharp, which excludes also the possibility of a smeared transition, e.g. due to sample inhomogeneities, as origin of the broadening. A sharp anomaly is likewise visible in our previously published data. Klauss et al. (2008) Specific heat, magnetization, and XRD data indicate a second order phase transition at . Therefore, one expects a jump in the thermal expansion coefficient at the phase transition. From our data it is however not possible to determine the anomalous volume changes at the transition itself so that an analysis even of the sign of the pressure dependence is hardly possible.
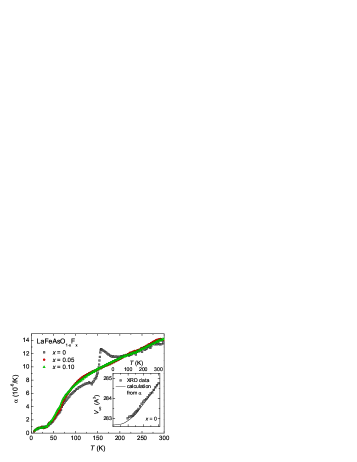
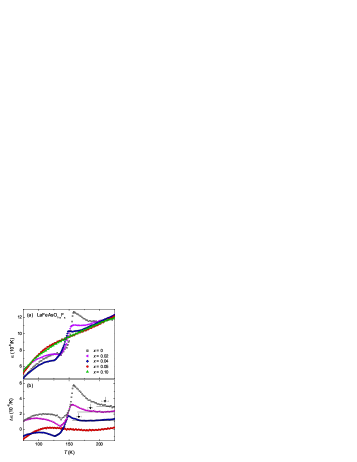
In order to understand the behavior of of LaFeAsO above we studied the linear thermal expansion coefficient of LaFeAsO1-xFx with nominal . Upon fluorine substitution for the structural and magnetic phase transitions are only weakly affected, i.e. they are slightly shifted to lower temperatures. At higher F content both transitions are completely suppressed, and a superconducting ground state is found. Luetkens et al. (2009) Thus, F doping strongly affects the electronic properties of the series, especially at low temperatures, as well as the structural properties below . By contrast, the properties of the atomic lattice above , such as the phonon spectrum, are expected to be relatively insensitive to the fluorine content. Figure 2 compares the coefficient of linear thermal expansion of LaFeAsO1-xFx for different F content . An enhanced view of the region between 80 K and 220 K for all investigated F concentrations is shown in Fig. 3a. Upon F doping with , the anomalies arising from the magnetic and structural transitions are shifted to lower temperatures, as expected from the lowering of and . For these transitions are suppressed. At high ( K) and low ( K) temperatures, is almost independent of the composition. In particular, the superconducting transitions at K () and K (), which are clearly visible in the resistivity, are not seen in . Although our data in this temperature range are influenced by the small plateau of unknown origin, the existence of large anomalies at appears unlikely given the close agreement of the curves for different F content. Regarding the range above the structural transition of LaFeAsO1-xFx, Fig.3a clearly reveals a significantly enhanced for the magnetic samples compared to the superconducting ones. This difference cannot be explained by a simple change of the phonon spectrum upon F doping due to the larger atomic mass of fluorine compared to oxygen, since the samples with x = 0.05 and 0.1 exhibit almost identical curves. Instead, the enhanced for suggests the presence of strong fluctuations preceding the structural transitions at .
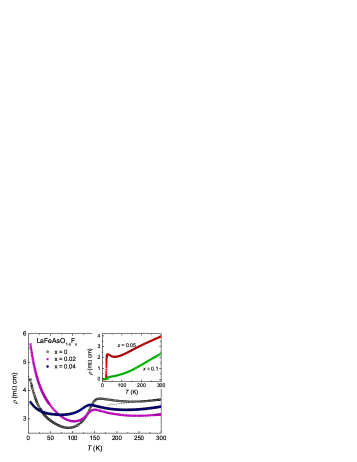
Indications for fluctuations are also found in the electrical transport properties of LaFeAsO1-xFx. Figure 4 shows the electrical resistivities for taken from Ref. Hess et al., 2008. At room temperature all samples exhibit metal-like resistivities with a positive slope . Upon cooling, the resistivities of the superconducting samples continue to decrease, except for an upturn just above the superconducting transition for , the origin of which is still not clear. Transitions to a superconducting state are found at K () and K (). By contrast, the resistivities of LaFeAsO1-xFx () increase below approximately 230 K and reach maxima at . This negative temperature dependence indicates enhanced scattering of charge carriers from fluctuations above . Consistently, below the transition, drops as the fluctuations die away.
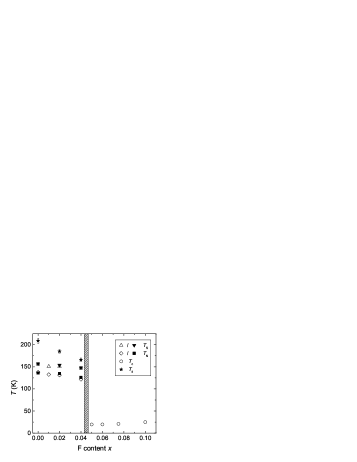
In Fig. 5 we plot the characteristic temperatures obtained from our thermal expansion measurements in the phase diagram of LaFeAsO1-xFx established from magnetic susceptibility, SR and resistivity experiments.Klingeler et al. (2008); Luetkens et al. (2009); Hess et al. (2008) The values for and taken as the positions of the extrema in fit well into this phase diagram. In addition we plot the temperature , below which indications for fluctuations are found in the thermal expansion coefficent. For this purpose the data for have been subtracted from for . The results are shown in Fig. 3b as vs. , whereas the curves have been shifted by multiples of K. For , is determined as the temperature, below which exhibits a negative slope. With increasing fluorine content, is lowered. Extrapolating and linearly to higher would suggest a vanishing of the fluctuation regime around . Nevertheless, already for the sample with no indication of fluctuations is found in .
IV Discussion
The linear thermal expansion coefficient turned out a very sensitive probe for the phase transitions in LaFeAsO1-xFx (). Large positive and negative anomalies are found in at and , respectively. By contrast, the small changes of the unit-cell volume related to and cannot be resolved directly from XRD measurements. Nevertheless, the close agreement between the curves for LaFeAsO determined from XRD and shown in the inset to Fig. 2a confirms the reliability of our thermal expansion data. The sizeable jumps in at reflect the strong coupling of the magnetic transition to the crystal lattice. The shape of the anomalies deviates from the one expected for second-order phase transitions, which is attributed to the closeness of the transitions and a contribution from fluctuations above . So far, the origin of these fluctuations is unknown. A straightforward interpretation is to attribute them to a competing instability in vicinity to the actual ground state. One might speculate that this instability is of magnetic origin as suggested in Ref. Lorenzana et al., 2008. Based on a Hartree-Fock approximation and a Landau theory, Lorenzana et al. find an orthomagnetic phase competing to the modulated magnetic stripes which are experimentally observed. Lorenzana et al. (2008) In this scenario, long range order of the competing, possibly magnetic phase is hindered by the orthorhombic distortion, whereas the increase of the corresponding anomalous positive contribution to the thermal expansion coefficient is truncated by the structural transition at . Another model that accounts for the anomalous thermal expansion coefficient above comprises ferro-orbital ordering accompanied by a lattice distortion at . C.-C. Lee (2009) In this picture, the enhanced is suggested to arise from short-range orbital correlations above . Interestingly, the experimentally observed onset temperature of the short range order strongly depends on the F-content. As visible in Fig. 5(b), the fluctuation regime is much stronger suppressed for larger than and . Further investigations are necessary to determine the exact nature of the fluctuations above .
In contrast to the structural and SDW transitions, the superconducting transitions of LaFeAsO1-xFx with and 0.1 are not seen in . The expected magnitude of can be estimated from Eq. 1 using literature data. No anomaly was observed at in the specific heat of LaFeAsO1-xFx. Mu et al. (2008) As a rough estimate we take the difference of the curves measured in 0 T and 9 T on LaFeAsO0.9F0.1-δ of 5 mJ/mole K2. The derivative of LaFeAsO0.89F0.11 was found to be of the order of 3 K/GPa. Takahashi et al. (2008) Thus, the anomaly in is estimated to /K. This value, which is too small to be resolved with our setup, is in line with the absence of large anomalies in at . However, it should be noted, that we measure a directional average of the coefficient of linear thermal expansion on our polycrystalline samples which is associated to the hydrostatic pressure dependence. An almost complete cancellation of the contributions for different crystallographic directions was observed on single crystals with the related ThCr2Si2 structure, namely Ba(Fe0.88Co0.12)2As2. Hardy et al. (2009) Measurements on single crystals of LaFeAsO1-xFx are therefore necessary to decide, whether the small magnitude of is due to a similar effect.
The superconducting ground state in the sample is formed at the expense of an abrupt suppression of the structural and magnetic phase transitions observed in samples with . The change from the magnetically ordered to the superconducting ground state upon F doping has been proposed to be abrupt first-order-like. Luetkens et al. (2009); Hess et al. (2008) Our thermal expansion data clearly support this picture. While fluctuations give rise to an enhanced thermal expansion coefficient over an extended region for the sample with , no indication of fluctuations is found for . Instead, the thermal expansion coefficient of this sample is almost identical to the one for , which lies well in the superconducting regime of the phase diagram. Moreover, the disappearance of the fluctuation regime around cannot be explained by a smooth convergence of and with increasing F content, as seen from the phase diagram Fig. 5b. Therefore, our data corroborate a first-order-like scenario for the transition towards superconductivity upon doping.
V Summary
We performed measurements of the linear thermal expansion coefficient of LaFeAsO1-xFx with in the temperature range between 5 K and 300 K. The structural and SDW transitions of the compounds with low F content give rise to large anomalies in , whereas fluctuations are present also well above . By contrast, the superconducting transitions of the samples with are not observable. Moreover, no indications for residual fluctuations in the superconducting samples are found at elevated temperatures, not even at the lowest F content . This finding supports the idea of an abrupt first-order type transition between the magnetic and superconducting ground states upon fluorine substitution.
Acknowledgements.
We thank M. Deutschmann, S. Müller-Litvanyi, R. Müller, J. Werner, and S. Gaß for technical support. This work has been supported by the Deutsche Forschungsgemeinschaft, through BE1749/12 and through FOR 538 (BU887/4).References
- Kamihara et al. [2008] Y. Kamihara, T. Watanabe, M. Hirano, and H. Hosono. J. Am. Chem. Soc., 130(11):3296, 2008.
- Chen et al. [2008] X. H. Chen, T. Wu, G. Wu, R. H. Liu, H. Chen, and D. F. Fang. Nature, 453(7196):761, 2008.
- Cheng et al. [2008] P. Cheng, L. Fang, H. Yang, X. Zhu, G. Mu, H. Luo, Z. Wang, and H.-H. Wen. Science in China G, 51(6):719, 2008.
- Liu et al. [2008] R. H. Liu, G. Wu, T. Wu, D. F. Fang, H. Chen, S. Y. Li, K. Liu, Y. L. Xie, X. F. Wang, R. L. Yang, L. Ding, C. He, D. L. Feng, and X. H. Chen. Phys. Rev. Lett., 101:087001, 2008.
- Ren et al. [2008a] Z.-A. Ren, J. Yang, W. Lu, W. Yi, G.-C. Che, X.-L. Dong, L.-L. Sun, and Z.-X. Zhao. arXiv:0803.4283, 2008a.
- Ren et al. [2008b] Z.-A. Ren, W. Lu, J. Yang, W. Yi, X.-L. Shen, Z.-C. Li, G.-C. Che, X.-L. Dong, L.-L. Sun, F. Zhou, and Z.-X. Zhao. Chin. Phys. Lett., 25:2215, 2008b.
- Rotter et al. [2008a] M. Rotter, M. Tegel, and D. Johrendt. Phys. Rev. Lett., 101:107006, 2008a.
- Pitcher et al. [2008] M. J. Pitcher, D. R. Parker, P. Adamson, S. J. C. Herkelrath, A. T. Boothroyd, and S. J. Clarke. Chem. Commun., page 5918, 2008.
- Tapp et al. [2008] J. H. Tapp, Z. Tang, B. Lv, K. Sasmal, B. Lorenz, P. C. W. Chu, and A. M. Guloy. Phys. Rev. B, 78:060505(R), 2008.
- Hsu et al. [2008] F.-C. Hsu, J.-Y. Luo, K.-W. Yeh, T.-K. Chen, T.-W. Huang, P. M. Wu, Y.-C. Lee, Y.-L. Huang, Y.-Y. Chu, D.-C. Yan, and M.-K. Wu. arXiv:0807.2369, 2008.
- Luetkens et al. [2008] H. Luetkens, H.-H. Klauss, R. Khasanov, A. Amato, R. Klingeler, I. Hellmann, N. Leps, A. Kondrat, C. Hess, A. Köhler, G. Behr, J. Werner, and B. Büchner. Phys. Rev. Lett., 101:097009, 2008.
- Luetkens et al. [2009] H. Luetkens, H.-H. Klauss, M. Kraken, F. J. Litterst, T. Dellmann, R. Klingeler, C. Hess, R. Khasanov, A. Amato, C. Baines, M. Kosmala, O. J. Schumann, M. Braden, J. Hamann-Borrero, N. Leps, A. Kondrat, G. Behr, J. Werner, and B. Büchner. Nature Materials, doi:10.1038/nmat2397, 2009.
- de la Cruz et al. [2008] C. de la Cruz, Q. Huang, J. W. Lynn, J. Li, W. Ratcliff II, J. L. Zarestky, H. A. Mook, G. F. Chen, J. L. Luo, N. L. Wang, and P. Dai. Nature, 453:899, 2008.
- Klauss et al. [2008] H.-H. Klauss, H. Luetkens, R. Klingeler, C. Hess, F. J. Litterst, M. Kraken, M. M. Korshunov, I. Eremin, S.-L. Drechsler, R. Khasanov, A. Amato, J. Hamann-Borrero, N. Leps, A. Kondrat, G. Behr, J. Werner, and B. Büchner. Phys. Rev. Lett., 101:077005, 2008.
- Drew et al. [2009] A. J. Drew, Ch. Niedermayer, P. J. Baker, F. L. Pratt, S. J. Blundell, T. Lancaster, R. H. Liu, G. Wu, X. H. Chen, I. Watanabe, V. K. Malik, A. Dubroka, M. Rössle, K. W. Kim, C. Baines, and C. Bernhard. Nature Materials, doi:10.1038/nmat2396, 2009.
- Rotter et al. [2008b] M. Rotter, M. Pangerl, M. Tegel, and D. Johrendt. Angew. Chem., 47:7949, 2008b.
- Rotter et al. [2008c] M. Rotter, M. Tegel, D. Johrendt, I. Schellenberg, W. Hermes, and R. Pöttgen. Phys. Rev. B, 78:020503, 2008c.
- Kondrat et al. [2008] A. Kondrat, J. E. Hamann-Borrero, N. Leps, M. Kosmala, O. Schumann, J. Werner, G. Behr, M. Braden, R. Klingeler, B. Büchner, and C. Hess. arXiv:0811.4436, 2008.
- Klingeler et al. [2002] R. Klingeler, J. Geck, R. Gross, L. Pinsard-Gaudart, A. Revcolevschi, S. Uhlenbruck, and B. Büchner. Phys. Rev. B, 65:174404, 2002.
- Okada et al. [2008] H. Okada, K. Igawa, H. Takahashi, Y. Kamihara, M. Hirano, H. Hosono, K. Matsubayashi, and Y. Uwatoko. Superconductivity under high pressure in LaFeAsO. J. Phys. Soc. Jpn., 77(11):113712, 2008.
- Wagner [1992] M. Wagner. Phys. Rev. B, 45:635, 1992.
- Hess et al. [2008] C. Hess, A. Kondrat, A. Narduzzo, J. E. Hamann-Borrero, R. Klingeler, J. Werner, G. Behr, and B. Büchner. arXiv:0811.1601, 2008.
- Klingeler et al. [2008] R. Klingeler, N. Leps, I. Hellmann, A. Popa, C. Hess, A. Kondrat, J. Hamann-Borrero, G. Behr, V. Kataev, and B. Büchner. arXiv:0808.0708, 2008.
- Lorenzana et al. [2008] J. Lorenzana, G. Seibold, C. Ortix, and M. Grilli. Phys. Rev. Lett., 101:186402, 2008.
- C.-C. Lee [2009] W. Ku C.-C. Lee, W.-G. Yin. arXiv:0905.2957, 2009.
- Mu et al. [2008] G. Mu, X. Zhu, L. Fang, L. Shan, C. Ren, and H.-H. Wen. Chin.Phys.Lett., 25:2221, 2008.
- Takahashi et al. [2008] H. Takahashi, K. Igawa, K. Arii, Y. Kamihara, M. Hirano, and H. Hosono. Nature, 453(7193):376, 2008.
- Hardy et al. [2009] F. Hardy, P. Adelmann, T. Wolf, H. v. Löhneysen, and C. Meingast. Phys. Rev. Lett., 102:187004, 2009.