Epitaxy, stoichiometry, and magnetic properties of Gd–doped EuO films on YSZ (001)
Abstract
We have succeeded in preparing high-quality Gd–doped single–crystalline EuO films. Using Eu–distillation–assisted molecular beam epitaxy and a systematic variation in the Gd and oxygen deposition rates, we have been able to observe sustained layer–by–layer epitaxial growth on yttria–stabilized cubic zirconia (001). The presence of Gd helps to stabilize the layer–by–layer growth mode. We used soft x–ray absorption spectroscopy at the Eu and Gd edges to confirm the absence of Eu3+ contaminants and to determine the actual Gd concentration. The distillation process ensures the absence of oxygen vacancies in the films. From magnetization measurements we found the Curie temperature to increase smoothly as a function of doping from 70 K up to a maximum of 125 K. A threshold behavior was not observed for concentrations as low as 0.2%.
pacs:
68.55.–a, 75.70.Ak, 78.70.Dm, 79.60.Dp, 81.15.HiI Introduction
Renewed research interest in europium oxide (EuO) thin films has been arising in recent years with the goal to utilize its extraordinary properties for spintronic applications.schmehl07a ; panguluri08a ; santos08a At room–temperature stoichiometric bulk EuO is a paramagnetic semiconductor with a band gap of about 1.2 eV and upon cooling, it orders ferromagnetically with a Curie temperature () of 69 K.mauger86a ; tsuda91a In the ferromagnetic state, the spin–up and spin–down conduction bands experience a rather large splitting of about 0.6 eV due to the indirect exchange interaction between the magnetic moment of the localized Eu2+ electrons and the delocalized – ones.steeneken02a It has been inferred that, owing to this spin–splitting of the conduction band, extra electrons introduced in EuO will be practically 100% spin polarized,steeneken02a and it was recently demonstrated that this is indeed the case for lanthanum–doped EuO1-x.schmehl07a
Another eyes catching property of EuO is that the can be significantly enhanced by electron doping, for instance, by substituting the Eu with trivalent rare earths.mauger86a ; tsuda91a Numerous studies have been carried out to characterize and optimize the doping–induced magnetic properties. The results, however, vary appreciably. For Gd–doped EuO, for example, the reported optimum value ranges from 115 to 148 K,shafer68a ; ahn68a ; samokhvalov72a ; samokhvalov74a ; schoenes74a ; mauger78a ; meier79a ; godart80a ; mauger80a ; rho02a ; matsumoto04a and even up to 170 K.ott06a The temperature dependence of the magnetization also differs from report to report, most of them showing very little resemblance to a Brillouin function as expected for a Heisenberg system. It is also not clear whether a threshold of the Gd concentration (if any) exists for starts to increase.samokhvalov72a ; samokhvalov74a ; schoenes74a ; meier79a ; mauger80a ; rho02a ; matsumoto04a It was asserted that much of these uncertainties are probably caused by problems with stoichiometry.tsuda91a ; schoenes74a Indeed, oxygen deficiencies in Gd–free EuO samples already lead to enhancements of up to 140–150 K.massenet74a ; samokhvalov78a ; matsumoto04a In fact, it was also suggested that even the actual Gd concentration was not known accurately.tsuda91a
We have recently developed the so–called Eu–distillation–assisted molecular beam epitaxy (MBE) procedure to prepare single–crystalline and highly stoichiometric EuO thin films on yttria–stabilized cubic zirconia (YSZ) substrates.sutarto09a Our objective now is to use this procedure as a starting point for obtaining high quality Gd–doped EuO samples. In this study we will investigate in detail whether or not the Eu–distillation process indeed allows for the growth of Gd–doped films free from Eu3+ contaminants, oxygen vacancies, Eu metal clusters, and Gd2O3 phases as well. Concerning the growth process itself, we would like to know whether the layer–by–layer growth mode observed for pure EuO on YSZ can also be maintained in the presence of Gd co–deposition. We will use soft x–ray absorption spectroscopy at the Eu and Gd edges to obtain a reliable determination of the actual Gd concentration. Our goal is then to establish the magnetic properties of the Gd–doped EuO system using well–defined films.
II Experiment
The Gd–doped EuO films were grown in an ultra–high–vacuum (UHV) MBE facility with a base pressure of 210-10 mbar. Epi–polished YSZ single crystals from SurfaceNet GmbH were used as substrates. The substrate crystal structure is calcium–fluorite type and the surface normal of the substrate is the [001] direction. The lattice constant of YSZ is 5.142 Å,ingel86a ; yashima94a very close to the 5.144 Å value for EuO at room temperature.henrich94a Prior to growth, the YSZ substrates were annealed in situ at C in an oxygen atmosphere of mbar for at least 120 min in order to obtain clean and well-ordered substrate surfaces.

The films were prepared by simultaneously depositing Eu and Gd metals on top of YSZ substrates under oxygen atmosphere. High purity Eu metal from AMES Laboratory was sublimated from an EPI effusion cell with a BN crucible at temperatures between 525 and 545∘C. Gd metal from Smart–Elements Co. was evaporated from a commercial Luxel Corporation RADAK–I Knudsen cell with a molybdenum–insert containing Al2O3 crucible at temperatures between 1100 and 1350∘C. Proper degassing of the Eu and Gd materials ensured that during the film deposition the background pressure was kept below 510-9 mbar. The Eu–deposition rate of 8.1–8.2 Å/min and the Gd rate of 0.006–0.8 Å/min were calibrated using a quartz–crystal monitor, which was moved to the sample–growth position prior and after each growth. Molecular oxygen was supplied through a leak valve, and its pressure (4–1010-8 mbar) was monitored using an ion–gauge and a mass–spectrometer. The substrates were kept at C during growth and all films were grown for 100 min.
The MBE facility is equipped with the EK–35–R reflection high-energy electron diffraction (RHEED) system from STAIB Instruments for online monitoring of the in situ growth. The facility is connected to an UHV –metal photoemission chamber supplied with a Vacuum Generators Scientific T191 rear–view low–energy electron diffraction (LEED) system for further in situ structural characterization. The facility is also attached to a separate UHV chamber for the evaporation of aluminum as protective capping layer of the air–sensitive Gd–doped EuO films. It allows us to perform ex situ characterizations using x–ray reflectivity (XRR), superconducting quantum interference device (SQUID), and x–ray absorption spectroscopy (XAS). The XRR measurements were carried out using a Siemens D5000 diffractometer. The thicknesses of the films are about 200, 425, and 515 Å for the oxygen pressure of 4, 8, and 1010-8 mbar, respectively. The thickness of the aluminum capping is about 20–40 Å. The magnetic properties of the films were determined using a Quantum Design MPMS–XL7 SQUID magnetometer. The XAS measurements were performed at the Dragon beamline of the National Synchrotron Radiation Research Center (NSRRC) in Taiwan. The spectra were recorded using the total electron yield method and the photon–energy resolution at the Eu and Gd edges (–1235 eV) was set at 0.6 eV.

III Results and Discussion
III.1 Growth of Gd–doped EuO films
In situ RHEED was employed to monitor the growth quality of Gd–doped EuO thin films. The RHEED photograph of the clean and annealed YSZ (001) before growth is displayed in Fig. 1(a). Figures 1(b)–1(e) show the photographs of Gd–doped EuO films grown with Gd concentrations of (b) 0.2%, (c) 2.0%, (d) 7.7%, and (e) 20%. The films were prepared at 400∘C under an oxygen pressure of mbar and a Eu flux rate of 8.1–8.2 Å/min. The Gd flux rates were 0.006, 0.056, 0.51, and 0.7 Å/min for (b)–(e), respectively. We will describe later how the actual Gd concentration was determined using XAS at the Eu and Gd edges.
The important result is that epitaxial growth of Gd–doped EuO films has been achieved for a wide range of Gd concentrations, even up to 20% doping. The distance between the streaks of the Gd–doped EuO films is always very similar to that of the YSZ substrate, confirming that the in-plane lattice parameters of Gd–doped EuO and YSZ are closely matched. The sharp streaks in the RHEED patterns after 100 min of growth can be taken as an indication for the smoothness of the film surface.
We were also looking for RHEED intensity oscillations during the growth of the Gd–doped EuO films. Such oscillations then indicate the occurrence of a layer–by–layer growth mode, which is important to obtain high–quality smooth films. In our previous study on undoped EuO films grown on YSZ (001), we always observed five to six oscillations after the start of the growth.sutarto09a The oscillation period is determined by the Eu flux rate and is independent of the oxygen pressure (provided that it does not exceed a certain critical value above which Eu3+ could be formed). We found that this is a unique feature for the growth on YSZ, and we were able to attribute this phenomenon to the fact that the YSZ substrate acts as a source for oxygen, which very remarkably, is capable in oxidizing Eu to Eu2+ but not to Eu3+.sutarto09a The period was about 25 s for an Eu flux rate of 8.1–8.2 Å/min.sutarto09a Also here for the Gd–doped films we found five to six oscillations during the initial stages of growth. The period is approximately 26 s when the Gd concentration is very low, and decreases to 22 s for films containing 20% Gd, suggesting that the period is roughly inversely proportional to the sum of the Eu and Gd flux rates. These results provide a consistent picture in that the initial stages of growth are governed by the oxygen supply from the YSZ substrate.
With regard to sustained growth, we found in our previous studysutarto09a that long lasting RHEED intensity oscillations can be observed for undoped EuO films on YSZ (001), provided that the oxygen pressure in the MBE chamber is close but not exceeding the critical value above which Eu3+ ions are formed. The oscillation time is then no longer determined by the Eu flux rate, but by the oxygen pressure. The growth process, therefore, involves the re–evaporation of the excess Eu into the vacuum. Also here for the Gd–doped films we make use of this so–called Eu–distillation–assisted growth process. Again, using oxygen pressures slightly lower than the critical value, we are able to observe prolonged oscillations. Figure 2 shows the time dependence of the RHEED intensity of the specularly reflected beam during the deposition of a 1.0% Gd–doped EuO film. The initial five to six oscillations with the periods of 26 s are followed by numerous oscillations with a period of about 34.5 s for the entire duration of growth. This demonstrates that a Gd–doped EuO film can be prepared epitaxially in a layer–by–layer fashion.
We find those prolonged RHEED intensity oscillations to occur not only for the lowest Gd concentrations but also for concentrations as high as 8%. Although we have not carried out a systematic study, we have indications that the range of oxygen pressures for which the oscillations can be observed is larger for the Gd–doped EuO films than for the pure EuO. So it seems that the presence of Gd does help to stabilize the two–dimensional layer–by–layer growth mode. It is tempting to speculate that perhaps the Gd ions could act as nonmobile nucleation sites since the Gd vapor pressure is extremely low. Those nucleation sites then would increase the step density and make it oscillate for every formation of a new layer.
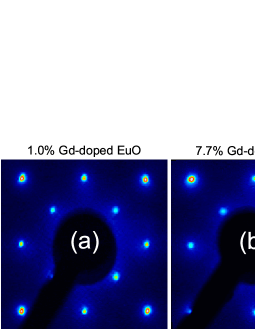
To check the surface structure, LEED experiments were performed after the growth of Gd–doped EuO films was completed. Figure 3 depicts examples of the LEED photographs of the films with Gd concentration of 1.0% for (a) and 7.7% for (b). The patterns were recorded at an electron beam energy of approximately 216 eV. Since these Gd–doped films are not as insulating as the pure EuO film,sutarto09a we were also able to record the LEED patterns at lower energies, down to about 98 eV (not shown). Figure 3 reveals a perfect (001) surface of the rock-salt structure, fully consistent with the RHEED results.
III.2 Stoichiometry and Gd concentration
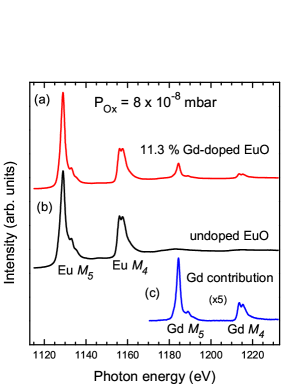
We have investigated the stoichiometry and Gd concentration of the Gd–doped EuO films using ex situ soft XAS measurements. XAS is an element–specific method that is very sensitive to chemical state of a probed ion.thole85a ; goedkoop88a Since Gd–doped EuO films are highly susceptible towards further oxidation in air, we have capped the films with a protective aluminum layer of 20–40 Å before taking them out of the MBE system and subsequent transport to the synchrotron facility.sutarto09a Figures 4(a) and 4(b) depict the Eu and Gd () XAS spectra of a 11.3% Gd–doped EuO film and an undoped EuO film, respectively. Both films show identical line shapes in their Eu spectra. Comparing to the theoretical spectra of Eu2+ and Eu3+,thole85a ; goedkoop88a we can directly conclude that the experimental spectra represent exclusively Eu2+ ions. There are no extra peaks or shoulders which otherwise could indicate the presence of Eu3+ species.panguluri08a ; santos08a We have also carried out XAS measurements on films with other Gd concentrations, and can confirm that our films are completely free from Eu3+ contaminants.
The Gd spectrum has all the characteristics of a transition,thole85a ; goedkoop88a ; rudolf92a similar to that of the Eu2+ one. Thus, having an identical 4 configuration and very similar spectral line shapes as well as photoabsorption cross–sections, we can use the XAS as a simple and reliable method to deduce the Gd concentration in the films.ott06a Figure 4(c) shows the net contribution of the Gd spectrum after subtracting the extended x–ray absorption fine structure (EXAFS) of the undoped EuO [Fig. 4(b)] from the Gd–doped EuO [Fig. 4(a)] spectrum in the Gd energy range. The Gd spectrum is displayed with a magnification of a factor of 5 for clarity. Now one can directly see that the Eu and Gd spectral line shapes are indeed identical. Furthermore, a Gd/Eu ratio is obtained by dividing the integrated Gd and Eu intensities. In the example of Fig. 4, a Gd/Eu ratio of 12.7% is extracted, corresponding to a Gd concentration of = 11.3% in the Eu1-xGdxO chemical formula.
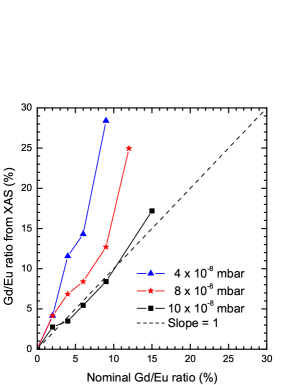
We will now address the important issue concerning the relationship between the actual Gd/Eu ratio in the films as determined from the XAS experiments and the nominal Gd/Eu flux rate ratio during the preparation, as measured by the quartz–crystal monitor. We have discovered the actual Gd/Eu ratio can deviate strongly from the nominal one depending on the oxygen pressure used and the flux of Gd deposited. Figure 5 displays an overview of our extensive investigation. One can clearly see that the deviation is largest for films grown under low oxygen pressures ( mbar) or films having the highest Gd concentrations. Only for films with not too high Gd concentrations and prepared with the oxygen pressure tuned close to the critical value ( mbar), one can find that the actual and nominal Gd/Eu ratios match. These observations can be well related to the fact that the growth rate is limited by the oxygen pressure. While the Eu can be readily re–evaporated into the vacuum from a substrate at a temperature of 400∘C, the Gd can not since it has a much lower vapor pressure. When the sum of the Gd and Eu fluxes exceeds that of the oxygen, it will be the Eu which has to accommodate for the excess, and thus alter the Gd/Eu ratio.
The oxygen pressure dependence of the actual Gd/Eu ratio can also be taken as yet another confirmation for the occurrence of the Eu–distillation process.sutarto09a This distillation process is crucial to avoid the accidental formation of oxygen deficiencies during growth. The existence of a critical oxygen pressure and its value can also be directly deduced from the fact that there are data points which lie on the slope = 1 line in Fig. 5. Moreover, these data points taken at the critical oxygen pressure demonstrate that the XAS method is very consistent with the flux–rate method for the determination of the Gd/Eu ratio. This in turn adds to the credibility of the XAS as a reliable quantitative method to determine the actual Gd concentration in also other growth conditions.
III.3 Magnetic properties
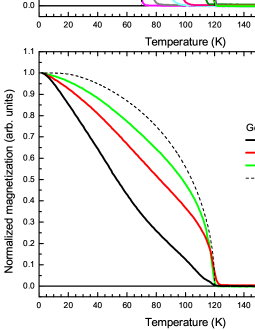
After having shown that Gd–doped EuO films can be grown with excellent crystallinity and control of composition, we now focus our attention on their magnetic properties. Figure 6 depicts the normalized magnetization of a series of Gd–doped EuO films under an applied magnetic field of 10 G. Starting with the undoped film, we observe that it has a of 70 K, identical to that of bulk EuO. The shape of the magnetization curve also follows the standard Brillouin function quite well, typical for the undoped bulk EuO.mauger86a Upon Gd doping, the increases but the shape of the magnetization curve deviates strongly from the Brillouin function. The reaches a maximum of 125 K at 6.5% doping. For a Gd concentration of 7.7%, the magnetization curve comes again closer to the Brillouin function. The is slightly lower, i.e., 121 K. Further doping with Gd up to 20% results in a complete departure of the magnetization curves from the Brillouin function, as displayed in Fig. 6(b), but remains 120 K.
The dependence on the Gd concentration is presented in more detail in Fig. 7. We note that the Gd concentration is the actual concentration in the film as determined by the XAS method, and not the nominal one based on Gd/Eu flux–rate ratios. An important result which can be read from Fig. 7 is that only a tiny amount of Gd concentration is needed to enhance directly the . In this respect we cannot confirm the claim made in the past that the starts only to increase if the Gd concentration exceeds a threshold value of about 1.2%–1.5%.samokhvalov72a ; samokhvalov74a ; mauger80a It is not clear why the experimental findings are so different. We can only speculate that in those older studies perhaps not all of the inserted Gd were substitutional to the Eu and that part of the Gd could be in the form of, for example, Gd2O3, and thus not contributing as dopants. In our case we have made the films under Eu–distillation conditions, i.e., shortage of oxygen, so that it is very unlikely that Gd2O3 can be formed. In fact, some other studies were also not able to detect the existence of such a threshold value.schoenes74a ; matsumoto04a
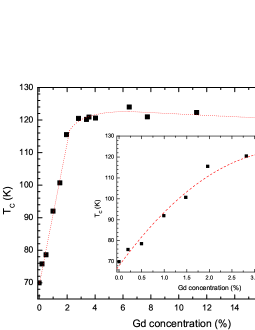
Another important result of Fig. 7 is that the maximum value for with Gd doping is 125 K. We cannot reproduce the higher values (e.g., 130–170 K) reported in the literature.shafer68a ; ahn68a ; samokhvalov72a ; samokhvalov74a ; mauger78a ; meier79a ; godart80a ; mauger80a ; ott06a It was inferred that stoichiometry problems could add to an extra increase in .tsuda91a ; schoenes74a In this respect it is interesting to note that indeed oxygen deficiencies in Gd–free EuO samples already lead to enhancements of up to 140–150 K.massenet74a ; samokhvalov78a ; matsumoto04a In our case we can exclude the presence of oxygen vacancies: the samples all were grown under Eu–distillation conditions, and under these conditions we have observed for the pure EuO films that they have the bulk value of 69 K and that they remain semiconducting and are, in fact, extremely insulating down to the lowest temperatures.sutarto09a
Our experimental finding of a smooth enhancement of as a function of Gd concentration is in qualitative agreement with recent mean–field theoretical models.ingle08a ; arnold08a Nevertheless, the magnetization curves deviate strongly from the Brillouin function upon doping, with the 7.7% composition showing the smallest deviation. Such deviations could indicate the presence of phase separation. To investigate this phenomenon in more detail, we present in Fig. 8 the temperature derivative of the magnetization curves for the undoped EuO film and for the 1.5% and 7.7% Gd–doped EuO films. One can clearly see sharp features at 69 K for the undoped film and at about 120 K for the 7.7% composition, indicating their relative homogeneity and corresponding ’s. For the 1.5% sample, on the other hand, one can clearly distinguish two features. Not only there is a structure at approximately 100 K, marking the of this film, but there is also a peak at roughly 73 K, which is close to the of the undoped material.
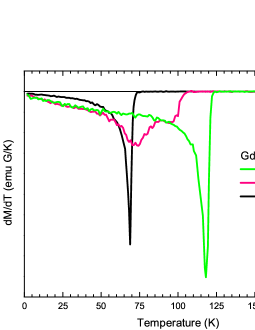
We now can draw the following picture. Substituting Eu by Gd results in doping the material with extra electrons, and these electrons mediate via the double exchange mechanism an enhanced ferromagnetic coupling between neighboring ions.mauger86a ; tsuda91a ; ingle08a ; arnold08a Nevertheless, the small impurity potential present at each Gd site binds the extra electron so that a bound magnetic polaronmauger86a ; tsuda91a is formed which becomes practically ferromagnetic at about 125 K. The diameter of these bound polarons could be of order three nearest–neighbors distances. For low doping, they are separated by regions without Gd doping. In going from high to temperatures lower than 125 K, each polaron starts to polarize the surrounding undoped regions. Lowering the temperature further, there will be a temperature at which a collective ferromagnetic long-range order is created. This is the of the sample. In the low–doping limit, nevertheless, a sizable volume fraction of the material does not feel sufficiently strong the polarizing effect of the paramagnetic clusters, with the result that this fraction starts to order magnetically only when the temperature is close to the of the undoped material. Apparently, this is the case for the 1.5% film: the temperature derivative of the magnetization reveals not only the of 100 K but also another characteristic temperature at 73 K, see Fig. 8. For higher doping levels more and more of the volume fraction belongs to the paramagnetic cluster part and/or gets easily polarized by the clusters, with the consequence that the increases further steadily. At 7.7% concentration one apparently has reached the situation in which the material is magnetically rather homogenous as suggested by the fact that the magnetization curve does not deviate too much from the Brillouin function. For even higher doping levels the magnetization starts to decrease, the cause of which is not clear at the moment.

In order to elucidate further the magnetic properties, we have analyzed the magnetization data just below in terms of a power law, ( - )β, where denotes the critical magnetic exponent with the typical value of 0.36 for the three–dimensional (3D) Heisenberg model. The small magnetic contribution from the substrate has been subtracted. We find of 0.35 0.01 for the undoped EuO film, which is similar to the bulk EuOmenyuk71a as a well-known Heisenberg ferromagnet. Also for the 7.7% Gd–doped EuO film we extract a similar value, 0.37 0.01. This means that Gd–doped EuO behaves also as a Heisenberg ferromagnet. To complete the investigation of the magnetic properties, we also have measured the magnetic field dependence of the magnetization for the undoped EuO and the 7.7% Gd–doped EuO films at 5 K. The results are shown in Fig. 9. One can clearly observe that the samples have very similar hysteresis curves. The remanence magnetization is about 4.5 and the coercive field is about 40 G. Moreover, they also showed the saturation magnetization of 7 per f.u. as expected for a system.
IV Conclusion
We have succeeded in preparing high-quality Gd–doped EuO samples. The films on YSZ (001) are single–crystalline, and a layer–by–layer epitaxial growth has been observed. Thanks to the use of the Eu–distillation process during the growth, we were able to obtain films free from Eu3+ species, oxygen vacancies, and Gd2O3 contaminants. We have provided a reliable determination of the actual Gd concentration in the films by applying soft x–ray absorption spectroscopy at the Gd and Eu edges. We found that the Curie temperatures increases steadily as a function of Gd concentration reaching a maximum of 125 K. A threshold behavior was not observed for concentrations as low as 0.2%. Both the undoped and the 7.7% Gd–doped EuO films reveal magnetic properties typical for a 3D, S = 7/2, Heisenberg ferromagnet. For intermediate Gd concentrations we find indications for phase separation to occur.
V Acknowledgments
We would like to thank Lucie Hamdan and Susanne Heijligen for their skillful technical assistance. R. S. wishes to thank S. Standop for his support in the film preparation. We also thank D. Khomskii for stimulating discussions. We acknowledge the NSRRC staff for providing us with beam time. The research in Cologne is supported by the Deutsche Forschungsgemeinschaft through SFB 608.
References
- (1) A. Schmehl, V. Vaithyanathan, A. Herrnberger, S. Thiel, C. Richter, M. Liberati, T. Heeg, M. Röckerath, L. F. Kourkoutis, S. Mühlbauer, P. Böni, D. A. Muller, Y. Barash, J. Schubert, Y. Idzerda, J. Mannhart, and D. G. Schlom, Nature Mater. 6, 882 (2007).
- (2) R. P. Panguluri, T. S. Santos, E. Negusse, J. Dvorak, Y. Idzerda, J. S. Moodera, and B. Nadgorny, Phys. Rev. B 78, 125307 (2008).
- (3) T. S. Santos, J. S. Moodera, K. V. Raman, E. Negusse, J. Holroyd, J. Dvorak, M. Liberati, Y. U. Idzerda, and E. Arenholz, Phys. Rev. Lett. 101, 147201 (2008).
- (4) A. Mauger and C. Godart, Phys. Rep. 141, 51 (1986).
- (5) N. Tsuda, K. Nasu, A. Yanase, and K. Siratori, Electronic Conduction in Oxides, Springer Series in Solid-State Sciences Vol. 94, (Springer–Verlag, Berlin 1991).
- (6) P. G. Steeneken, L. H. Tjeng, I. Elfimov, G. A. Sawatzky, G. Ghiringhelli, N. B. Brookes, and D.-J. Huang, Phys. Rev. Lett. 88, 047201 (2002).
- (7) M. W. Shafer and T. R. McGuire, J. Appl. Phys. 39, 588 (1968).
- (8) K. Y. Ahn and T. R. McGuire, J. Appl. Phys. 39, 5061 (1968).
- (9) A. A. Samokhvalov, B. A. Gizhevskii, M. I. Simonova, and N. I. Solin, Sov. Phys. Solid State 14, 230 (1972).
- (10) A. A. Samokhvalov, T. I. Arbuzova, M. I. Simonova, and L. D. Fal’kovskaya, Sov. Phys. Solid State 15, 2459 (1974).
- (11) J. Schoenes and P. Wachter, Phys. Rev. B 9, 3097 (1974).
- (12) A. Mauger, C. Godart, M. Escorne, J. C. Achard, and J. P. Desfours, J. Phys. (Paris) 39, 1125 (1978).
- (13) F. Meier, P. Zürcher, and E. Kaldis, Phys. Rev. B 19, 4570 (1979).
- (14) C. Godart, A. Mauger, J. P. Desfours, and J. C. Achard, J. Phys. Colloq. 41, C5–205 (1980).
- (15) A. Mauger, M. Escorne, C. Godart, J. P. Desfours, and J. C. Achard, J. Phys. Colloq. 41, C5–263 (1980).
- (16) H. Rho, C. S. Snow, S. L. Cooper, Z. Fisk, A. Comment, and J.-Ph. Ansermet, Phys. Rev. Lett. 88, 127401 (2002).
- (17) T. Matsumoto, K. Yamaguchi, M. Yuri, K. Kawaguchi, N. Koshizaki, and K. Yamada, J. Phys.: Condens. Matter. 16, 6017 (2004).
- (18) H. Ott, S. J. Heise, R. Sutarto, Z. Hu, C. F. Chang, H. H. Hsieh, H.-J. Lin, C. T. Chen, and L. H. Tjeng, Phys. Rev. B 73, 094407 (2006).
- (19) O. Massenet, Y. Capiomont, and N. V. Dang, J. Appl. Phys. 45, 3593 (1974).
- (20) A. A. Samokhvalov, A. F. Gunichev, B. A. Gizhevskii, N. N. Loshkareva, N. M. Chebotaev, and N. A. Viglin, Sov. Phys. Solid State 20, 519 (1978).
- (21) R. Sutarto, S. G. Altendorf, B. Coloru, M. Moretti Sala, T. Haupricht, C. F. Chang, Z. Hu, C. Schüßler-Langeheine, N. Hollmann, H. Kierspel, H. H. Hsieh, H.-J. Lin, C. T. Chen, and L. H. Tjeng, Phys. Rev. B 79, 205318 (2009).
- (22) R. P. Ingel and D. Lewis III, J. Am. Ceram. Soc. 69, 325 (1986).
- (23) M. Yashima, S. Sasaki, M. Kakihana, Y. Yamaguchi, H. Arashi, and M. Yoshimura, Acta Crystallogr., Sect. B: Struct. Sci. 50, 663 (1994).
- (24) V. E. Henrich and P. A. Cox, The Surface Science of Metal Oxides (Cambridge University Press, Cambridge, 1994).
- (25) B. T. Thole, G. van der Laan, J. C. Fuggle, G. A. Sawatzky, R. C. Karnatak, and J.-M. Esteva, Phys. Rev. B 32, 5107 (1985).
- (26) J. B. Goedkoop, B. T. Thole, G. van der Laan, G. A. Sawatzky, F. M. F. de Groot, and J. C. Fuggle, Phys. Rev. B 37, 2086 (1988).
- (27) P. Rudolf, F. Sette, L. H. Tjeng, G. Meigs, and C. T. Chen, J. Magn. Magn. Mater. 109, 109 (1992).
- (28) N. J. C. Ingle and I. S. Elfimov, Phys. Rev. B 77, 121202(R) (2008).
- (29) M. Arnold and J. Kroha, Phys. Rev. Lett. 100, 046404 (2008).
- (30) N. Menyuk, K. Dwight, and T. B. Reed, Phys. Rev. B 3, 1689 (1971).