Three- to Two-Dimensional Transition of the Electronic Structure in CaFe2As2 - parent compound for an iron arsenic high temperature superconductor
Abstract
We use angle-resolved photoemission spectroscopy (ARPES) to study the electronic properties of CaFe2As2 - parent compound of a pnictide superconductor. We find that the structural and magnetic transition is accompanied by a three- to two-dimensional (3D-2D) crossover in the electronic structure. Above the transition temperature () Fermi surfaces around and X points are cylindrical and quasi-2D. Below the former becomes a 3D ellipsoid, while the latter remains quasi-2D. This finding strongly suggests that low dimensionality plays an important role in understanding the superconducting mechanism in pnictides.
pacs:
79.60.-i, 74.25.Jb, 74.70.DdThe dimensionality of electronic structure plays an important role in the superconductivity of solids. The cuprate superconductors have the highest known transition temperatures and they have quasi two dimensional (2D) electronic structure. In contrast, the borocarbides Gupta_B2C , another class of relatively high transition temperature superconductors, have a strictly three dimensional (3D) electronic structure Starowicz . The situation in the newly discovered iron arsenic high temperature superconductors is less clear. Both FeAsO (R1111, being the rare earth element) Original and Fe2As2 (A122, being Ca, Sr, Ba) Rotter have strongly layered structures, with the iron-arsenic layers believed to be mainly responsible for the electronic properties and superconductivity. The A122 family share the same ThCr2Si2 structure as the borocarbides and both display interesting interplay between magnetism and superconductivity. Some band structure calculations predict strong dispersion and 3D Fermi surfaces (FSs) FengjieMa in the magnetic state of the parent compounds, however so far this has not been observed by angle-resolved photoemission spectroscopy (ARPES) ChangLiu ; TakeshiPRL ; Ding_Europhys ; Zhou ; Wray ; Hsieh ; Ding_2 . On the other hand, a number of physical properties display an anisotropy that is a few orders of magnitude smaller than that found in the cuprates NiNi_Hc2 ; Martin ; Tanatar , which hints at a strong hopping between the layers. In terms of the pairing mechanism, most theoretical models depend on nesting between the - and X(M)-pockets Mazin ; Dong , for which the dimensionality of the FSs is very important.
The parent compounds of the two iron pnictide families undergo a tetragonal-to-orthorhombic (Tet-Ortho) structural/magnetic transition at elevated temperatures Nomura ; NiNi_Hc2 . Superconductivity appears in the A122 materials when the high temperature Tet-phase is stabilized down to low enough temperatures (usually by doping with K in a Ba position or Co substitution for Fe which lowers the transition temperature) NiNiCo . Determining the differences between these phases is key to gaining a full understanding and control of the superconductivity in the iron-pnictides. In particular, CaFe2As2 shows a first order Tet-Ortho transition with a transition temperature (160 170K) depending on the growth method NiNi_transition ; Kumar ; Wu_FeAsflux . Superconductivity is found when moderate (possibly not purely hydrostatic) pressure is applied debate , or by doping with cobalt Kumar or sodium Wu_FeAsflux . Such a rich phase diagram makes CaFe2As2 an ideal system for studying the electronic properties of the parent compounds. In this Letter we present ARPES data which demonstrates that the electronic structure in the parent compound of the A122 iron arsenic family undergoes a 3D to 2D crossover associated with the structural/magnetic transition. The cylindrical, quasi-2D FS surrounding the -point becomes highly dispersive (3D) and forms an ellipsoid upon cooling below the transition temperature into the Ortho-phase. The observation of the 3D FS is consistent with recent results from quantum oscillation measurements Sebastian ; Harrison . The FSs around the X-pocket remain quasi-2D and unaffected by the structural transition.
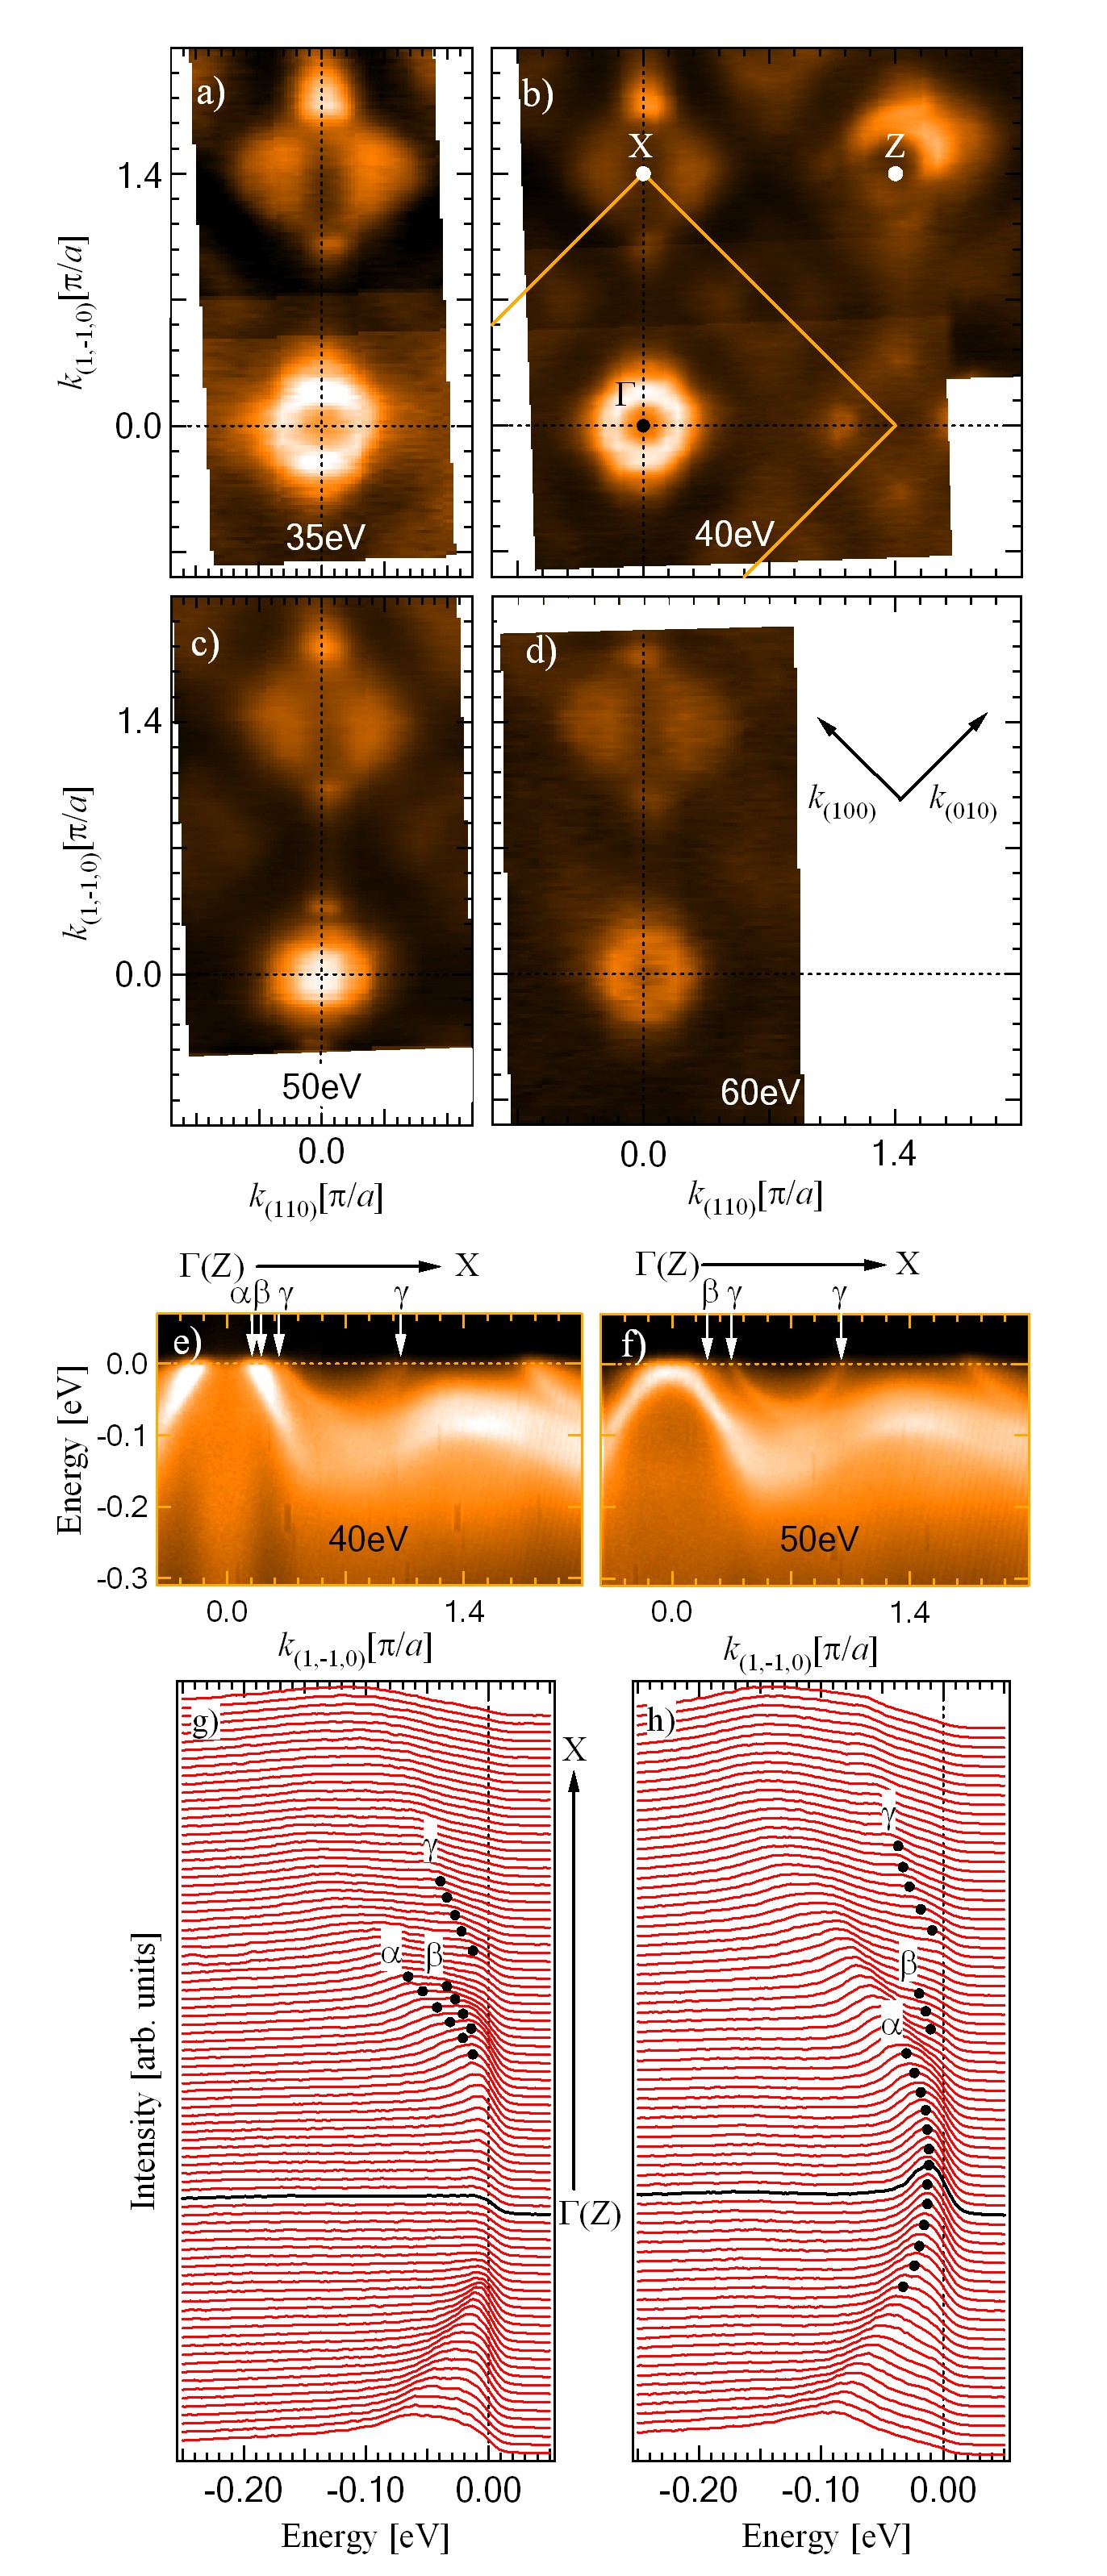
Plate like single crystals of CaFe2As2 were grown out of a FeAs flux as well as Sn flux using conventional high-temperature solution growth techniques NiNi_transition with typical dimensions ranging from 2 2 mm2 up to 10 10 mm2. Following the growth the samples were annealed at 500∘C for 24 hours. Resistivity measurements showed a first-order Tet-Ortho transition at 160K for the FeAs flux grown samples and 170K when using Sn flux. The ARPES measurements are performed at beam lines 10.0.1 and 7.0.1 of the Advanced Light Source (ALS), Berkeley, California, and the SIS beam line of the Swiss Light Source, Switzerland. Energy resolution was set at meV, vacuum conditions were better than torr. All samples were cleaved in situ along the (001) plane, yielding mirror-like, clean surfaces. Lattice constant values from Ref. Goldman_lattice are used to determine the -space positions. The high symmetry points X and Z for both two phases are defined to be (, (), 0) and (0, 0, ), respectively, with () and () axes along the Fe-As bonds.
FS maps of CaFe2As2 obtained at several different photon energies in the Ortho-phase are shown in Fig. 1 along with ARPES intensity plots and energy distribution curves (EDCs). Varying the photon energy in ARPES effectively changes the momentum offset along the direction perpendicular to the sample surface (in our case this direction corresponds to - perpendicular to the Fe-As layers) Hufner ; TakeshiThesis . The striking feature of Fig. 1 is that the dispersion of one of the bands that form the “-pocket” (Fermi contour around the zone center ) changes dramatically with photon energy. At eV, three different bands and cross the chemical potential () as seen in Figs. 1(e), 1(g) and this gives rise to three FS sheets. The -band crosses again near the X-point, forming a characteristic flower shape of the X-pocket. The other two bands () are relatively close to each other. They form two hole pockets around . Similar behavior has been reported in Ba1-xKxFe2As2 Feng_Ba ; Ding_Europhys ; Zhou ; Sato_K ; Borisenko . However, at eV, the top of the band is located below and the corresponding -pocket disappears. The - and -pockets continue to cross at about the same as for 40eV photons [Figs. 1(c), 1(f) and 1(h)]. These data conclusively demonstrate that the electronic structure in the Ortho-phase of CaFe2As2 is 3D. On the other hand, no obvious change is seen for the X-pocket at these 4 energies.
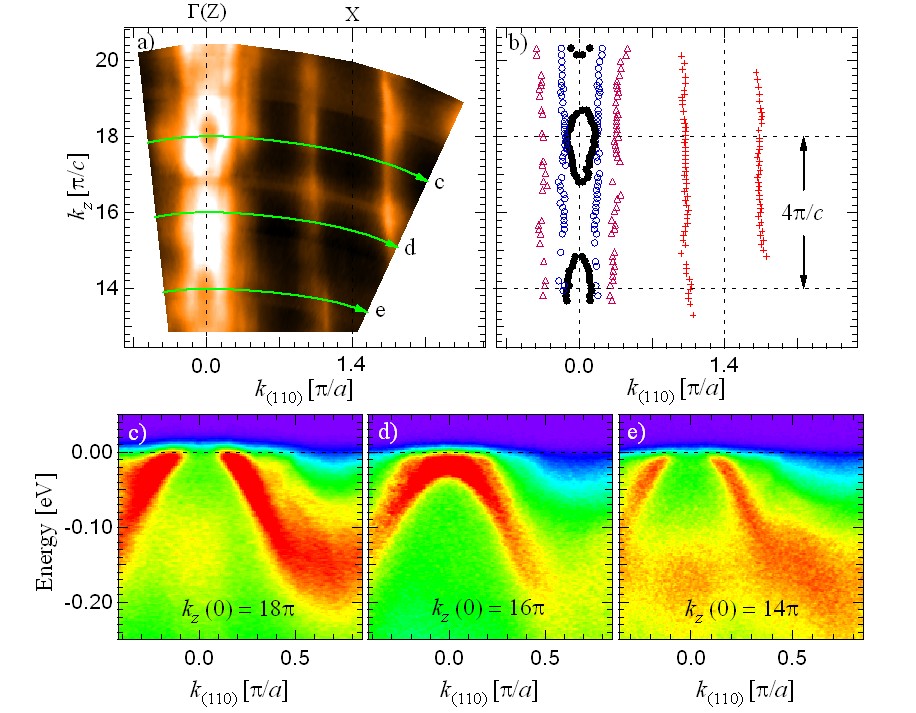
A comprehensive study of the evolution of the - and X-pocket with different incident photon energies is shown in Fig. 2 for the Ortho-phase of CaFe2As2. The photon energy ranges from 35 to 105eV. The FS map along the direction is shown in Fig. 2(a) over a range corresponding to several Brillouin zones. The Fermi pocket forms an ellipsoid centered at in the respective Brillouin zones with a periodicity. It should be noted that the observation of dispersion with such periodicity clearly demonstrates that ARPES data from these samples reveals intrinsic, bulk electronic properties. In Fig. 2(b) we extract the Fermi crossing momenta (s) from the momentum distribution curve (MDC) peaks at for each photon energy. It is clear that only the -band (black solid dots) but not the - and -bands show a strong dispersion. Almost no dispersion of the X-pocket is observed, which indicates its quasi 2D nature. The consistency of this map with that of Fig. 1 is better seen at Figs 2(c)-2(e) where ARPES intensity maps are shown for 3 high symmetry points. At eV () the -band does not cross , while at and 41eV ( and ) all three bands form Fermi pockets.
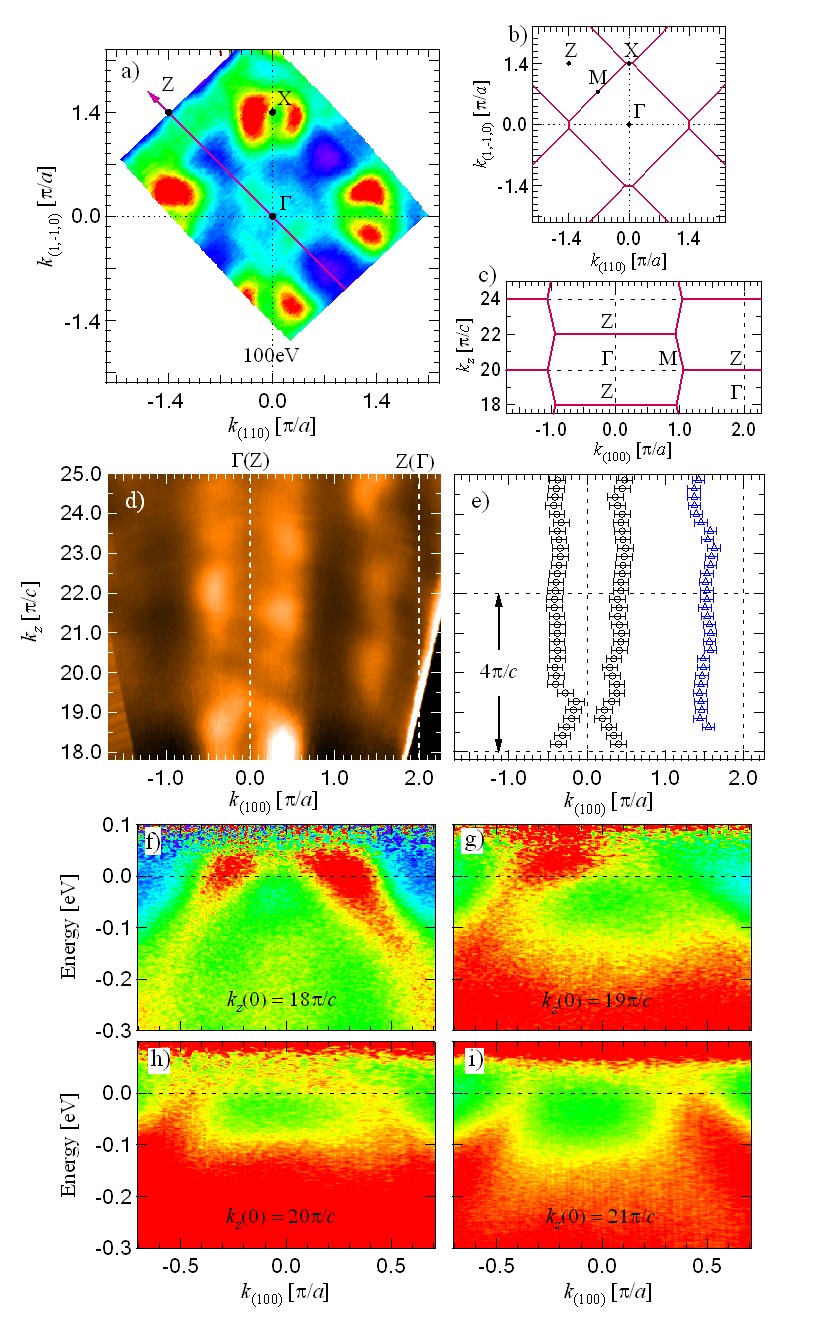
Now we turn our attention to the high temperature Tet-phase of CaFe2As2. We demonstrate in Fig. 3 the 2D character of the band structure in the Tet-phase. Panel 3(a) shows the FS map at eV. An arrow represents the -Z direction along which data in panels (d) and (e) were obtained. Schematic arrangement of the Brillouin zones along in-plane and out-of-plane directions for the Tet-phase are shown in panels 3(b) and 3(c). Panels 3(d) and 3(e) presents the actual intensity data integrated within 10 meV about as a function of and and the band dispersion extracted using MDC peaks respectively. The photon energy range used here is 80 to 190eV, which corresponds to . The most important observation here is that the bands around cross at all s measured, no apparent dispersion is visible. For further clarification, in panels 3(f)-3(i) we show ARPES intensity maps divided by the resolution convoluted Fermi function for and respectively. The band crosses for all these -points, in clear contrast with the situation for the low temperature Ortho-phase. The data in Fig. 3 is consistent with a quasi-2D nature of the FS in the high temperature Tet-phase of CaFe2As2.
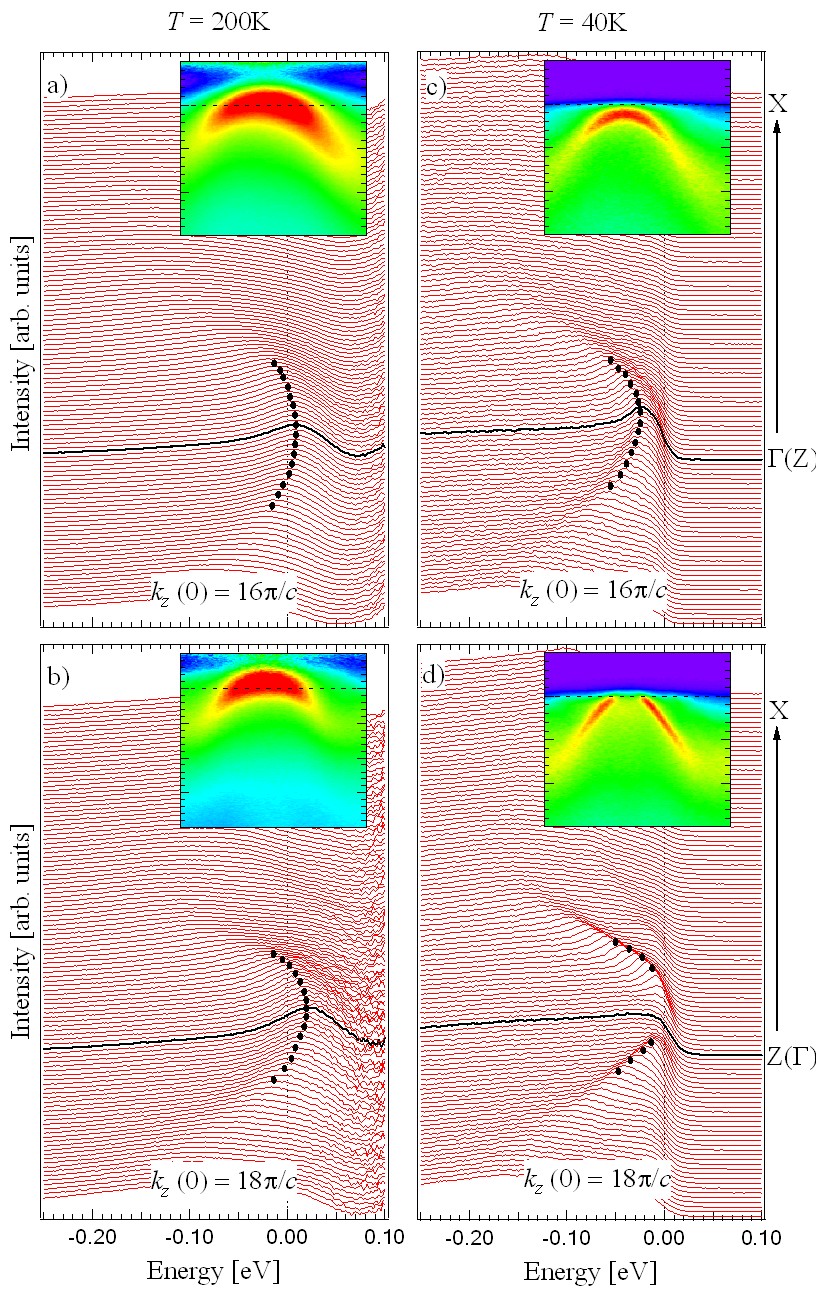
In Fig. 4 we directly compare the band dispersion of low and high temperature phase for the two values that correspond to high symmetry points. The data is taken along -X direction on the same sample under exactly the same experimental conditions to avoid possible complications due to scattering matrix elements or polarization of incident photons. Though the data in Fig. 4 is taken from different samples and beam lines than that in Fig. 2, the 3D nature of the low temperature Ortho-phase reproduces nicely. At high temperature we divided the data by the resolution convoluted Fermi function to better see the location of the band in the proximity of . At low temperature this is not necessary, as the width of the Fermi edge is much sharper than the leading edge of the peaks, band crossings are clearly visible. At K, the -band crosses at both points ( and - Figs. 4(a) and 4(b)). At low temperature in the Ortho-phase, the same band crosses at (Fig. 4(d)), but is located several tens of meV below at (Fig. 4(c)). This may be the origin of the sudden drop in the electric resistivity found by transport measurements when the material is heated above the transition temperature NiNi_transition ; Wu_FeAsflux .
In conclusion, we have measured the in-plane and out-of-plane band dispersion for both the orthorhombic (Ortho) and tetragonal (Tet) phase of the iron arsenic A122 parent compound CaFe2As2. A number of theoretical models of the pairing mechanism and magnetic ordering in these materials are based on nesting between different sheets of the Fermi surface Mazin ; Dong . Our results demonstrate that some FS sheets are indeed three dimensional, therefore put significant constrains on possible nesting scenarios, since the degree of nesting will strongly depend on the dimensionality of the FSs. Our finding also has important implications for understanding a number of other physical properties such as the anisotropy in electrical and thermal conductivity Makariy which depend on the dimensionality of the electronic structure.
We thank J. Schmalian, M. A. Tanatar and Rafael Fernandes for insightful discussions and staff at SLS and ALS for excellent instrumentation support. Ames Laboratory was supported by the Department of Energy - Basic Energy Sciences under Contract No. DE-AC02-07CH11358. ALS is operated by the US DOE under Contract No. DE-AC03-76SF00098.
References
- (1) L. C. Gupta, Advances in Physics, 55, 691 (2006).
- (2) P. Starowicz et al., Phys. Rev. B 77, 134520 (2008).
- (3) Y. Kamihara, T. Watanabe, M. Hirano, and H. Hosono, J. Am. Chem. Soc. 130, 3296 (2008).
- (4) Marianne Rotter, Marcus Tegel, and Dirk Johrendt, Phys. Rev. Lett. 101, 107006 (2008).
- (5) D.J. Singh et al., arXiv:0810.2682 (2008) and references therein.
- (6) Fengjie Ma et al., arXiv:0806.3526v2 (2008).
- (7) H. Ding et al., Europhys. Lett. 83, 47001 (2008).
- (8) Lin Zhao et al., Chin. Phys. Lett. 25, 4402 (2008).
- (9) L. Wray et al., Phys. Rev. B 78, 184508 (2008).
- (10) T. Kondo et al., Phys. Rev. Lett. 101, 147003 (2008).
- (11) D. Hsieh et al., arXiv:0812.2289 (2008).
- (12) H. Ding et al., arXiv:0812.0534 (2008).
- (13) Chang Liu et al., Phys. Rev. Lett. 101, 177005 (2008).
- (14) N. Ni et al., Phys. Rev. B 78, 014507 (2008).
- (15) C. Martin et al., arXiv:0807.0876 (2008).
- (16) M. A. Tanatar et al., arXiv:0812.4991 (2008).
- (17) I. I. Mazin, D. J. Singh, M. D. Johannes and M. H. Du, Phys. Rev. Lett. 101, 057003 (2008).
- (18) J. Dong et al., Europhys. Lett. 83, 27006 (2008).
- (19) T. Nomura et al., Supercond. Sci. Technol. 21, 125028 (2008).
- (20) N. Ni et al., Phys. Rev. B 78, 214515 (2008).
- (21) N. Ni et al., Phys. Rev. B 78, 014523 (2008).
- (22) Neeraj Kumar et al., Phys. Rev. B 79, 012504 (2009).
- (23) G. Wu et al., J. Phys.: Condens. Matter 20, 422201 (2008).
- (24) The exact nature of the pressure-induced superconductivity in CaFe2As2 is still under debate. See Milton S. Torikachvili et al., Phys. Rev. Lett. 101, 057006 (2008), A. Kreyssig et al., Phys. Rev. B 78, 184517 (2008) and W. Yu et al., Phys. Rev. B 79, 020511 (2009).
- (25) S. E. Sebastian et al., J. Phys.: Cond. Matt. 20, 422203 (2008).
- (26) N. Harrison et al., arXiv: 0902.1481 (2009).
- (27) A. I. Goldman et al., Phys. Rev. B 78, 100506 (2008).
- (28) Stefan Hüfner, Photoelectron Spectroscopy, (Springer-Verlag, Berlin Heidelberg, 1996).
- (29) T. Kondo, Ph.D. Thesis, Nagoya University (2005).
- (30) L. X. Yang et al., Phys. Rev. Lett. 102, 107002 (2009).
- (31) T. Sato et al., arXiv:0810.3047 (2008).
- (32) V. B. Zabolotnyy et al., Nature 457, 569 (2009).
- (33) M. A. Tanatar et al., private communication.