Strong [CII] emission at high redshift ††thanks: Based on observations made with ESO telescope APEX, under program ID E-082.B-0692A-2008.
Abstract
Context. We report the detection of the [CII]157.74m fine-structure line in the lensed galaxy BRI 0952-0115 at z=4.43, using the APEX telescope. This is the first detection of the [CII] line in a source with at high redshift. The line is very strong compared to previous [CII] detections at high-z (a factor of 5–8 higher in flux), partly due to the lensing amplification. The ratio is , which is higher than observed in local galaxies with similar infrared luminosities. Together with previous observations of [CII] at high redshift, our result suggests that the [CII] emission in high redshift galaxies is enhanced relative to local galaxies of the same infrared luminosity. This finding may result from selection effects of the few current observations of [CII] at high redshift, and in particular the fact that non detections may have not been published (although the few published upper limits are still consistent with the [CII] enhancement scenario). If the trend is confirmed with larger samples, it would indicate that high-z galaxies are characterized by different physical conditions with respect to their local counterparts. Regardless of the physical origin of the trend, this effect would increase the potential of the [CII]158m line to search and characterize high-z sources.
Aims.
Methods.
Results. Conclusions. Galaxies: high redshift – Galaxies: ISM – quasars: individual: BRI 0952-0115 – Submillimeter – Infrared: galaxies
1 Introduction
The fine-structure line of at 157.74 is emitted predominantly by gas exposed to ultraviolet radiation in photo dissociation regions (PDRs) associated with star forming activity (even in galaxies hosting AGNs). This line is generally the brightest emission line in the spectrum of galaxies, accounting for as much as 0.1-1% of their total luminosity (Crawford et al., 1985; Stacey et al., 1991; Wright et al., 1991). As a consequence, the [CII]158m line is regarded as the most promising tool to detect and identify high redshift galaxies with forthcoming (sub-)mm facilities, such as ALMA (e.g. Maiolino, 2008).
In local galaxies, with far-infrared luminosities , the [CII] luminosity is proportional to the far-IR luminosity, and typically (e.g. Stacey et al., 1991). However, for sources with this ratio drops by an order of magnitude (Malhotra et al., 2001; Luhman et al., 1998, 2003; Negishi et al., 2001). Various explanations have been proposed for the physical origin of this effect, more specifically: 1) a high ratio of ultraviolet flux to gas density, which results in positively charged dust grains that in turn reduce the efficiency of the gas heating by the photoelectric effect (e.g. Kaufman et al., 1999), and which also increases the fraction of UV radiation absorbed by dust (Abel et al., 2009); 2) opacity effects which weaken the [CII] emission line in infrared luminous galaxies (Gerin & Phillips, 2000; Luhman et al., 1998); 3) contribution to from dust associated with HII regions (Luhman et al., 2003); 4) contribution to from an AGN (see Malhotra et al., 2001). Regardless of the physical origin of the effect, the sharp drop of the ratio at high luminosities has cast doubts about the usefulness of the [CII] to trace high-z galaxies.
Although locally the [CII]158m line can only be observed from space or from airborne observatories, at high redshift the line is shifted into the submm-mm windows of atmospheric transmission, and therefore can be observed with groundbased facilities. The first detection of the [CII]158m was obtained in J114816.64+525150.3, one of the most distant quasars known at z=6.4, for which the [CII] line is shifted at 1.2 mm (Maiolino et al., 2005; Walter et al., 2009). The second most distant [CII] detection was obtained in BR 1202–0725, a quasar at z=4.7 (Iono et al., 2006). Both these sources have luminosities (Hyper Luminous Infrared Galaxies, HyLIRGs)111Note that the “standard definition” of LIRG, ULIRG and HyLIRG is based on the total infrared luminosity (), and specifically the three classes are defined with , respectively (Sanders & Mirabel, 1996). Throughout the paper we instead use the far-IR luminosity, defined as , which is generally more accurately constrained and reported for high-z sources and which can be lower than by a factor ranging from 1.1 to 2 depending on the source., and actually these are the first [CII] detections in galaxies with such high luminosities. In these objects , i.e. similar to the value observed in local Ultraluminous Infrared Galaxies (ULIRGs) with luminosities . This result is somewhat surprising, since the extrapolation of the rapidly decreasing observed in local ULIRGs would predict a much lower [CII] luminosity than observed in the two extremely luminous objects at high-z detected so far. Possibly, evolutionary effects may be involved.
To further investigate the latter issue one should search for [CII] emission in high-z galaxies with infrared luminosity closer to the local ULIRGs for which [CII] has been observed, i.e. . The quasar BRI 0952-0115 at z=4.4337 is an optimal source for this test. This is a lensed quasar with a magnification factor in the range (see Appendix), whose mm and submm fluxes (fitted with a modified black body) indicate an intrinsic (de-magnified) far-IR luminosity (Priddey & McMahon, 2001, corrected for our adopted cosmology). This quasar has also been detected in the molecular transition CO(5–4) (Guilloteau et al., 1999) that provides an accurate determination of its redshift, which is required for the search of the [CII] within the narrow band offered by current submm receivers. We have used the Atacama Path Finder Experiment (APEX)222APEX is a collaboration between the Max-Planck-Institut fur Radioastronomie, the European Southern Observatory, and the Onsala Space Observatory. to observe the [CII] line in BRI 0952-0115. In this letter we report the successful detection of the line. We discuss some possible implications of our detection on the physics of high redshift galaxies and on the detectability of the [CII] line in general in high redshift sources. In this letter we assume the concordance -cosmology with , and (Spergel et al., 2003).
2 Observations and results
BRI 0952-0115 (RA(J2000)09:55:00.1, DEC(J2000)-01:30:07.1) was observed with the Swedish Heterodyne Facility Instrument (SHFI, Vassilev et al., 2008) on the APEX telescope in six observing runs, from November 1st to December 18th 2008 (a short run on October 23rd was totally discarded because of bad weather conditions), for a total of about 22 hours of observations, including sky observations and overheads, resulting in 5 hours of net on-source integration. The weather conditions were generally very good with precipitable water vapor , the best quality data coming from the run on December 17th when we had for 6 hours. We used the APEX–2 receivers tuned to 349.77 GHz (both polarizations), which is the expected frequency of the [CII]157.741m line at the redshift z=4.4337 provided by the CO(5–4) detection (Guilloteau et al., 1999). At this frequency the 1 GHz band of the back-end translates into a velocity coverage of about 860 km/s. In the last run (December 18th) we also observed with the frequency of the two receivers offset by 200 km/s, to check the effects of possible instrumental artifacts. Observations were done in wobbler switching mode, with a symmetrical azimuthal throw of 20′′ and a frequency of 0.5 Hz. Pointing was checked on the nearby source IRC+10216 every 1-2 hours, and found to be better than 3′′ (with a beam size of 18′′). The focus was checked on Saturn, especially after Sunrise when the telescope deformations are largest.
The data were analyzed by using CLASS (within the GILDAS-IRAM package). One of the main problems in searching for relatively broad lines (a few hundred km/s) with single dish telescopes are the spectral baseline instabilities. As a consequence, we visually inspected all individual scans and removed those with clear baseline instabilities. We found that the analysis further benefits of additional purging of scans that show a rms higher than a given threshold. This technique removes additional baseline instabilities which are not readily seen in the visual inspection of individual scans. The lower the rms threshold, the lower the “noise” introduced by spurious baselines is, but an increasing fraction of scans is discarded causing the Poisson noise to increase. We found that an rms threshold of 130 mK optimizes the noise in the spectra (which leaves about 1.6 hours of on-source integration), although the results do not change significantly as long as the rms threshold is below about 145 mK (which would include 60% of the observing time). To show that the final result does not depend significantly on the scans selection (as long as the really bad ones are removed) we have also separately combined all scans of the best run, on December 17th, without any rms rejection. The individual scans were aligned in frequency and averaged together. A linear baseline was subtracted to the final spectrum by interpolating the channels in the velocity ranges and .
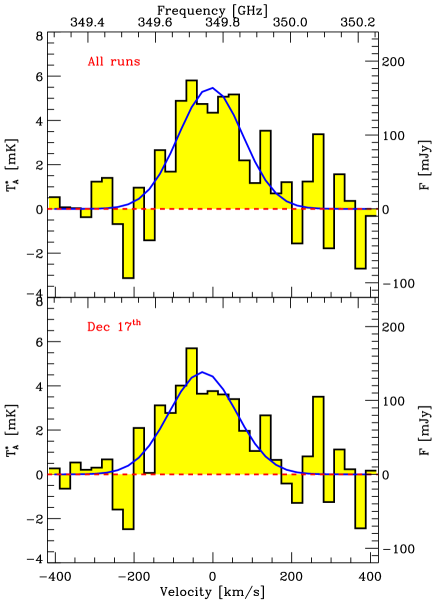
Fig. 1 shows the resulting spectrum smoothed to a spectral resolution of 27 km/s. The top panel is for the combination of all runs with the threshold rms130 mK, while the bottom panel shows the combination of the Dec. 17th run only (the best weather run), without any rms rejection. The [CII] line is clearly detected, with a significance of 7. We also verified that if we split the observations in two halves the line is detected independently in each of them with a significance higher than about 5.
The [CII] line was fitted with a single gaussian. The resulting line parameters are reported in Table 1, and compared with the CO(5–4) line detected by Guilloteau et al. (1999). The [CII] line center and width are fully consistent with those of the CO line.
| Line | I | log(L)a | ||||
|---|---|---|---|---|---|---|
| [GHz] | [] | [] | [] | |||
| [CII] () | 1900.54 | 349.776 | 4.43360.0003 | 19332 | 33.64.9 | 9.660.25 |
| CO (5–4) | 576.2679 | 106.055 | 4.43370.0006 | 23030 | 0.910.11 | 7.580.25 |
a Log of the luminosity corrected for a lensing magnification of , while the error reflects the possible range of magnifications (see Appendix).
3 Discussion
The previous two [CII]158m detections at high redshift (Maiolino et al., 2005; Iono et al., 2006) were obtained in HyperLuminous Infrared Galaxies (). The observations presented in this paper toward BRI 0952-0115 provide the first [CII] detection at high redshift in a galaxy with luminosity . A striking result is the strong line flux, 5–8 times higher than previous [CII] detections at high-z, with a peak intensity of 160 mJy. Such a strong flux is partly due to the lensing amplification and partly to the lower luminosity distance with respect to previous [CII] detections.
The ratio is about five times higher than inferred for the other two high-z sources with [CII] detection (Maiolino et al., 2005; Iono et al., 2006). However, the latter two sources are actually “CO–overluminous”, as shown by Curran (2008), and anyhow the observed difference is well within the spread between [CII] and CO luminosities observed in local LIRGs (Curran, 2008). A direct comparison with local galaxies is not easy, since most of local galaxies have data for lower CO transitions, and the large variations of the CO excitation, especially among high-z sources, makes it difficult to translate the CO(5–4) luminosity into a CO(1–0) luminosity (e.g. Weiß et al., 2007).
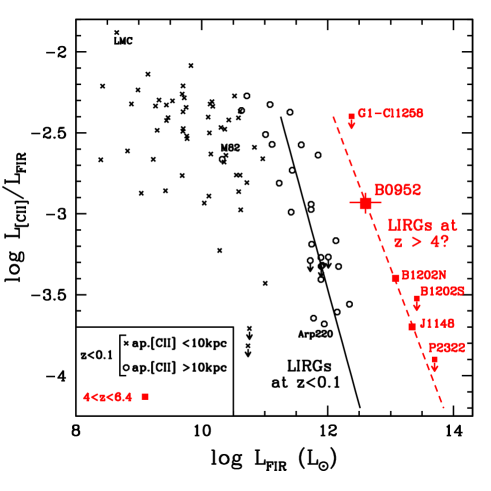
Probably the most important result of our observations is that the [CII] line in BRI 0952-0115 is very strong relative to its far-IR luminosity when compared to other luminous sources. This is illustrated in Fig. 2, which shows the ratio versus , both for local galaxies (black crosses and open circles) and high-z galaxies (red squares). Black crosses indicate galaxies for which the aperture used to measure [CII] (generally ISO-LWS) is smaller than 10 kpc, and therefore it may sample a smaller region relative to the beam (generally IRAS) used for the far-IR flux (hence the ratio may not be reliable for some of these sources). Local galaxies (black symbols) show the well known drop of the ratio at luminosities . In BRI 0952-0115 we measure a ratio that is higher than observed in local ULIRGs, which are mostly in the range . More interesting is the comparison of the trends of in local and high-z galaxies. The black solid line in Fig 2 is a linear fit (of the logarithmic quantities) to the local galaxies with ( Luminous Infrared Galaxies, LIRGs, see footnote 1), which describes the steep drop of at high luminosities observed in local galaxies, in the form
| (1) |
where is the far-IR luminosity in units of . The extrapolation of the black line to high luminosities heavily underpredicts the ratio observed in high-z sources (red squares). The high ratio observed in BRI 0952-0115, along with the observed in the other two high-z sources at higher luminosities, suggest that the [CII] emission is enhanced in high-z galaxies relative to their local counterparts of the same infrared luminosity. The red dashed line in Fig. 2 is a linear fit to the high-z [CII]-detected galaxies, in the form
| (2) |
(where the errors on the coefficients are dominated by the uncertainty on the magnification factor of BRI 0952-0115, see Appendix). At a given infrared luminosity the offset between the local (black-solid) and high-z (red-dashed) best fit lines corresponds to an enhancement of the [CII] luminosity by more than an order of magnitude in high-z galaxies. Clearly the result depends on the actual magnification factor of BRI 0952-0115, whose intrinsic has a strong leverage on the actual slope of the relation at high redshift (red dashed line). However, even in the case of the highest possible magnification factor (, corresponding to the leftmost end of the horizontal red bar in Fig. 2) the evidence for [CII] enhancement, relative to local galaxies of the same infrared luminosity, is still strong.
This result has still low statistical significance, since it is based only on three high-z objects. Moreover, the observed trend may result from selection effects, in the sense that high-z [CII] non-detections may have not been published, hence the three published detections may trace the upper envelope of a wider distribution. Yet, it is worth noting that the three high-z [CII] upper limits available so far (Marsden et al., 2005; Iono et al., 2006, P. Cox priv. comm.)333BR 1202-0725 was included in Maiolino et al. (2005) as an upper limit (from Benford et al., in prep.), but subsequently Iono et al. (2006) detected [CII] in the northern component of the source, while the southern component remained undetected. Both components are consistent with the high-z relation shown in Fig. 2. are consistent with the high-z [CII]-enhanced scenario, as illustrated in Fig. 2. If the observed effect is confirmed with a larger sample of high-z galaxies the implied consequences would be quite important, both for the physics of high-z galaxies and for the use of [CII] to search and investigate high-z galaxies in future surveys.
In the following we speculate on the possible origin of the enhanced [CII] emission in high-z galaxies relative to local galaxies of the same luminosity. The offset observed in Fig. 2 between local and high-z galaxies cannot be ascribed to an additional contribution to due, for instance, to the AGN hosted in these high-z systems (and anyhow present also in several of the local galaxies). Indeed, a varying contribution by AGNs would move objects nearly parallel to the black solid line. Moreover, the far-IR luminosity of (sub-)mm bright quasars (such as the ones discussed here) is generally found to be mostly powered by star formation (Lutz et al., 2007, 2008).
Another possibility is that these high-z galaxies are characterized by a lower metallicity of the ISM. Observationally, local low metallicity galaxies tend to show enhanced [CII]158m emission (Rubin et al., 2009; Poglitsch et al., 1995; Israel et al., 1996; Madden, 2000). The effect is apparent from the location of LMC in Fig. 2 (Rubin et al., 2009). Probably the enhanced [CII] emission in low metallicity galaxies is due to the lower dust content (hence lower dust attenuation to UV photons), which makes the C+ emitting region larger, and also makes the far-IR emission lower (Rubin et al., 2009). Regardless of the physical origin of the effect, if high-z galaxies are characterized by a reduced metallicity, this may enhance their [CII] emission similarly to local low metallicity galaxies. High-z star forming galaxies are indeed observed to have lower gas metallicities than local galaxies (Maiolino et al., 2008). For galaxies hosting quasars, as the ones investigated here, the situation is more complex. Various studies have found that the metallicity in the Broad Line Region (BLR) of high-z quasars is very high (several times solar) and does not evolve with redshift (Juarez et al., 2009; Jiang et al., 2007; Nagao et al., 2006a). However, the BLR is a very tiny region (1pc) in quasar nuclei, which is probably not representative of the ISM in the host galaxy, and may undergo quick enrichment with just a few supernova explosions (see detailed discussion in Juarez et al., 2009). A few studies have investigated the metallicity on the larger scales (100pc–10kpc) of the Narrow Line Region (NLR) in high-z AGNs (Nagao et al., 2006b; Matsuoka et al., 2009; Vernet et al., 2001; De Breuck et al., 2000; Humphrey et al., 2008). These studies are currently limited to z4 (i.e. not yet overlapping with our high-z [CII]-sample). However the inferred NLR metallicities are much lower than in the BLR, about solar or sub-solar, which is indeed less than the metallicity observed in local massive galaxies (Maiolino et al., 2008).
Regardless of the physical origin of the [CII] enhancement in high-z galaxies, if confirmed this effect would have important implications for the planning of future surveys at high-z as well as for the development of submm/mm facilities. Our result would imply that, at least at high infrared luminosities, the [CII] line in high-z galaxies is about an order of magnitude stronger than previously expected based on local templates. The [CII] line is probably a much more powerful cosmological tool to detect and characterize high-z galaxies than previously thought.
Acknowledgements.
We thank the anonymous referee for very helpful comments and M. Bartelmann for useful discussions. We are grateful to the ESO-APEX staff for their support and help during the execution of the project.References
- Abel et al. (2009) Abel, N. P., Dudley, C., Fischer, J., Satyapal, S., & van Hoof, P. A. M. 2009, arXiv:0903.4643
- Crawford et al. (1985) Crawford, M. K., Genzel, R., Townes, C. H., & Watson, D. M. 1985, ApJ, 291, 755
- Curran (2008) Curran, S.J. 2008, A&A in press, arXiv:0807.4365
- De Breuck et al. (2000) De Breuck, C., Röttgering, H., Miley, G., van Breugel, W., & Best, P. 2000, A&A, 362, 519
- Gerin & Phillips (2000) Gerin, M., & Phillips, T. G. 2000, ApJ, 537, 644
- Guilloteau et al. (1999) Guilloteau, S., Omont, A., Cox, P., McMahon, R. G., & Petitjean, P. 1999, A&A, 349, 363
- Humphrey et al. (2008) Humphrey, A., Villar-Martín, M., Vernet, J., Fosbury, R., di Serego Alighieri, S., & Binette, L. 2008, MNRAS, 383, 11
- Keeton (2001) Keeton, C. R. 2001, arXiv:astro-ph/0102340
- Iono et al. (2006) Iono, D., et al. 2006, ApJ, 645, L97
- Israel et al. (1996) Israel, F. P., Maloney, P. R., Geis, N., Herrmann, F., Madden, S. C., Poglitsch, A., & Stacey, G. J. 1996, ApJ, 465, 738
- Jiang et al. (2007) Jiang, L., Fan, X., Vestergaard, M., Kurk, J. D., Walter, F., Kelly, B. C., & Strauss, M. A. 2007, AJ, 134, 1150
- Juarez et al. (2009) Juarez, Y., Maiolino, R., Mujica, R., Pedani, M., Marinoni, S., Nagao, T., Marconi, A., & Oliva, E. 2009, A&A, 494, L25
- Kaufman et al. (1999) Kaufman, M. J., Wolfire, M. G., Hollenbach, D. J., & Luhman, M. L. 1999, ApJ, 527, 795
- Lehár et al. (2000) Lehár, J., et al. 2000, ApJ, 536, 584
- Luhman et al. (1998) Luhman, M. L., et al. 1998, ApJ, 504, L11
- Luhman et al. (2003) Luhman, M. L., et al. 2003, ApJ, 594, 758
- Lutz et al. (2007) Lutz, D., et al. 2007, ApJ, 661, L25
- Lutz et al. (2008) Lutz, D., et al. 2008, ApJ, 684, 853
- Madden (2000) Madden, S. C. 2000, New Astronomy Review, 44, 249
- Maiolino et al. (2005) Maiolino, R., et al. 2005, A&A, 440, L51
- Maiolino (2008) Maiolino, R. 2008, New Astronomy Review, 52, 339
- Maiolino et al. (2008) Maiolino, R., et al. 2008, A&A, 488, 463
- Malhotra et al. (2001) Malhotra, S., et al. 2001, ApJ, 561, 766
- Marsden et al. (2005) Marsden, G., et al. 2005, MNRAS, 359, 43
- Matsuoka et al. (2009) Matsuoka, K., Nagao, T., Maiolino, R., Marconi, A., & Taniguchi, Y. 2009, A&A, submitted
- Nagao et al. (2006a) Nagao, T., Marconi, A., & Maiolino, R. 2006a, A&A, 447, 157
- Nagao et al. (2006b) Nagao, T., Maiolino, R., & Marconi, A. 2006b, A&A, 447, 863
- Negishi et al. (2001) Negishi, T., Onaka, T., Chan, K.-W., & Roellig, T. L. 2001, A&A, 375, 566
- Poglitsch et al. (1995) Poglitsch, A., et al. 1995, ApJ, 454, 293
- Priddey & McMahon (2001) Priddey, R. S., & McMahon, R. G. 2001, MNRAS, 324, L17
- Rubin et al. (2009) Rubin, D., et al. 2009, A&A, 494, 647
- Rusin et al. (2003) Rusin, D., Kochanek, C. S., & Keeton, C. R. 2003, ApJ, 595, 29
- Sanders & Mirabel (1996) Sanders, D. B., & Mirabel, I. F. 1996, ARA&A, 34, 749
- Spergel et al. (2003) Spergel, D. N., et al. 2003, ApJS, 148, 175
- Stacey et al. (1991) Stacey, G. J., Geis, N., Genzel, R., Lugten, J. B., Poglitsch, A., Sternberg, A., & Townes, C. H. 1991, ApJ, 373, 423
- Treu & Koopmans (2004) Treu, T., & Koopmans, L. V. E. 2004, ApJ, 611, 739
- Vassilev et al. (2008) Vassilev, V., et al. 2008, A&A, 490, 1157
- Vernet et al. (2001) Vernet, J., et al. 2001, A&A, 366, 7
- Walter et al. (2009) Walter, F., Riechers, D., Cox, P., Neri, R., Carilli, C., Bertoldi, F., Weiss, A., & Maiolino, R. 2009, Nature, 457, 699
- Weiß et al. (2007) Weiß, A., Downes, D., Neri, R., Walter, F., Henkel, C., Wilner, D. J., Wagg, J., & Wiklind, T. 2007, A&A, 467, 955
- Wright et al. (1991) Wright, E. L., et al. 1991, ApJ, 381, 200
Appendix A The lensing magnification factor
Although and most likely do not depend on the magnification factor, since [CII], CO and FIR are emitted from the same regions of the galactic gaseous disk, the inferred intrinsic luminosities, and in particular do depend on the magnification factor. Therefore, especially for what concerns the versus diagram, it is important to address the issue of the magnification lensing factor in detail.
Guilloteau et al. (1999) provided only a rough estimate of the magnification factor (). Lehár et al. (2000) performed a more detailed lensing analysis by using different mass models for the lensing galaxy along with HST images (although they do not directly provide the associated magnification factors). The positions and the flux ratio of the two quasar images are well reproduced by a Singular-Isothermal-Ellipsoid model (SIE). A constant M/L model, where the lensing mass distribution matches the light distribution of the observed galaxy, plus an external shear (due to galaxies surrounding the lens) also provides a good fit to the data. Details on the best fit parameters describing the lensing models can be found in Tab. 5 of Lehár et al. (2000). Based on the image constraints, it is impossible to differentiate between the SIE and the M/L models. We used the public software GRAVLENS and its application LENSMODEL (Keeton, 2001) to repeat the fits by Lehár et al. (2000) and to reconstruct their lens models. These were used to estimate the magnification factors at the positions of the two quasar images. The lens is a typical early-type galaxy, whose light distribution can be described by means of a De Vaucouleurs profile. The two models predict significantly different magnification factors. Assuming a point source, the SIE and the models give total magnification factors and , respectively. The large difference is caused by the substantially different slope of the two density profiles, being the SIE much steeper than the De Vaucouleurs profile. Without an external shear, the SIE model may be overestimating the lens convergence and therefore the magnification. However, since no correlation is expected between the external shear and the environment of the lens galaxy, it is hard to estimate the possible bias (see the discussion in Lehár et al., 2000). In the model, even a modest external shear strongly perturbs the lens. In general, steeper profiles are favored by observations of strong lensing systems (e.g. Rusin et al., 2003; Treu & Koopmans, 2004). Therefore we can assume that the magnification factor predicted by the model is a lower limit to the true value.
By using the result of the fit of the quasar double image, we attempted to estimate by how much the magnification factor changes for an extended source. This is important in our case since the [CII] and the FIR emissions come from an extended region of the gaseous disc of the quasar host galaxy. For instance, in the case of J1148+5251 at z=6.41, high angular resolution images show that [CII] is distributed in a region of about 1.5 kpc in diameter around the quasar (Walter et al., 2009). By replacing, on the source plane, the point-like source (the quasar nucleus observed in the optical images) with a circular disk (the [CII]-FIR emitting region) of radius (equivalent to kpc at ) centered at the location of the un-lensed quasar (as it results from the modeling of its point images), and mapping it on the lens plane, we find that the total magnification factors change by for both the SIE and the models. The magnification factor does not change significantly when varying the size of the [CII]–FIR disk as long as it is less than 2 kpc in radius. However, we note that the morphology of the extended images is very different for the two models. In particular, the SIE model produces an Einstein ring-like image, while the model produces an extended asymmetric arc and a counter image. Therefore, high angular resolution observations of the [CII] and FIR emission would allow us to discriminate which of the two lens models is more appropriate.
Summarizing, the magnification factor ranges between and , mostly depending on the lens model. In the paper we assume, as a reference, a magnification factor (the mean value of the two extreme magnification factors in log), although we discuss the implications of the wide range of possible magnification factors. For what concerns the intrinsic far infrared luminosity, the observed value inferred by Priddey & McMahon (2001) (and corrected for our assumed cosmology)444Note that moderate uncertainties in the observed move the source essentially along the red dashed line in Fig. 2. , translates into an intrinsic, magnification-corrected far-infrared luminosity of , where the errors reflect the range of possible magnification factors.