Bottomonium at BABAR
Abstract
Originally designed for CP violation studies in the meson system, the -Factories recently showed an exciting capability for improving our experimental knowledge in the field of hadron spectroscopy. Here I will present some of the most recent BABAR results concerning bottomonium spectroscopy. In particular, I’ll report the first observation of the ground state in and the results of an energy scan in the range of 10.54 to 11.20, that produced a new measurement of the cross section in the region of the and candidate and resonances, with an integrated luminosity 30 times larger than the previous scans.
1 Introduction
In the last few years, quarkonium spectroscopy received significant contributions from the -Factory experiments BABAR and Belle. This impact have been recently boosted by the decision of the BABAR Collaboration 111A description of the BABAR detector can be found elsewhere [1]. of running the PEP-II -Factory at different Center of Mass (CM) energies, with the main goal of investigating bottomonium properties at a deeper level. About have been collected at the resonance, providing the largest sample available worldwide at this CM energy. A sample of has been collected at the resonance, and an energy scan of the region above the resonance has been performed.
2 The Discovery
The (simply hereafter) is the ground state of the bottomonium spectrum, discovered by the BABAR collaboration in the decay channel, by exploiting a sample of million of . The mass of the was expected to lie around 9.4, hence the analysis consists of the search for a monochromatic photon of about 900 in the rest frame, accompanied by a set of charged tracks and electromagnetic clusters consistent with a hadronic decay.
Photons are identified as calorimeter clusters isolated from tracks and with a shape consistent with an electromagnetic shower, by requiring a lateral momentum [5] less than 0.55. A veto is also applied, by rejecting photons that, combined with other neutral clusters in the event, give an invariant mass consistent with a hypothesis within 15. In order to achieve a better resolution and a lower background, only the central part of the electromagnetic calorimeter () is used in this analysis. Hadronic decays are selected by requiring at least four tracks in the event. In order to reject the QED background, we require the ratio between the and order Fox-Wolfram moments [6] to be less than 0.98. A selection is finally applied on the angle between the photon and the thrust axis [7, 8]. After this selection, the background is composed of a non-peaking contribution from light mesons decays and peaking contributions from the initial state radiation (ISR) process and the bottomonium transitions ().
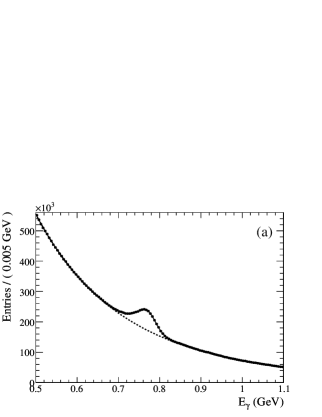
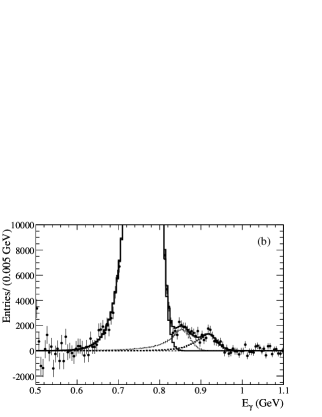
In figure 1 the photon spectrum after the selection is shown. A binned maximum likelihood (ML) fit of the spectrum is performed in the region between 0.5 and 1.1 with four components: non-peaking background, , and the signal. The non-peaking background is parameterized with a probability density function (PDF) given by . The background is described by the superposition of three Crystal Ball (CB) PDFs [9], one for each state. The ISR background is parameterized by a single CB PDF while the signal is described by the convolution of a Breit-Wigner and a CB PDF. The photon spectrum after non-peaking background rejection is also shown in figure 1. The fit yields signal events, corresponding to . A significance of more than 10 standard deviations has been associated to this signal.
The measured mass is , corresponding to a hyperfine splitting of . It is in agreement with recent lattice results [10], but a significant disagreement is found with respect to QCD calculations [11].
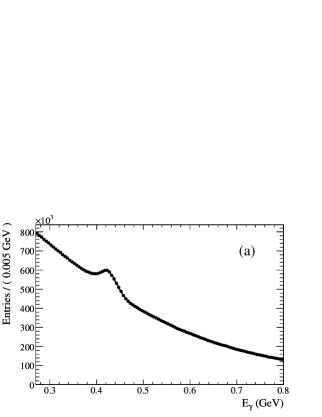
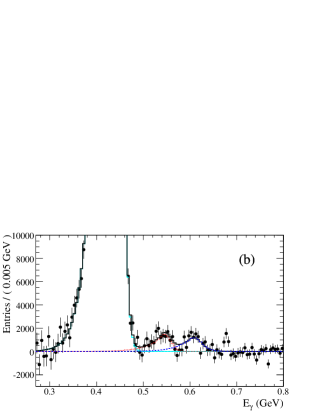
This result has been confirmed by a similar analysis performed on the data sample, looking for . In this case, a lower energy photon is present, implying a larger non-peaking background but also a better absolute energy resolution, allowing for a better separation of the signal from the other peaking components. We obtained and , with a 3.5 signal significance. The corresponding fit is shown in figure 2.
3 scan above the resonance
The recent discovery of exotic charmonium-like states [12] suggest the possibility of the existence of similar bottomonium-like states. A naive scaling of the new states, according to the typical mass difference between bottomonia and charmonia, suggests that new bottomonium states could lie in the region between the and the candidate and . The BABAR Collaboration performed an energy scan of this region in order to investigate this possibility.
The CM energy has been moved from 10.54 to 11.20, in steps of 5, collecting about 25 per step, for a total of 3.3. An additional scan of the region, with 8 steps of 600 has been also performed. The BABAR scan improves by a factor of 30 the statistics of the previous scans [13, 14], with 4 times finer steps.
We adopted an inclusive analysis strategy, looking for unexpected structures in the hadronic ratio , where is the point like cross section. We normalized our measurement to the measured cross section, by writing , where () is the number of produced () pairs and account for radiative corrections to the point-like cross section (estimated from MC calculation using KK2f [15]).
In order to estimate and , we need to reconstruct and select a and a sample, and correct the number of observed events for background contamination and signal efficiency. The sample is selected by requiring at least three tracks in the event and a reconstructed energy of at least 4.5. The vertex of the tracks is required to be within 5 mm from the beam crossing in the transverse plane and 6 cm along the beam axis. The selection requirement is also applied to reject the , background. Dimuon events are selected by requiring exactly two tracks with invariant mass larger than 7.5, a polar angle and a collinearity better than 10∘.
The first scan point, at 10.54, where no production is expected, is used as a reference point to evaluate the background contaminating the sample. Two components are present: residual background and two-photons . Their cross sections are estimated at the reference point and scaled according to the expected trend ( for the background and for the two-photon background), while background efficiencies are evaluated by means of MC simulation for different CM energies. Similar simulations are used in order to estimate the signal efficiency.
The sample is also used for a precise measurement of the center of mass energy for each scan point, extracted by means of a fit of the invariant mass spectrum. This strategy has been validated by using data collected around the peak and comparing the results with the most precise determination of the peak position [16].
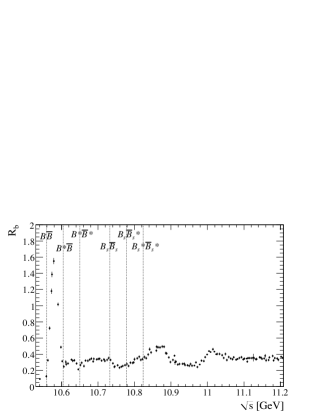
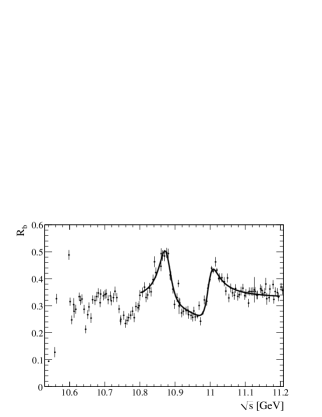
Figure 4 shows the result of the scan. The presence of several thresholds in the explored region makes difficult the interpretation of the results. Two evident structures between 10.60 and 10.75 are present, in agreement with theoretical predictions [17]. A fit for the extraction of the and masses and widths has been also performed and is shown in figure 4. The two resonances are modeled with two Breit-Wigner functions and a flat continuum is added. These components are also allowed to partially interfere. The results are quoted in Table 1 and show a significant disagreement with respect to the present world averages. Anyway, we want to stress that such a kind of naive parameterization is not suitable for describing the production near threshold, and more refined models should be used [18]. The disagreement between the current world average and our result, which is based on a more detailed scan, actually demonstrates that naive fits can provide inconsistent results and should be interpreted with care.
| \bhline | BABAR | PDG | ||
|---|---|---|---|---|
| mass () | ||||
| width () | ||||
| \bhline | ||||
References
References
- [1] Aubert B et al. (BABAR) 2002 Nucl. Instrum. Meth. A479 1–116
- [2] Aubert B et al. (BABAR) 2008 Phys. Rev. Lett. 101 071801
- [3] Aubert B et al. (BABAR) 2009 (Preprint arXiv:0903.1124 [hep-ex])
- [4] Aubert B et al. (BABAR) 2009 Phys. Rev. Lett. 102 012001
- [5] Drescher A et al. 1985 Nucl. Instrum. Meth. A237 464
- [6] Fox G C and Wolfram S 1979 Nucl. Phys. B149 413
- [7] Brandt S, Peyrou C, Sosnowski R and Wroblewski A 1964 Phys. Lett. 12 57
- [8] Farhi E 1977 Phys. Rev. Lett. 39 1587
- [9] Gaiser J 1982 Ph.D. thesis available as SLAC-0255
- [10] Gray A et al. 2005 Phys. Rev. D72 094507
- [11] Kniehl B A, Penin A A, Pineda A, Smirnov V A and Steinhauser M 2004 Phys. Rev. Lett. 92 242001
- [12] Faccini R 2008 (Preprint 0801.2679)
- [13] Besson D et al. (CLEO) 1985 Phys. Rev. Lett. 54 381
- [14] Lovelock D M J et al. 1985 Phys. Rev. Lett. 54 377
- [15] Jadach S, Ward B F L and Was Z 2000 Comput. Phys. Commun. 130 260
- [16] Artamonov A S et al. (OLYA, MD1) 2000 Phys. Lett. B474 427
- [17] Tornqvist N A 1984 Phys. Rev. Lett. 53 878
- [18] Eichten E, Gottfried K, Kinoshita T, Lane K D and Yan T M 1980 Phys. Rev. D21 203
- [19] Yao W M et al. (Particle Data Group) 2006 J. Phys. G33 1