11institutetext: Instituto de Astronomía Teórica y Experimental IATE, CONICET, Laprida 922, X5000BGR, Córdoba, Argentina 22institutetext: Observatorio Astronómico, Universidad Nacional de Córdoba, Laprida 854, X5000BGR, Córdoba, Argentina
22email: vcoenda@mail.oac.uncor.edu; hernan@.mail.oac.uncor.edu

Galaxy properties in clusters: Dependence on the environment and the cluster identification techniques

V. Coenda 1122    H. Muriel 1122
Abstract

Aims. We investigate the dependence of several galaxy properties on the environment and cluster identification techniques.

Methods. We select clusters of galaxies from two catalogues based on the SDSS: the ROSAT-SDSS Galaxy Cluster Survey, which is an X-ray selected cluster sample and the MaxBCG Catalogue, in which clusters are optically selected. Based on a volume limited sample of galaxies drawn from the spectroscopic DR5 SDSS, we constructed sub-samples of clusters of galaxies with more than ten members. Scaling relations as well as segregation of galaxy properties as a function of the normalized clustocentric radii are analyzed. The properties of galaxies in clusters are compared with those of field galaxies.

Results. Galaxies in X-ray and MaxBCG selected clusters show similar size-luminosity relations. At equal luminosity, late type galaxies in the field have sizes smaller than cluster galaxies of the same morphological type.

The Faber-Jackson relation for early-type galaxies in clusters is also the same for X-ray selected and MaxBCG clusters. We found clear differences between the dynamical properties of galaxies in clusters, the brightest cluster galaxies (BCGs𝐵𝐶subscript𝐺𝑠BCG_{s}) and field galaxies.

Using several criteria to classify galaxies into morphological types, we reproduce the well know morphological segregation. The correlation is up to r/r2001similar-to𝑟subscript𝑟2001r/r_{200}\sim 1. For the whole range of clustocentric distances, X-ray selected clusters present a higher fraction of early type galaxies than MaxBCG clusters. We also found that bright galaxies preferentially inhabit the cluster centers. Median sizes of galaxies, such as the radius that enclose 50%percent5050\% of Petrosian flux r50subscript𝑟50r_{50}, present a behaviour that also depends on the cluster selection criteria. For galaxies in X-ray selected clusters, median values of r50subscript𝑟50r_{50} decrease as r/r200𝑟subscript𝑟200r/r_{200} goes to zero, whereas the opposite is observed for galaxies in the MaxBCG clusters. These different behaviours are mainly due to early type galaxies.

The results are discussed in terms of the different processes that affect the evolution of galaxies in different environments.

Key Words.:
galaxies: clusters – galaxies: fundamental parameters

1 Introduction

It is well known that galaxies show a wide range of morphologies, which can be appreciated in their properties such as colour, luminosity, size, star formation histories, etc, which imply that galaxies form and evolve through different mechanisms. There have been many studies about the distribution of galaxies with respect to their properties. For example, the luminosity function has been measured from various surveys of galaxies and clusters of galaxies and it is found to be well described by the Schechter function (Schechter 1976, Loveday et al. 1992, Folkes et al. 1999, Madgwick et al. 2002, Cross et al. 2004); the morphological types of galaxies are found to be correlated with the environment, clusters of galaxies being the best example (Dressler 1980, Dressler et al. 1997, Domínguez et al. 2001, Coenda et al. 2006). It is also well known that different galaxy properties are correlated to each other. Galaxy sizes are correlated with the luminosity and morphological type (Andredakis et al. 1995, Möllenhoff & Heidt 2001, Coenda et al. 2005, McIntosh et al. 2005, Trujillo et al. 2006), and have a distribution that may be described by a log-normal function (Syer et al. 1999, de Jong & Lacey 2000, Shen et al. 2003, Ferguson et al. 2004). In order to constrain the galaxy formation models and the study of galaxy properties and their dependence on environment, we concentrate our studies on several scaling relations and galaxy segregation.

There are different scaling relations between photometric and structural parameters of galaxies, resulting in well known relations. One of the most established empirical scaling relations of disk galaxies is the Tully-Fisher relation (Tully & Fisher 1977), which consist of a correlation between luminosity and rotational velocity. The analogous relation for spheroidal galaxies is the correlation between the velocity dispersion of bulges and luminosity, known as the Faber-Jackson relation: Lσβproportional-to𝐿superscript𝜎𝛽L\propto\sigma^{\beta} (Faber & Jackson 1976). Other scaling relations for spheroidal galaxies are: color-magnitude (Sandage & Visvanathan 1978a, b), color-velocity dispersion (Bernardi et al. 2005), radius-luminosity (Sandage & Perelmuter 1990) and the Kormendy relation, which is a correlation between radius and surface brightness (Kormendy 1977). Some of these properties have been combined to define the so-called fundamental plane that relates the velocity dispersion, the effective radius and the luminosity (Djorgovski & Davis 1987, Dressler et al. 1987, Bernardi et al. 2003). These empirical relations are closely related to the physical processes involved in the galaxy formation scenario and, therefore, are a fundamental tool to understand the formation and evolution of galaxies. These relations could depend on the environment where galaxies form and evolve, introducing departures from scatter in the different scaling relations. Several authors have investigated the scaling relations of galaxies in clusters. Ziegler et al. (1999), La Barbera et al. (2004), Bernardi et al. (2007), von der Linden et al. (2007), Liu et al. (2007) and Bildfell et al. (2008). von der Linden et al. (2007) found that brightest cluster galaxies (BCG) have a higher fraction of dark matter and consequently larger radii and higher velocity dispersions that non-BCG galaxies. Malumuth & Kirshner (1981, 1985), Oegerle & Hoessel (1991) and more recently Bernardi et al. (2007) found that BCG have smaller β𝛽\beta than the rest of the cluster members. Bernardi et al. (2007) also analyze the dynamical mass (Mdynr50σ2proportional-tosubscript𝑀𝑑𝑦𝑛subscript𝑟50superscript𝜎2M_{dyn}\propto r_{50}\sigma^{2}) and found that BCGs show a steeper relation than non-BCG galaxies. The majority of the works mentioned above do not make a suitable comparison with field galaxies, making it very difficult ti perform a complete comparison of the scaling relations of galaxies as a function of the environment. More recently, Weinmann et al. (2009) and Guo et al. (2009) analyzed samples of galaxies in groups and found that, at fixed stellar mass, the sizes of central and satellite early type galaxies are similar, while Bernardi (2009), analyzing galaxies in clusters, reported a difference at high luminosities/stellar masses between central and satellite galaxies.

It is well known that different types of galaxies show different spatial distributions (Oemler 1974, Melnick & Sargent 1977, Dressler 1980). These differences can be estimated measuring the radial dependence of the galaxy properties as a function of the clutocentric distance. The segregation of galaxies in clusters has been quantified splitting galaxies according to different properties, with the morphology the property that has been most extensively studied, see for instance Dressler (1980), Whitmore et al. (1993), Domínguez et al. (2001), Biviano et al. (2002), Driver et al. (2003), Coenda et al. (2006). Goto et al. (2002) found that the morphological segregation tends to disappear for clustocentric distances larger than the virial radius. Recently, Martínez et al. (2008) found that gr𝑔𝑟g-r color is the property of galaxies that best predict the normalized clutocentric distance of galaxies among a set of galaxy properties. Similarly, Skibba et al. (2008) used the galaxy sample of visual classified morphologies and found that much of the morphology-density relation is due to the relation between colour and density. The works that have studied the segregation in luminosity present some contradictory results. Rood & Turnrose (1968), Yepes et al. (1991), Lobo et al. (1997), Kashikawa et al. (1998), Coenda et al. (2006) found results consistent with a segregation in luminosity. Nevertheless, Noonan (1961), Bahcall (1973) and more recently Pracy et al. (2005) found results consistent with a lack of segregation in luminosity. The segregation of other properties like color, star formation rate, gas content or structural parameters have been much less studied.

The identification of clusters of galaxies is a complex process whose outcome depends on the selection criteria. Popesso et al. (2004) compiled X-ray clusters in the Sloan Digital Sky Survey (SDSS). Using the same survey, Koester et al. (2007b) applied a maxBCG algorithm to identified clusters. This technique is based on the color-magnitude relation of the early type galaxies and the properties of the BCGs. Because we are interested in comparing the galaxy properties of clusters selected with different criteria, the same analysis will be performed on sub-samples of the catalogues compiled by Popesso et al. (2004) and Koester et al. (2007b).

This paper is organised as follows: in section 2 we describe the cluster and galaxy samples; in section 3 we investigate several galaxy scaling relations; in section 4 we analyze the galaxy segregation. We summarise and discuss our results in section 5.

2 The sample

2.1 The cluster sample

We use two catalogues of clusters of galaxies based on the Sloan Digital Sky Survey (SDSS; York et al. 2000): the ROSAT-SDSS Galaxy Cluster Survey of Popesso et al. (2004, hereafter P04), which is a X-ray selected cluster sample and the MaxBGC Catalogue of Koester et al. (2007b, hereafter K07), which is an optically selected cluster sample.

The ROSAT-SDSS catalogue of Popesso et al. (2004) comprises 114 galaxy clusters detected in the ROSAT All Sky Survey (RASS) lying in the area surveyed by the SDSS by February 2003. This X-ray-selected catalogue includes clusters with masses from 1012.5superscript1012.510^{12.5}\cal{M} to 1015superscript101510^{15}\cal{M} in the redshift range 0.002z0.450.002𝑧0.450.002\leq z\leq 0.45. This catalogue provides X-ray properties of the clusters derived from the ROSAT data, parameters of the galaxy luminosity function and the luminosity of each cluster computed from SDSS data, and the radial distribution of the projected galaxy density around clusters. Since the X-ray observations provide a robust method for identifying clusters, these clusters constitute a reliable source of information to study galaxy properties and their correlation with the environment.

The optical MaxBGC catalogue provides sky locations, photometric redshift estimates and richness for 13823 clusters. Details of the selection algorithm and catalogue properties are published in Koester et al. (2007a, b) The MaxBGC selection relies on the observation that the galaxy population of rich clusters is dominated by bright red galaxies tightly clustered in colour (the E/S0 ridgeline). Since these galaxies are old, passively evolving stellar populations, their gr𝑔𝑟g-r colours closely reflect their redshifts. The brightest red galaxy, typically located at the peak of the galaxy density, defines the cluster centre. The K07 catalogue comprises galaxy clusters with velocity dispersions σ400kms1𝜎400kmsuperscripts1\sigma\geq 400\rm{km\leavevmode\nobreak\ s^{-1}} and redshifts 0.1z0.30.1𝑧0.30.1\leq z\leq 0.3. Each of these clusters contains between 10 and 190 E/S0 ridgeline galaxies brighter than 0.4L0.4subscript𝐿0.4L_{*} (i𝑖i-band), within a scaled radius r200subscript𝑟200r_{200} defined as the mean density of 200 times the mean density of the universe. SDSS spectroscopic redshifts are available for at least the brightest galaxy in 39%percent3939\% of the clusters. The sample is up to 85%percent8585\% complete for clusters with masses 1014absentsuperscript1014\geq 10^{14}\cal{M}.

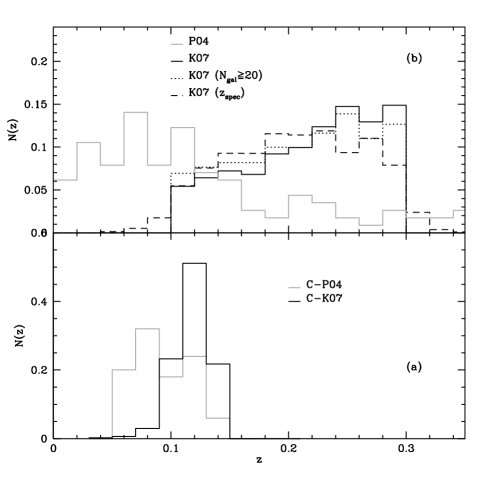
The sub-samples from P04 and K07 considered in this paper comprise galaxy clusters in the redshift range 0.05<z<0.140.05𝑧0.140.05<z<0.14. The upper limit was taken in order to have a volume limited sample of galaxies with an adequate balance between the number of clusters, the range in absolute magnitude and the number of cluster members. For K07 clusters, we applied a restriction in the richness, selecting clusters with Ngal20subscript𝑁𝑔𝑎𝑙20N_{gal}\geq 20 in order to have cluster masses comparable to those in the P04 sample. The sub-samples are labeled as C-P04 and C-K07 respectively. To select cluster members and estimate the physical properties of clusters, we use the Main Galaxy Sample (MGS, Strauss et al. 2002) of the Fifth Data Release (DR5) of SDSS (Adelman-McCarthy et al. 2007) that is complete down to a Petrosian (1976) magnitude r=17.77𝑟17.77r=17.77. At this point, our sub-samples comprise 54 X-ray galaxy clusters from the P04 sample and 612 from the K07 sample. We show in panel (a) of Figure 1 the spectroscopic redshift distribution of 114 galaxy clusters of the P04 sample (grey solid line), the photometric redshift distribution of 13823 galaxy clusters of the K07 sample (black solid line), the distributions of those K07 clusters with Ngal20subscript𝑁𝑔𝑎𝑙20N_{gal}\geq 20 (dotted line) and the distribution of those K07 clusters with spectroscopic redshifts (dashed line). Panel (b) shows the redshift distributions of the selected clusters C-P04 (grey line) and C-K07 (black line). We cross-correlated the catalogues to pick clusters that are included in both of them. If the projected distance between 2 clusters each belonging to a different catalogue is <1Mpcabsent1Mpc<1{\rm Mpc}, we consider that they are the same cluster. We found 20 coincidences; in these cases the clusters are only included in the X-ray sub-sample (C-P04).

Refer to caption
Figure 1: Panal (a) shows the spectroscopic redshiht distribution of the P04 galaxy clusters (grey solid line), the photometric redshift distribution of the K07 galaxy clusters (black solid line), the distributions of those K07 clusters with Ngal20subscript𝑁𝑔𝑎𝑙20N_{gal}\geq 20 (dotted line) and the distribution of those K07 clusters with spectroscopic redshifts (dashed line). Panel (b) shows the redshift distributions of the selected clusters C-P04 (grey line) and C-K07 (black line).

In order to compute cluster properties such as velocity dispersion, we first identified the cluster members. We use SDSS galaxies from the MGS within a projected radius of 3Mpc3Mpc3{\rm Mpc} centred on the quoted cluster coordinates. From these galaxies we identify cluster members in two steps. First, we use the friends-of-friends (fof) algorithm developed by Huchra & Geller (1982) with the percolation linking length values according to Díaz et al. (2005). As a result, we get for each field a list of substructures with at least 10 members identified by fof. The second step consists of eyeball examination of the structures detected by fof, a comparison between them and the listed cluster position and redshift to determine which coordinates and redshift fit better the observed galaxy over-density. From the redshift distribution of galaxies within |czczcluster|3000kms1𝑐𝑧𝑐subscript𝑧cluster3000kmsuperscripts1|cz-cz_{\rm cluster}|\leq 3000\rm{km\leavevmode\nobreak\ s^{-1}} we determine the line-of-sight extension of each cluster, i.e., a maximum and a minimum redshift for the cluster. We then consider as cluster members all galaxies in the field that are within that redshift range. The Díaz et al. (2005) technique includes an iterative method that provides precise dynamical centres of the clusters. When these centres differ from those computed by Koester et al. (2007a), we adopted the fof values. We found that for 40%similar-toabsentpercent40\sim 40\% for the clusters, the angular position given by the fof is different from the original value, whereas for 17%similar-toabsentpercent17\sim 17\% of the clusters the redshift derived from the fof algorithm is a better match to the observed galaxy redshift distribution than those quoted in the original catalogues. Finally, we excluded from our sample those clusters for which the fof redshift value lay outside the redshift range we consider in this paper.

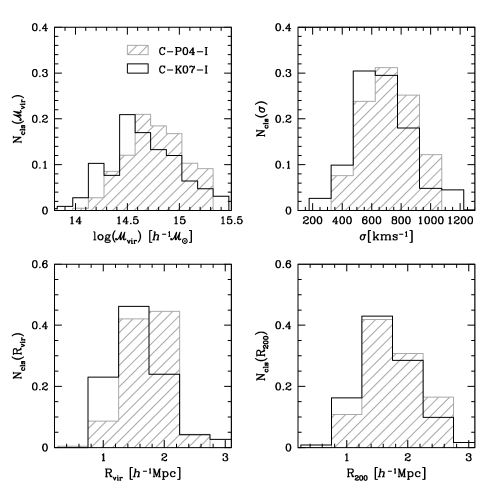
Once the members of each cluster are selected, we compute cluster physical properties we are interested in. We compute the line-of-sight velocity dispersion σ𝜎\sigma, the virial radius and mass and the r200subscript𝑟200r_{200}. The line-of-sight velocity dispersion σ𝜎\sigma is estimated using methods described by Beers et al. (1990). The bi-weight estimator was applied to clusters with 15absent15\geq 15 members, whereas the gapper estimator was applied to poorer clusters. The radius r200subscript𝑟200r_{200} was computed using the approximation provided by Carlberg et al. (1997). In a first step, we determined these parameters using all the cluster members within a 3Mpc3Mpc3{\rm Mpc} projected distance. After this step, we recalculated σ𝜎\sigma and r200subscript𝑟200r_{200} using only galaxies located inside r200subscript𝑟200r_{200}. Virial radis and masses were computed following Merchán & Zandivarez (2005). The mean values of these parameters are shown in Table 1, where it can be seen that the sample C-P04 includes on average clusters slightly more massive and larger than the sample C-K07. Figure 2 shows the distributions of cluster physical properties of our samples. The distributions of the main properties of the 20 coincident clusters are similar to those of the parent samples.

Sample σ𝜎\sigma R200subscript𝑅200R_{200} \cal{M}vir Rvirsubscript𝑅𝑣𝑖𝑟R_{vir}
[kms1kmsuperscripts1\rm{km\leavevmode\nobreak\ s^{-1}}] [h1Mpcsuperscript1Mpch^{-1}{\rm{Mpc}}] [h1superscript1h^{-1}\cal{M}] [h1Mpcsuperscript1Mpch^{-1}{\rm{Mpc}}]
C-P04-I 715715715 1.771.771.77 7×10147superscript10147\times 10^{14} 1.751.751.75
C-K07-I 675675675 1.671.671.67 6×10146superscript10146\times 10^{14} 1.591.591.59
Table 1: Mean values of the cluster physical properties of our cluster samples.

Through visual inspection we classified clusters based on their substructure. We only consider in our analysis sub-samples of regular clusters, that we label C-P04-I and C-K07-I, and we exclude systems that have two or more close substructures of similar size in the plane of the sky and/or in the redshift distribution. In order to compute the physical properties in a reasonable way, clusters with fewer than 10 galaxy members within r200subscript𝑟200r_{200} are excluded (Girardi et al. 1993). Our final galaxy cluster sample comprises 49 clusters from C-P04-I and 209 from C-K07-I. Our sample of MaxBCG clusters is an order of magnitude smaller than the sample considered by Bernardi (2009), also based on the Koester et al. (2007a) catalogue. This difference is mainly due to our restriction to select clusters with at least ten spectroscopic members in the redshift range 0.05<z<0.140.05𝑧0.140.05<z<0.14. The sample of Bernardi (2009) includes clusters with redshift up to 0.3 and has, on average, fewer than one spectroscopic early-type satellite galaxy per cluster.

Refer to caption
Figure 2: Distributions of cluster physical properties. The solid grey lines show the C-P04-I sample while the dashed histograms correspond to the C-K07-I sample.

2.2 The galaxy sample

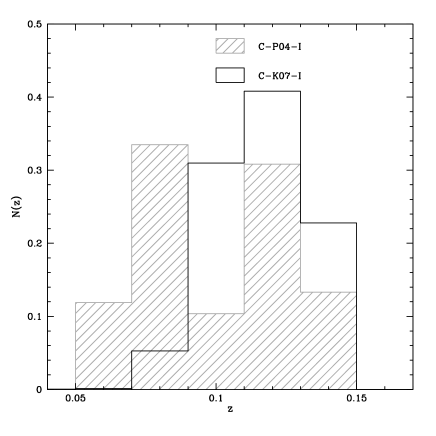
In order to avoid the use of weights and since we are interested in bright galaxies, we have constructed a volume limited samples instead of a flux limited sample. Taking into account the depth of our sample (z<0.14𝑧0.14z<0.14) and the apparent magnitude limit of the Main Galaxy Sample of the SDSS, our sample of galaxies only includes objects with Mr0.1<21.3subscript𝑀superscript𝑟0.121.3M_{{}^{0.1}r}<-21.3. The C-P04-I sample comprises 786 galaxies, while the C-K07-I sample has 3041 galaxies. Figure 3 shows the redshift distributions of galaxies of our samples, C-P04-I clusters with the grey line and C-K07-I sample with the black line. Galaxy magnitudes used throughout this paper have been corrected for galactic extinction following Schlegel et al. (1998), absolute magnitudes have been computed assuming Ω0=0.3subscriptΩ00.3\Omega_{0}=0.3, ΩΛ=0.7subscriptΩΛ0.7\Omega_{\Lambda}=0.7 and H0=70hkms1Mpc1subscript𝐻070kmsuperscripts1superscriptMpc1H_{0}=70\leavevmode\nobreak\ h\leavevmode\nobreak\ {\rm km\leavevmode\nobreak\ s^{-1}\leavevmode\nobreak\ Mpc^{-1}} and Klimit-from𝐾K-corrected using the method of Blanton et al. (2003) (KCORRECT version 4.1). All magnitudes are in the AB system.

Among the available data for each object in the MGS, we have selected for our analyses parameters that are related to different physical properties of galaxies: luminosity, star formation rate, light distribution inside the galaxies and the dominant stellar populations. In particular, the galaxy parameters we have focused our study on are the Petrosian rlimit-from𝑟r-band absolute magnitude Mr0.1subscript𝑀superscript𝑟0.1M_{{}^{0.1}r} and the radius that encloses 50% of the Petrosian flux r50subscript𝑟50r_{50}. We have chosen Petrosian quantities that are not corrected for the effects of seeing. In order to reduce the effect of the PS on galaxy sizes, we excluded galaxies with r50<2′′subscript𝑟50superscript2′′r_{50}<2^{\prime\prime}, i.e. 0.5′′superscript0.5′′0.5^{\prime\prime} greater than the average seeing in SDSS. This is a conservative threshold, since the PSF in SDSS is known quite accurately (Shen et al. 2003). Hyde & Bernardi (2009) analysed residuals from the size-luminosity relation in the SDSS Petrosian r𝑟r-band in different redshift ranges. As expected, they found that the effect of seeing increases as a function of redshift. However, in our redshift range (0.05<z<0.140.05𝑧0.140.05<z<0.14), these residuals are close to 00.

Our sample consists of bright galaxies in crowded fields where SDSS reductions tend to overestimate the sky level. This results in underestimates of magnitudes and half-light radius for large half-light radii galaxies (Adelman-McCarthy et al. 2008, Bernardi et al. 2007, Hyde & Bernardi 2009). In order to correct the magnitudes and sizes by sky level, we have fitted curves to SDSS simulations (DR6 documentation) and we used these fits to correct the SDSS reductions. Briefly, SDSS quantified the sky effect by adding simulated galaxies (with exponential or de Vaucouleurs) profiles to SDSS images. The simulated galaxies ranged from apparent magnitude r=12𝑟12r=12 to r=19𝑟19r=19 in half-magnitude steps, with a one-to-one mapping from r𝑟r to Sérsic half-light radius (Sérsic 1963, 1968) determined using the mean observed relation between these quantities for MGS with exponential and de Vaucouleurs profiles. Axis ratios of 0.5 and 1 were used, with random position angle for the non-circular simulated galaxies. They found a difference between the input magnitude and the model magnitude returned by the SDSS photometric pipeline, as a function of magnitude. Their results are consistent with a separate analysis performed by Hyde & Bernardi (2009). Finally, we have estimated the rest-frame radius r50subscript𝑟50r_{50} in r𝑟r-band interpolating the observed radii in the adjacent i𝑖i-band as in Hyde & Bernardi (2009).

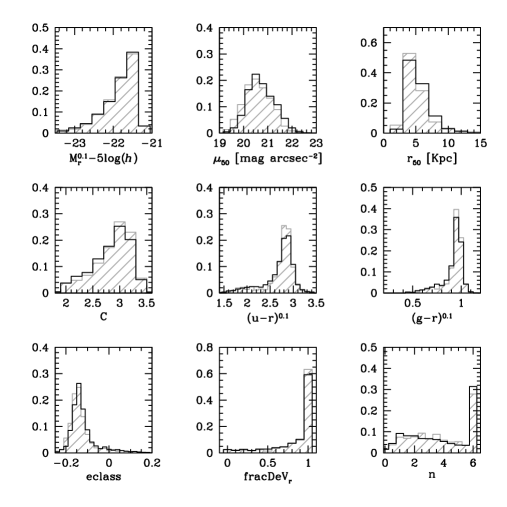
Since the aim of this work is to analyze scaling relations and segregation of different types of galaxies in clusters and its comparison with field galaxies, we adopt several criteria to classify galaxies. Shimasaku et al. (2001) found that the concentration index shows a strong correlation with morphological type. These authors conclude that C𝐶C is perhaps the best parameter to classify the morphology of galaxies. They also found that galaxies with R50<2"subscript𝑅502"R_{50}<2" show a weaker correlation between C𝐶C and the morphological type. To separate galaxies into early and late types, we use the rlimit-from𝑟r-band concentration index defined as the ratio between the radii that enclose 90% and 50% of the Petrosian flux, C=r90/r50𝐶subscript𝑟90subscript𝑟50C=r_{90}/r_{50}. Typically, early-type galaxies have C>2.5𝐶2.5C>2.5, while for late-types C<2.5𝐶2.5C<2.5 (Strateva et al. 2001). We also use the color to discriminate between early and late type galaxies. The corresponding threshold is (gr)0.1=0.80.03(Mr+20){}^{0.1}(g-r)=0.8-0.03(M_{r}+20) (see Blanton & Berlind (2007)). Other indicator of galaxy type is the mono-parametric spectral classification based on the eigentemplate expansion of galaxy’s spectrum eclasseclass{\rm eclass}. This parameter ranges from about 0.350.35-0.35 for early-type galaxies to 0.50.50.5 for late-type galaxies (Yip et al. 2004); the separation is set at eclass=0.1𝑒𝑐𝑙𝑎𝑠𝑠0.1eclass=-0.1. Finally, we use the Sérsic index n𝑛n, taken from Blanton et al. (2005a). The distribution of n𝑛n shows a bimodal distribution (see for instance Ball et al. (2008) and Driver et al. (2006)). The n𝑛n separation is set at 2.52.52.5, the value that divides in equal parts the two distributions and corresponds to objects with approximately equal bulge and disk components. In figure 4 we show the distributions of galaxy parameters. We can see that clusters of the C-P04-I sample (on average, slightly more massive than C-K07-I) have a higher fraction of red galaxies than those taken from the C-K07-I sample (89% and 85% respectively).

We are also interested in the study of the brightest cluster galaxies and the comparison with early-type galaxies in both clusters and in the field. We identify the spectroscopic brightest cluster galaxy (BCGs𝐵𝐶subscript𝐺𝑠BCG_{s}) in our sample. The BCGs𝐵𝐶subscript𝐺𝑠BCG_{s} in not necessarily the true BCG due to the following reasons: i) As a consequence of the finite fiber size of the SDSS spectrograph, any two fibers on the same plate need to be spaced at least 55′′superscript55′′55^{\prime\prime} apart. In the case of a fiber collision, objects are selected at random. ii) The MSG is limited at the bright end by the fiber magnitude limits (r=14.5𝑟14.5r=14.5), to avoid saturation and excessive cross-talk in the spectrograph. These two effects together cause the spectroscopic sample to become incomplete.

In figure 5 we show the distributions of BCGs𝐵𝐶subscript𝐺𝑠BCG_{s} parameters. We find that BCGs𝐵𝐶subscript𝐺𝑠BCG_{s} are larger and have lower surface brightness that non-BCGs𝐵𝐶subscript𝐺𝑠BCG_{s}, in agreement with von der Linden et al. (2007). In addition, BCGs𝐵𝐶subscript𝐺𝑠BCG_{s} have higher velocity dispersion than non-BCGs𝐵𝐶subscript𝐺𝑠BCG_{s}. In general, we find that BCGs𝐵𝐶subscript𝐺𝑠BCG_{s} have colors, concentration and eclass𝑒𝑐𝑙𝑎𝑠𝑠eclass parameters typical of normal early-type galaxies. Despite that BCGs𝐵𝐶subscript𝐺𝑠BCG_{s} are usually in the centre of the cluster potential well, we find that the 25% have r/r200>0.5𝑟subscript𝑟2000.5r/r_{200}>0.5. Nevertheless, it is probable that a fraction of these BCGs𝐵𝐶subscript𝐺𝑠BCG_{s} with large r/r200𝑟subscript𝑟200r/r_{200} are not the actual BCG. It is also possible that some of the cluster centres are wrong. Finally, we do not find differences between the mean properties of BCGs𝐵𝐶subscript𝐺𝑠BCG_{s} in the C-P04-I and C-K07-I samples.

Refer to caption
Figure 3: Redshift distributions of galaxies in our samples. Grey line: C-P04-I sample, black line: C-K07-I sample.
Refer to caption
Figure 4: Distributions of galaxy properties of our samples. Grey line: C-P04-I sample, black line: C-K07-I sample.
Refer to caption
Refer to caption
Figure 5: Distributions of BCGs𝐵𝐶subscript𝐺𝑠BCG_{s} (dashed histograms) and nonBCGs𝑛𝑜𝑛𝐵𝐶subscript𝐺𝑠non-BCG_{s} galaxy properties of the samples C-P04-I (left panels) and C-K07-I (right panels).

To perform a suitable comparisson between cluster and field, we construct a set of comparison samples. These were drawn from MGS and consist of galaxies selected at random having the same redshift distribution as C-P04-I and C-K07-I. This procedure excludes the cluster members. For each cluster catalogue we have two types of samples: i) F-P04-T (52560 galaxies) and F-K07-T (51706 galaxies) that reproduce the corresponding total redshift distribution of galaxies in clusters and ii) F-P04-E, F-P04-L, F-K07-E and F-K07-L that reproduce the redshift distributions and concentration index distributions of the early and late type galaxy population of C-P04-I and C-K07-I, respectively.

3 Scaling relations

3.1 Luminosity-size relation
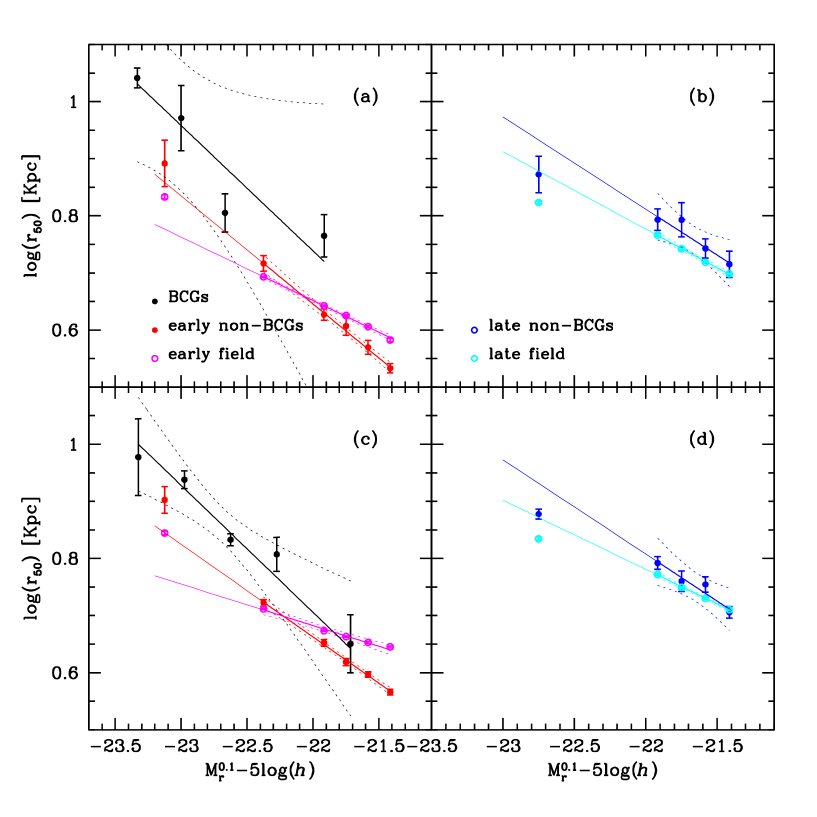
In this section we use the r𝑟r-band concentration index C𝐶C to split galaxies into early and late types, as explained in section 2.2. In Figure 6 we show the correlation between luminosity and the Petrosian half-light radius (r50Lαproportional-tosubscript𝑟50superscript𝐿𝛼r_{50}\propto L^{\alpha}). We plot the median values of log(r50)subscript𝑟50\log(r_{50}) versus Mr0.1superscriptsubscript𝑀𝑟0.1M_{r}^{0.1} for the C-P04-I sample (top panels) and the C-K07-I sample (bottom panels). Error bars were obtained by the bootstrap re-sampling technique. Slopes and zero points in this work correspond to a least-square linear regression. The dotted lines show the 95%percent9595\% confidence bands of the linear regressions . Galaxies in X-ray and MaxBCG selected clusters show similar size-luminosity relations. Early and late type galaxies (red and blue lines respectively) show clear differences, late type galaxies being larger than early types for fixed luminosities. If clusters and field galaxies are compared, we can see in Figure 6 and Table 2 that late type galaxies in the field (cyan lines) are smaller than galaxies in clusters for a fix luminosity.

For early type galaxies (magenta lines), the differences between field and cluster galaxies are also present, although, they are smaller. The effect is stronger for MaxBCG clusters. Finally, in the common range of luminosity, BCGs𝐵𝐶subscript𝐺𝑠BCG_{s} (black lines) tend to be larger and show a steeper log(r50)subscript𝑟50\log(r_{50}) - Mr0.1superscriptsubscript𝑀𝑟0.1M_{r}^{0.1} relation than non-BCG early type galaxies in clusters. Except for BCGs𝐵𝐶subscript𝐺𝑠BCG_{s}, early type galaxies in clusters and in the field show the previously reported curvature in the size-luminosity relation (Bernardi et al. 2007). For these samples of galaxies, linear fits exclude the brightest luminosity bin.

Refer to caption
Figure 6: The luminosity size relation: Median of log(r50)subscript𝑟50\log(r_{50}) versus Mr0.1superscriptsubscript𝑀𝑟0.1M_{r}^{0.1} for the C-P04-I sample (top panels) and the C-K07-I sample (bottom panels). Error bars were obtained by the bootstrap re-sampling technique. Dotted lines show the 95%percent9595\% confidence bands of the linear regression. The red and magenta lines show the linear regression of non-BCGs𝐵𝐶subscript𝐺𝑠BCG_{s} early types in cluster and field respectively. The blue and cyan lines correspond to late types in cluster and field respectively. Black lines show the linear fits for BCGs𝐵𝐶subscript𝐺𝑠BCG_{s}.

We compare our results of the r50Mr0.1subscript𝑟50superscriptsubscript𝑀𝑟0.1r_{50}-M_{r}^{0.1} relation of BCGs with other studies. von der Linden et al. (2007) performed isophotal photometry from the C4 cluster catalogue (Miller et al. 2005) and they found a slope α=0.65±0.02𝛼plus-or-minus0.650.02\alpha=0.65\pm 0.02 for BCGs and α=0.63±0.02𝛼plus-or-minus0.630.02\alpha=0.63\pm 0.02 for a control sample. Liu et al. (2007) derived the luminosity-size relation for 85 BCGs from the same catalogue performing isophotal photometry down to four isophotal limits (22, 23, 24 and 25magarcsec2𝑚𝑎𝑔𝑎𝑟𝑐𝑠𝑒superscript𝑐2\,mag\,arcsec^{-2}); they found that the luminosity-size relation become steeper as the isophotal limit becomes fainter for both BCGs and control sample galaxies. The slope varies between 0.63±0.04plus-or-minus0.630.040.63\pm 0.04 and 0.88±0.04plus-or-minus0.880.040.88\pm 0.04 for BCGs and between 0.58±0.04plus-or-minus0.580.040.58\pm 0.04 and 0.74±0.04plus-or-minus0.740.040.74\pm 0.04 for the control sample. Although these authors used a similar photometry to von der Linden et al. (2007), the difference in the slopes could be related to the differences in the brightness of the samples. Bernardi et al. (2007) fitted a de Vaucouleurs model to SDSS images from the C4 catalogue and used the half-light radius of their best-fitting models to study the luminosity-size relation. These authors found a slope α=0.89𝛼0.89\alpha=0.89. Lauer et al. (2007) used surface photometry in HST images for 219 early type galaxies and also fitted a de Vaucouleurs model; they found α=1.18±0.06𝛼plus-or-minus1.180.06\alpha=1.18\pm 0.06. Once again, the photometry used in the last two works is similar but the results are very different. Again, a suitable explanation is the difference in the construction of the samples. On the other hands, Guo et al. (2009) used 911 central galaxies from SDSS DR4 Group catalogue (Yang et al. 2007). This catalogue is constructed using the New York University Value-Addes Galaxy Catalog (Blanton et al. 2005b). Guo et al. (2009) fitted a Sérsic luminosity profile to each galaxy using GALFIT (Peng et al. 2002), and found a slope α=1.02±0.03𝛼plus-or-minus1.020.03\alpha=1.02\pm 0.03 over the luminosity range 1919-19 to 2424-24. For galaxies brighter than 2222-22, these authors found α=0.82±0.06𝛼plus-or-minus0.820.06\alpha=0.82\pm 0.06. Shen et al. (2003), using spectroscopic SDSS galaxies and also Sérsic luminosity profiles, found α=0.65𝛼0.65\alpha=0.65. Recently, Hyde & Bernardi (2009) used early-type BCGs identified in the SDSS MaxBCGS and C4 catalogs and found α=0.6𝛼0.6\alpha=0.6 for early-type galaxies, while BCGs follow a steeper relation. It should be noted that the slopes resulting from our work are typically shallower than the slopes found in the different works mentioned above. Partially, these differences in slopes could be the result of the different methods used to perform the photometry. While the works mentioned above used de Vaucouleurs, isophotal or Sérsic models, we used Petrosian magnitudes and sizes. In addition, the sample selection causes variations in the value of the slopes; for example the use or not of spectroscopic data can introduce important differences in the results, as has been demonstrated by Coenda et al. (2006). Beyond the differences in the slopes, it should be noted that BCGs always follow a steeper relation than galaxies in control samples.

,

C-P04-I
early non-BCGs BCGs early field
α𝛼\alpha 0.48±0.05plus-or-minus0.480.050.48\pm 0.05 0.55±0.08plus-or-minus0.550.080.55\pm 0.08 0.425±0.008plus-or-minus0.4250.0080.425\pm 0.008
b𝑏b 3.5±0.3plus-or-minus3.50.3-3.5\pm 0.3 4.1±0.6plus-or-minus4.10.6-4.1\pm 0.6 3.10±0.07plus-or-minus3.100.07-3.10\pm 0.07
late late field
α𝛼\alpha 0.4±0.2plus-or-minus0.40.20.4\pm 0.2 0.278±0.005plus-or-minus0.2780.0050.278\pm 0.005
b𝑏b 3±1plus-or-minus31-3\pm 1 1.79±0.04plus-or-minus1.790.04-1.79\pm 0.04
C-K07-I
early non-BCGs BCGs early field
α𝛼\alpha 0.41±0.02plus-or-minus0.410.020.41\pm 0.02 0.55±0.08plus-or-minus0.550.080.55\pm 0.08 0.180±0.003plus-or-minus0.1800.0030.180\pm 0.003
b𝑏b 2.9±0.2plus-or-minus2.90.2-2.9\pm 0.2 4.2±0.7plus-or-minus4.20.7-4.2\pm 0.7 0.91±0.03plus-or-minus0.910.03-0.91\pm 0.03
late late field
α𝛼\alpha 0.40±0.08plus-or-minus0.400.080.40\pm 0.08 0.30±0.01plus-or-minus0.300.010.30\pm 0.01
b𝑏b 2.8±0.6plus-or-minus2.80.6-2.8\pm 0.6 1.88±0.08plus-or-minus1.880.08-1.88\pm 0.08
Table 2: Parameter of the fits log(r50)=0.4αMr+bsubscript𝑟500.4𝛼subscript𝑀𝑟𝑏\log(r_{50})=-0.4\alpha M_{r}+b, see figure 6.

3.2 Dynamical relations

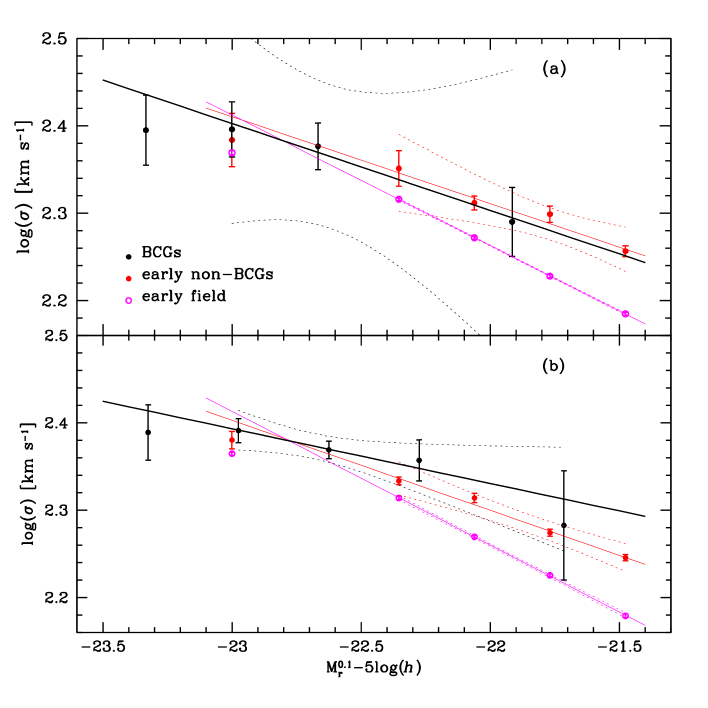
It is known that velocity dispersion and luminosity are well correlated for early-type galaxies (Lσβproportional-to𝐿superscript𝜎𝛽L\propto\sigma^{\beta}), a relation known as Faber-Jackson (Faber & Jackson 1976). Figure 7 shows the median values of logσ𝜎\log{\sigma} as function of Mr0.1subscriptsuperscript𝑀0.1𝑟M^{0.1}_{r} for early-type galaxies in clusters (red lines), control sample (magenta lines) and BCGs𝐵𝐶subscript𝐺𝑠BCG_{s} (black lines). Table 3 gives the parameters of the fits, where we can appreciate that there are no differences between fits corresponding to both cluster samples. Where we do see a clear difference is between galaxies in clusters (both BCGs𝐵𝐶subscript𝐺𝑠BCG_{s} and non-BCGs𝐵𝐶subscript𝐺𝑠BCG_{s}) and field galaxies, the latter being dynamically cooler (show lower mean velocity dispersions). The logσ𝜎\log{\sigma}-Mr0.1subscriptsuperscript𝑀0.1𝑟M^{0.1}_{r} also presents a departure from linearity for the brightest bin, where bright early type galaxies show a lower velocity dispersion than that expected from the linear relation that fits the lower magnitude bins. BCGs𝐵𝐶subscript𝐺𝑠BCG_{s} show a logσ𝜎\log{\sigma}-Mr0.1subscriptsuperscript𝑀0.1𝑟M^{0.1}_{r} relation flatter than that of non-BCG galaxies. Nevertheless, the mean velocity dispersion that corresponds to the brightest luminosity bin of non-BCG galaxies is consistent with the values expected for BCGs𝐵𝐶subscript𝐺𝑠BCG_{s}. Therefore, the flattening of the logσ𝜎\log{\sigma}-Mr0.1subscriptsuperscript𝑀0.1𝑟M^{0.1}_{r} relation observed for BCGs𝐵𝐶subscript𝐺𝑠BCG_{s} (see also Bernardi et al. (2007)) could be a general property of early type galaxies regardless of its nature as the brightest cluster galaxy. Liu et al. (2007) and von der Linden et al. (2007) found that BCGs have a Faber-Jackson relation steeper than that of early-type galaxies. On the contrary, Bernardi et al. (2007) found a shallower relation for BCGs, consistent with our findings.

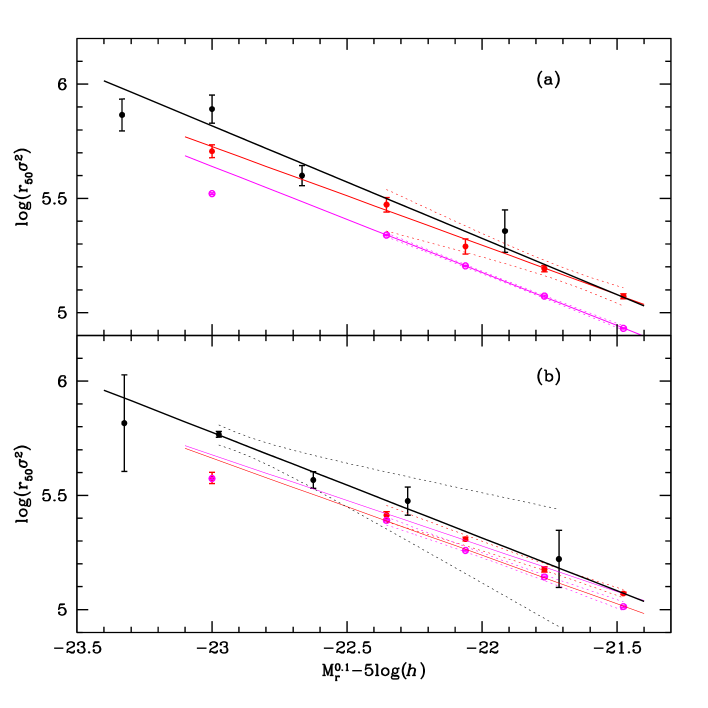
In Figure 7 we found that early-type and BCGs𝐵𝐶subscript𝐺𝑠BCG_{s} galaxies have, on average, the same velocity dispersions at a given luminosity. We also found that BCGs𝐵𝐶subscript𝐺𝑠BCG_{s} have larger sizes than early type galaxies. Therefore, a different trend of dynamical masses as a function of luminosity between these two types of galaxies should be expected. In Figure 8 we show the median value of log(r50σ2)subscript𝑟50superscript𝜎2\log(r_{50}\sigma^{2}) as a function of the luminosity for early-types, BGGs𝐵𝐺subscript𝐺𝑠BGG_{s} and control-sample galaxies. Again, the brightest bins show a departure from linearity and were excluded from the linear fits. For the three samples we plot a linear regression that confirm that BCGs𝐵𝐶subscript𝐺𝑠BCG_{s} have, on average, higher dynamical masses than early-type galaxies of the same magnitude (the fitting parameters are given in Table 4). It should be noted that these differences are more significant for MaxBCG clusters (C-K07-I) than for X-ray clusters (C-P04-I). Field galaxies in control samples show lower dynamical masses than non-BCGs in clusters.

Refer to caption
Figure 7: Faber-Jackson Relation: Linear fits of log(σ)𝜎\log(\sigma) versus Mr0.1superscriptsubscript𝑀𝑟0.1M_{r}^{0.1} for nonBCGs𝑛𝑜𝑛𝐵𝐶subscript𝐺𝑠non-BCG_{s} early-types (red lines), BCGs𝐵𝐶subscript𝐺𝑠BCG_{s} (black lines) and control samples (magenta lines). The panels correspond to the same cases as in Figure 6.
Refer to caption
Figure 8: Correlation between dynamical mass r50σ2subscript𝑟50superscript𝜎2r_{50\sigma^{2}} and luminosity for early-types (red lines), BCGs𝐵𝐶subscript𝐺𝑠BCG_{s} (black lines) and control samples (magenta lines), as in Figure 7.
early non-BCGs BCGs early field
C-P04-I F-P04-E
β𝛽\beta 4.0±0.8plus-or-minus4.00.84.0\pm 0.8 4±2plus-or-minus424\pm 2 2.67±0.05plus-or-minus2.670.052.67\pm 0.05
b𝑏b 0.1±0.3plus-or-minus0.10.3-0.1\pm 0.3 0±1plus-or-minus010\pm 1 1.03±0.06plus-or-minus1.030.06-1.03\pm 0.06
C-K07-I F-K07-E
β𝛽\beta 3.9±0.2plus-or-minus3.90.23.9\pm 0.2 7±3plus-or-minus737\pm 3 2.61±0.05plus-or-minus2.610.052.61\pm 0.05
b𝑏b 0.0±0.1plus-or-minus0.00.10.0\pm 0.1 1.0±0.7plus-or-minus1.00.71.0\pm 0.7 1.11±0.06plus-or-minus1.110.06-1.11\pm 0.06
Table 3: Parameters of the fits log(σ)=0.4βMr+b𝜎0.4𝛽subscript𝑀𝑟𝑏\log(\sigma)=-\frac{0.4}{\beta}M_{r}+b, see figure 7.
early non-BCGs BCGs early field
C-P04-I F-P04-E
a𝑎a 0.43±0.03plus-or-minus0.430.03-0.43\pm 0.03 0.5±0.1plus-or-minus0.50.1-0.5\pm 0.1 0.464±0.005plus-or-minus0.4640.005-0.464\pm 0.005
b𝑏b 4.2±0.7plus-or-minus4.20.7-4.2\pm 0.7 6±2plus-or-minus62-6\pm 2 5.0±0.1plus-or-minus5.00.1-5.0\pm 0.1
C-K07-I F-K07-E
a𝑎a 0.40±0.01plus-or-minus0.400.01-0.40\pm 0.01 0.46±0.05plus-or-minus0.460.05-0.46\pm 0.05 0.425±0.005plus-or-minus0.4250.005-0.425\pm 0.005
b𝑏b 3.5±0.3plus-or-minus3.50.3-3.5\pm 0.3 5±1plus-or-minus51-5\pm 1 4.1±0.1plus-or-minus4.10.1-4.1\pm 0.1
Table 4: Parameters of the fits log(r50σ2)=aMr+bsubscript𝑟50superscript𝜎2𝑎subscript𝑀𝑟𝑏\log(r_{50}\sigma^{2})=aM_{r}+b, see figure 8.

4 Galaxy segregation

Using the C-P04-I and C-K07-I samples, Martínez et al. (2008) found that galaxy properties show a clear dependence on the clustocentric distance: a higher fraction of early type galaxies are found in the inner regions of clusters. In addition, they found that the gr𝑔𝑟g-r colour is the property most predictive of the clustocentric distance of galaxies. Skibba et al. (2008) used SDSS galaxies with data from the Galaxy Zoo (Bamford et al. 2008) and found that for fixed morphology, the environmental dependence of colour remains strong. Blanton & Berlind (2007) found that the relation between galaxy colors and the distance from the centre of groups has a residual relationship on the clustering of galaxies at small scales (<300h1absent300superscript1<300h^{-1} Kpc). In this work we are interested in the study of the segregation of several properties of bright galaxies in clusters as a function of r/r200𝑟subscript𝑟200r/r_{200} and its dependence on the cluster identification techniques. Coenda et al. (2006) found that these type of analysis can produce different results depending on whether redshift-confirmed members or galaxies in projection are considered. Although we are only considering bright galaxies, our analysis is based on confirmed members in volume limited galaxy samples identified with two different criteria and galaxies extracted from the same galaxy catalogue. The characteristics of these samples make them suitable for an unbiased analysis of the properties of galaxies and its dependence on the cluster environment.

As we explained in section 2.2, we have adopted several criteria to classify galaxies into morphological classes or types. We have used in our analysis the following parameters: the gr𝑔𝑟g-r colour, the concentration index C𝐶C, the eclass𝑒𝑐𝑙𝑎𝑠𝑠eclass parameter and the Sersic index n𝑛n. Although they are not independent, they are dominated by different physical properties of galaxies.

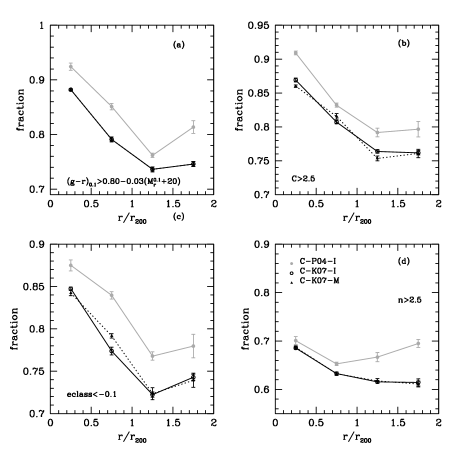
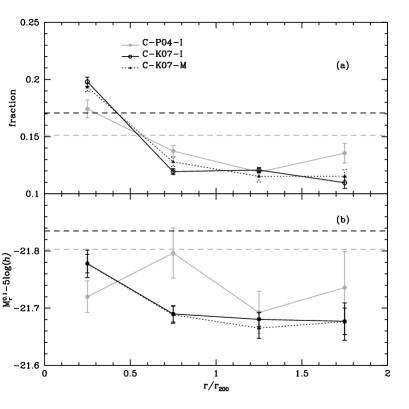
Figure 9 shows the fraction of early type galaxies as a function of the clustocentric radius. For both cluster samples a clear dependence of r/r200𝑟subscript𝑟200r/r_{200} with gr𝑔𝑟g-r, C𝐶C and eclass𝑒𝑐𝑙𝑎𝑠𝑠eclass is found (panels a) to c)). The correlation is up to r/r2001similar-to𝑟subscript𝑟2001r/r_{200}\sim 1, for larger clustocentric distances we do not see any tendency. For the Sersic index n𝑛n (panel d)) we only observe a dependence for the C-K07-I sample. The comparison between the two cluster samples shows that the X-ray selected clusters always present a higher fraction of early type galaxies in the whole range of clustocentric distances. As it was pointed out previously, the X-ray sample has a slightly higher fraction of massive clusters than the MaxBCG sample. In order to test if this difference in the mass distributions can be responsible for the higher fraction of early type galaxies in C-P04-I than in C-K07-I sample, we constructed a new sub-sample (C-K07-M) that consists of galaxies selected at random from C-K07-I having the same parent-cluster mass distribution as C-P04-I. As can be appreciated in figure 9, the fractions of early type galaxies as a function of r/r200𝑟subscript𝑟200r/r_{200} for C-K07-M (dotted lines) are indistinguishable from those corresponding to the C-K07-I sample, indicating that our finding of a higher fraction of early type galaxies in X-ray than in MaxBCG clusters is independent of the dynamical mass distribution.

Refer to caption
Figure 9: Fraction of early type galaxies as a function of the normalized clustocentric radius. Early type galaxies are selected according to several parameters: (gr)0.1superscript𝑔𝑟0.1(g-r)^{0.1} in panel (a), C𝐶C in panel (b), eclass𝑒𝑐𝑙𝑎𝑠𝑠eclass in panel (c) and n𝑛n in panel (d). The solid grey lines show the C-P04-I sample, whereas the solid black lines show the C-K07-I sample. The dotted black lines show the C-K07-M sample.

In panel (a) of figure 10 we show the fraction of galaxies brighter than Mr0.122.5superscriptsubscript𝑀𝑟0.122.5M_{r}^{0.1}\leq-22.5 as a function of the normalized clustocentric distance. Analogously to the morphological segregation, we can see a clear dependence of this fraction for r/r2001less-than-or-similar-to𝑟subscript𝑟2001r/r_{200}\lesssim 1, in the sense that galaxies brighter Mr0.122.5superscriptsubscript𝑀𝑟0.122.5M_{r}^{0.1}\leq-22.5 preferentially inhabit the cluster centres. This trend is stronger for the C-K07-I sample. Alternatively, in panel (b) we show the median values of Mr0.1superscriptsubscript𝑀𝑟0.1M_{r}^{0.1} as a function r/r200𝑟subscript𝑟200r/r_{200}. We observe the dependence between the median Mr0.1superscriptsubscript𝑀𝑟0.1M_{r}^{0.1} and r/r200𝑟subscript𝑟200r/r_{200} for the C-K07-I sample. This effect is not observed for C-P04-I sample. The dispersion observed in mean values of Mr0.1superscriptsubscript𝑀𝑟0.1M_{r}^{0.1} (especially for C-P04-I sample) is due to the natural spread of the luminosity function.

Refer to caption
Figure 10: Panel (a): Fraction of galaxies brighter than Mr0.122.5superscriptsubscript𝑀𝑟0.122.5M_{r}^{0.1}\leq-22.5 as a function of r/r200𝑟subscript𝑟200r/r_{200}. The grey line shows the C-P04-I sample while the black line corresponds to the C-K07-I sample. The horizontal dashed lines show the median values of the corresponding field samples in the same colors as their cluster counterparts. Panel (b): Median values of Mr0.1superscriptsubscript𝑀𝑟0.1M_{r}^{0.1} versus r/r200𝑟subscript𝑟200r/r_{200}. The horizontal lines show the median values of the corresponding field samples.
Refer to caption
Figure 11: Panel (a) shows the median values of r50subscript𝑟50r_{50} versus r/r200𝑟subscript𝑟200r/r_{200} and panel(b) the median values of μ50subscript𝜇50\mu_{50} versus r/r200𝑟subscript𝑟200r/r_{200}. The horizontal lines show the median values of the corresponding field samples, as in Figure 10.
Refer to caption
Figure 12: Median values of r50subscript𝑟50r_{50} as a function of r/r200𝑟subscript𝑟200r/r_{200} for early-type galaxies. In the left panels we show this relation for the C-P04-I sample while C-K07-I clusters are shown on the right panels. Early type galaxies were selected according to several parameters: (gr)0.1superscript𝑔𝑟0.1(g-r)^{0.1} in (a) and (b), C𝐶C in (c) and (d), and eclass𝑒𝑐𝑙𝑎𝑠𝑠eclass in (e) and (f). Dotted lines show the same relation but excluding the BCGs𝐵𝐶subscript𝐺𝑠BCG_{s}.
Refer to caption
Figure 13: Median values of r50subscript𝑟50r_{50} as a function of r/r200𝑟subscript𝑟200r/r_{200} for late-type galaxies, analogously to figure 12.

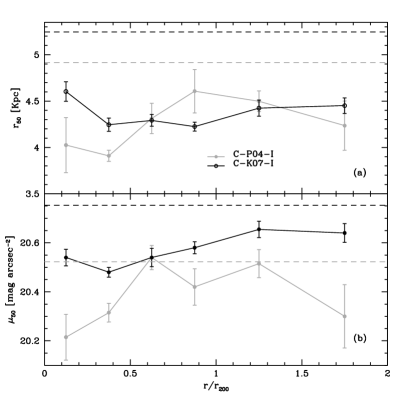
As discussed in section 3.1, the study of galaxy sizes and their relation to the luminosity helps to understand the galaxy formation and evolution. Here we study a possible dependence of galaxy size, r50subscript𝑟50r_{50}, as a function of r/r200𝑟subscript𝑟200r/r_{200}. Panel (a) in Figure 11 shows the median value of r50subscript𝑟50r_{50} versus the normalized clustocentric distance, for the C-P04-I sample (grey line) and for the C-K07-I sample (black line). For clustocentric distances larger than 0.80.80.8, mean sizes of galaxies remain almost constant, being slightly larger for galaxies in X-ray clusters than in the MaxBCG sample, although the same effect is observed for field galaxies (horizontal dashed lines in figure 11). For smaller clustocentric distances, median sizes show different behaviour: for galaxies in the C-P04-I sample, median values of r50subscript𝑟50r_{50} decrease as r/r200𝑟subscript𝑟200r/r_{200} goes to zero, whereas the opposite behaviour is observed for galaxies in the C-K07-I sample. Panel (b) in Figure 11 shows the median value of the rlimit-from𝑟r-band surface brightness μ50subscript𝜇50\mu_{50}, computed inside r50subscript𝑟50r_{50}, as a function of r/r200𝑟subscript𝑟200r/r_{200}. For both cluster samples, μ50subscript𝜇50\mu_{50} decreases as r/r200𝑟subscript𝑟200r/r_{200} goes to zero. Field galaxies have lower surface brightness (black horizontal line) than cluster members.

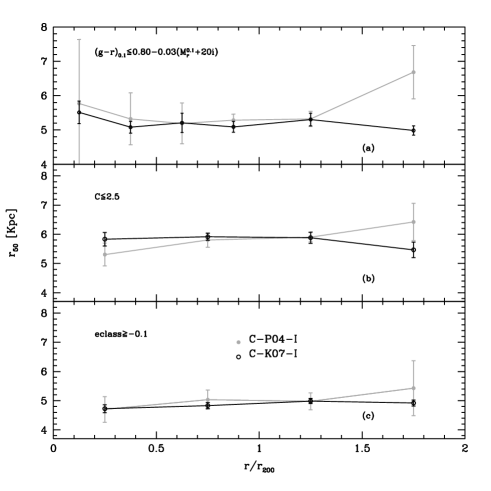
Figure 12 repeats the previous analysis using only early type galaxies. In the left panels we show this relation for the C-P04-I sample while C-K07-I sample are shown in the right panels. We have also evaluated the influence of BCGs𝐵𝐶subscript𝐺𝑠BCG_{s} in our results, repeating the analysis without BCGs𝐵𝐶subscript𝐺𝑠BCG_{s} (dotted lines). Analogously to Figure 11, the sizes of early type galaxies increase when r/r200𝑟subscript𝑟200r/r_{200} decreases in the C-K07-I sample. Nevertheless, this tendency disappears when BCGs𝐵𝐶subscript𝐺𝑠BCG_{s} are excluded. On the other hand, the median values of r50subscript𝑟50r_{50} decrease as r/r200𝑟subscript𝑟200r/r_{200} goes to zero for the C-P04-I sample; this effect is stronger when BCGs𝐵𝐶subscript𝐺𝑠BCG_{s} are excluded. These results clearly show an important difference between clusters identified with different criteria. As can be appreciated in figure 3, a higher fraction of early type galaxies is observed for the X-ray selected clusters. Consequently, the different behaviour observed in Figure 12, could be the result of the differences in the population of early type galaxies between the two samples. For instance, a higher fraction of elliptical galaxies in the early type population of the X-ray selected clusters with respect to the MaxBCG sample could produce a different behaviour in the mean sizes as a function of r/r200𝑟subscript𝑟200r/r_{200}. In order to test this possibility, we repeated the analysis of Figure 12 selecting early type galaxies with c>3.1𝑐3.1c>3.1. This new threshold includes a third of the early type galaxies previously analyzed, and it will mostly select elliptical galaxies. For this sub-sample of early type galaxies, we find the same trend observed in Figure 12, confirming that there is a dependence of the mean sizes of early type galaxies on the cluster selection criterion. Based on a sample of 228 elliptical galaxies in 24 clusters, Cypriano et al. (2006) found that elliptical galaxies in the inner regions of clusters are typically 5% smaller than those in the outer regions. These authors interpreted these results in terms of the tidal stripping of stars that lead to changes in the whole structure of galaxies in the central regions of clusters.

Figure 13 is the analogous of Figure 12 for late-type galaxies. Although galaxies in X-ray selected clusters show a tendency on average r50subscript𝑟50r_{50} to be smaller towards the cluster centers, this behaviour is not statistically significant.

5 Discussion and conclusions

We have compiled two catalogues of massive clusters of galaxies based on samples that make use of different identification techniques: the P04 sample that comprises bright X-ray galaxy clusters and the K07 sample, constructed according to the properties of early-type galaxies. We selected sub-samples of galaxy clusters in the redshift range 0.05<z<0.140.05𝑧0.140.05<z<0.14. For both samples, member galaxies are brighter that Mr0.1=21.3superscriptsubscript𝑀𝑟0.121.3M_{r}^{0.1}=-21.3 and were identified from a spectroscopic volume-limited sample of the DR5-SDSS. In order to select a fair sample of clusters of galaxies we use the fof algorithm and an eyeball examination of each overdensity identified by fof. Throughout the visual inspection, we classified the clusters based on their substructure. We only consider in our analysis regular clusters and we exclude systems that have two or more close substructures of similar size in the plane of the sky and/or in the redshift distribution. In addition, we have determined new positions in the plane of the sky and in the line of sight. We found that for 40%similar-toabsentpercent40\sim 40\% of the clusters, the angular position given by fof is better than the original value, whereas for 17%similar-toabsentpercent17\sim 17\% of the clusters, the redshift given by fof is a better match to the observed mean redshift distribution than the original value. Our final sample comprises 494949 X-ray selected clusters with 786 galaxies and 209209209 MaxBCG clusters with 3041 galaxies. We have determined the following physical properties of clusters: the line-of-sight velocity dispersion σ𝜎\sigma, the virial radius and mass and r200subscript𝑟200r_{200}.

We have analyzed different scaling relations between photometric and dynamical parameters. Bright galaxies were separated in early and late types according to several criteria. We have also studed the segregation of galaxies analysing different properties as a function of the normalized clustocentric distances. The main results are:

  • Galaxies in X-ray and MaxBCG selected clusters show similar size-luminosity relations.

  • We found that each galaxy type has a different luminosity-size relation. This implies a different mass-luminosity relation and/or a different star formation history.

  • For each luminosity bin, late type galaxies in the field have sizes smaller than their cluster counterpart.

  • The same effect is observed for early type galaxies, although the differences are smaller. The stronger effect corresponds to galaxies in MaxBCG clusters.

  • At fixed luminosity, BCGs𝐵𝐶subscript𝐺𝑠BCG_{s} tend to be larger and show a steeper log(r50)subscript𝑟50\log(r_{50}) - Mr0.1superscriptsubscript𝑀𝑟0.1M_{r}^{0.1} relation than non-BCG early type galaxies in clusters.

  • Non-BCGs early type galaxies in clusters and in the field show the known curvature in the size-luminosity relation.

  • The Faber-Jackson relation for early-type galaxies in clusters is the same in X-ray and MaxBCG clusters.

  • We found a clear difference between galaxies in clusters (both BCGs𝐵𝐶subscript𝐺𝑠BCG_{s} and non-BCG) and in the field, showing the later lower values of the velocity dispersion at fixed luminosity.

  • The logσ𝜎\log{\sigma}-Mr0.1subscriptsuperscript𝑀0.1𝑟M^{0.1}_{r} relation presents, at the bright end, a departure from linearity. Bright early type galaxies show a lower velocity dispersion than the expected from the linear relation at lower magnitudes.

  • BCGs𝐵𝐶subscript𝐺𝑠BCG_{s} show a flatter logσ𝜎\log{\sigma}-Mr0.1subscriptsuperscript𝑀0.1𝑟M^{0.1}_{r} relation than non-BCG galaxies. Nevertheless, the velocity dispersion of the brightest non-BCG galaxies are consistent with the values expected for BCGs𝐵𝐶subscript𝐺𝑠BCG_{s}.

  • At fixed luminosity, BCGs𝐵𝐶subscript𝐺𝑠BCG_{s} have, on average, higher dynamical masses than early-type galaxies in clusters. The difference is more significant for MaxBCG clusters than for X-ray selected clusters.

  • At fixed luminosity, field early type galaxies in the control samples show lower dynamical masses than non-BCG early type galaxies in clusters.

  • Using several criteria to classify galaxies into morphological classes, we found the well know morphological segregation for both samples of clusters. The correlation is up to r/r2001similar-to𝑟subscript𝑟2001r/r_{200}\sim 1; for larger clustocentric distances we do not see any trend.

  • For the whole range of clustocentric distances, X-ray selected clusters have a higher fraction of early type galaxies than MaxBCG clusters.

  • Within r/r2001similar-to𝑟subscript𝑟2001r/r_{200}\sim 1 we found a dependence of the fraction of galaxies brighter than Mr0.122.5superscriptsubscript𝑀𝑟0.122.5M_{r}^{0.1}\leq-22.5 as a function of the normalized clustocentric distance. Bright galaxies preferentially inhabit the cluster centers. This tendency is stronger for MaxBCG clusters.

  • For clustocentric distances larger than 0.80.80.8, mean sizes of galaxies remain almost constant, being slightly larger for galaxies in X-ray selected clusters than in the MaxBCG sample.

  • For r/r2000.8𝑟subscript𝑟2000.8r/r_{200}\leq 0.8, median sizes depend on the cluster sample. For galaxies in X-ray selected clusters, median values of r50subscript𝑟50r_{50} decrease as r/r200𝑟subscript𝑟200r/r_{200} goes to zero, whereas the opposite is observed for galaxies in the MaxBCG clusters.

  • For MaxBCG clusters, the sizes of early type galaxies increase as r/r200𝑟subscript𝑟200r/r_{200} decreases. The trend disappears when BCGs𝐵𝐶subscript𝐺𝑠BCG_{s} are excluded. On the contrary, the median value of r50subscript𝑟50r_{50} decrease as r/r200𝑟subscript𝑟200r/r_{200} goes to zero for X-ray selected clusters. The effect is stronger when BCGs𝐵𝐶subscript𝐺𝑠BCG_{s} are excluded.

Early type galaxies in the field are lower, have lower velocity dispersion and have smaller virial masses than their cluster counterpart. On the other hand, BCGs𝐵𝐶subscript𝐺𝑠BCG_{s} are larger and have higher values of the virial masses than non-BCG in clusters, although the velocity dispersions are comparable. These differences in the properties of early type galaxies in the field, in clusters and with BCGs𝐵𝐶subscript𝐺𝑠BCG_{s} are consistent with the scenario where the environment plays a fundamental rol in the formation histories of galaxies. These results suggest three different formation scenarios, BCGs𝐵𝐶subscript𝐺𝑠BCG_{s} being the galaxies less affected by dissipation. Dry mergers have no energy loss mechanism, therefore the formed galaxies are less centrally contracted with optical sizes larger than those of galaxies that have undergone a dissipative merger (Kormendy 1989, Nipoti et al. 2003, Bernardi et al. 2007). Weinmann et al. (2009) and Guo et al. (2009) analyzed the size-luminosity relation of galaxies in groups, where the environmental effects are supposed to be different to those expected in clusters. These authors found the same size-luminosity relation for both central and satellite early type galaxies. The different results between galaxies in groups and clusters also support the idea that the size-luminosity relation depends on the environment.

At the same luminosity, late-type galaxies in clusters have larger sizes, and therefore lower surface brightness than their field counterparts (control sample). This is in agreement with the scenario of strangulation (Larson et al. 1980), where the gas in the halo is stripped, suppressing the supply of cold gas and therefore affecting the star formation rate and the galaxy luminosity.

The X-ray selected sample C-P04-I is made of bright X-ray galaxy clusters, whereas the C-K07-I sample was constructed according to the properties of early-type galaxies. Several clusters in the C-K07-I sample should be X-ray emitters, although they would be, on average, less X-ray luminous than C-P04-I clusters. The fact that X-ray selected clusters show a higher fraction of early type galaxies whose sizes tend to decrease towards the cluster center, effect that is not observed for galaxies in MaxBCG clusters, can be interpreted as possible evidence that the hot intracluster medium is also playing a role in the evolution of early type galaxies. Alternatively, the observed effect could be caused by differences in the clusters masses. Even though the effects mentioned above are also present for sub-samples of C-P04-I and C-K07-I with the same virial mass distribution, due to the usual uncertainties in the computation of these masses, we cannot discard differences in the actual mass distributions. If this is the case, and C-P04-I clusters are on average more massive than C-K07-I, decreases in the mean sizes of early type galaxies in X-ray selected clusters could be the result of tidal stripping that can produce changes in the structure of galaxies (see the results from numerical simulations of Aguilar & White (1986) and observational evidences from Trujillo et al. (2002) and Cypriano et al. (2006)). This difference between X-ray and MaxBCG selected clusters is an unexpected result that should be explored in more detail.

Acknowledgements.
This work has been partially supported with grants from Consejo Nacional de Investigaciones Científicas y Técnicas de la República Argentina (CONICET) and Secretaría de Ciencia y Tecnología de la Universidad de Córdoba. We kindly thank Dr. Héctor J. Martínez for his helpful comments on the manuscript, which contributed to improve the present paper. VC acknowledges the guidance of Dr. Ariel Zandivarez in the construction of the cluster sample.

References

  • Adelman-McCarthy et al. (2008) Adelman-McCarthy, J. K., Agüeros, M. A., Allam, S. S., et al. 2008, ApJS, 175, 297
  • Adelman-McCarthy et al. (2007) Adelman-McCarthy, J. K., Agüeros, M. A., Allam, S. S., et al. 2007, ApJS, 172, 634
  • Aguilar & White (1986) Aguilar, L. A. & White, S. D. M. 1986, ApJ, 307, 97
  • Andredakis et al. (1995) Andredakis, Y. C., Peletier, R. F., & Balcells, M. 1995, MNRAS, 275, 874
  • Bahcall (1973) Bahcall, N. A. 1973, ApJ, 183, 783
  • Ball et al. (2008) Ball, N. M., Loveday, J., & Brunner, R. J. 2008, MNRAS, 383, 907
  • Bamford et al. (2008) Bamford, S. P., Rojas, A. L., Nichol, R. C., et al. 2008, MNRAS, 391, 607
  • Beers et al. (1990) Beers, T. C., Flynn, K., & Gebhardt, K. 1990, AJ, 100, 32
  • Bernardi (2009) Bernardi, M. 2009, MNRAS, 510
  • Bernardi et al. (2007) Bernardi, M., Hyde, J. B., Sheth, R. K., Miller, C. J., & Nichol, R. C. 2007, AJ, 133, 1741
  • Bernardi et al. (2003) Bernardi, M., Sheth, R. K., Annis, J., et al. 2003, AJ, 125, 1866
  • Bernardi et al. (2005) Bernardi, M., Sheth, R. K., Nichol, R. C., Schneider, D. P., & Brinkmann, J. 2005, AJ, 129, 61
  • Bildfell et al. (2008) Bildfell, C., Hoekstra, H., Babul, A., & Mahdavi, A. 2008, MNRAS, 934
  • Biviano et al. (2002) Biviano, A., Katgert, P., Thomas, T., & Adami, C. 2002, A&A, 387, 8
  • Blanton & Berlind (2007) Blanton, M. R. & Berlind, A. A. 2007, ApJ, 664, 791
  • Blanton et al. (2003) Blanton, M. R., Brinkmann, J., Csabai, I., et al. 2003, AJ, 125, 2348
  • Blanton et al. (2005a) Blanton, M. R., Eisenstein, D., Hogg, D. W., Schlegel, D. J., & Brinkmann, J. 2005a, ApJ, 629, 143
  • Blanton et al. (2005b) Blanton, M. R., Schlegel, D. J., Strauss, M. A., et al. 2005b, AJ, 129, 2562
  • Carlberg et al. (1997) Carlberg, R. G., Yee, H. K. C., & Ellingson, E. 1997, ApJ, 478, 462
  • Coenda et al. (2005) Coenda, V., Donzelli, C. J., Muriel, H., et al. 2005, AJ, 129, 1237
  • Coenda et al. (2006) Coenda, V., Muriel, H., Donzelli, C. J., et al. 2006, AJ, 131, 1989
  • Cross et al. (2004) Cross, N. J. G., Bouwens, R. J., Benítez, N., et al. 2004, AJ, 128, 1990
  • Cypriano et al. (2006) Cypriano, E. S., Sodré, L. J., Campusano, L. E., Dale, D. A., & Hardy, E. 2006, AJ, 131, 2417
  • de Jong & Lacey (2000) de Jong, R. S. & Lacey, C. 2000, ApJ, 545, 781
  • Díaz et al. (2005) Díaz, E., Zandivarez, A., Merchán, M. E., & Muriel, H. 2005, ApJ, 629, 158
  • Djorgovski & Davis (1987) Djorgovski, S. & Davis, M. 1987, ApJ, 313, 59
  • Domínguez et al. (2001) Domínguez, M., Muriel, H., & Lambas, D. G. 2001, AJ, 121, 1266
  • Dressler (1980) Dressler, A. 1980, ApJS, 42, 565
  • Dressler et al. (1987) Dressler, A., Lynden-Bell, D., Burstein, D., et al. 1987, ApJ, 313, 42
  • Dressler et al. (1997) Dressler, A., Oemler, A. J., Couch, W. J., et al. 1997, ApJ, 490, 577
  • Driver et al. (2006) Driver, S. P., Allen, P. D., Graham, A. W., et al. 2006, MNRAS, 368, 414
  • Driver et al. (2003) Driver, S. P., Odewahn, S. C., Echevarria, L., et al. 2003, AJ, 126, 2662
  • Faber & Jackson (1976) Faber, S. M. & Jackson, R. E. 1976, ApJ, 204, 668
  • Ferguson et al. (2004) Ferguson, H. C., Dickinson, M., Giavalisco, M., et al. 2004, ApJL, 600, L107
  • Folkes et al. (1999) Folkes, S., Ronen, S., Price, I., et al. 1999, MNRAS, 308, 459
  • Girardi et al. (1993) Girardi, M., Biviano, A., Giuricin, G., Mardirossian, F., & Mezzetti, M. 1993, ApJ, 404, 38
  • Goto et al. (2002) Goto, T., Sekiguchi, M., Nichol, R. C., et al. 2002, AJ, 123, 1807
  • Guo et al. (2009) Guo, Y., McIntosh, D. H., Mo, H. J., et al. 2009, ArXiv e-prints
  • Huchra & Geller (1982) Huchra, J. P. & Geller, M. J. 1982, ApJ, 257, 423
  • Hyde & Bernardi (2009) Hyde, J. B. & Bernardi, M. 2009, MNRAS, 349
  • Kashikawa et al. (1998) Kashikawa, N., Sekiguchi, M., Doi, M., et al. 1998, ApJ, 500, 750
  • Koester et al. (2007a) Koester, B. P., McKay, T. A., Annis, J., et al. 2007a, ApJ, 660, 239
  • Koester et al. (2007b) Koester, B. P., McKay, T. A., Annis, J., et al. 2007b, ApJ, 660, 221
  • Kormendy (1977) Kormendy, J. 1977, ApJ, 218, 333
  • Kormendy (1989) Kormendy, J. 1989, ApJL, 342, L63
  • La Barbera et al. (2004) La Barbera, F., Merluzzi, P., Busarello, G., Massarotti, M., & Mercurio, A. 2004, A&A, 425, 797
  • Larson et al. (1980) Larson, R. B., Tinsley, B. M., & Caldwell, C. N. 1980, ApJ, 237, 692
  • Lauer et al. (2007) Lauer, T. R., Faber, S. M., Richstone, D., et al. 2007, ApJ, 662, 808
  • Liu et al. (2007) Liu, F. S., Xia, X. Y., Mao, S., Wu, H., & Deng, Z. G. 2007, ArXiv e-prints, 712
  • Lobo et al. (1997) Lobo, C., Biviano, A., Durret, F., et al. 1997, A&A, 317, 385
  • Loveday et al. (1992) Loveday, J., Peterson, B. A., Efstathiou, G., & Maddox, S. J. 1992, ApJ, 390, 338
  • Madgwick et al. (2002) Madgwick, D. S., Lahav, O., Baldry, I. K., et al. 2002, MNRAS, 333, 133
  • Malumuth & Kirshner (1981) Malumuth, E. M. & Kirshner, R. P. 1981, ApJ, 251, 508
  • Malumuth & Kirshner (1985) Malumuth, E. M. & Kirshner, R. P. 1985, ApJ, 291, 8
  • Martínez et al. (2008) Martínez, H. J., Coenda, V., & Muriel, H. 2008, ArXiv e-prints, 0809.1585
  • McIntosh et al. (2005) McIntosh, D. H., Bell, E. F., Rix, H.-W., et al. 2005, ApJ, 632, 191
  • Melnick & Sargent (1977) Melnick, J. & Sargent, W. L. W. 1977, ApJ, 215, 401
  • Merchán & Zandivarez (2005) Merchán, M. E. & Zandivarez, A. 2005, ApJ, 630, 759
  • Miller et al. (2005) Miller, C. J., Nichol, R. C., Reichart, D., et al. 2005, AJ, 130, 968
  • Möllenhoff & Heidt (2001) Möllenhoff, C. & Heidt, J. 2001, A&A, 368, 16
  • Nipoti et al. (2003) Nipoti, C., Londrillo, P., & Ciotti, L. 2003, MNRAS, 342, 501
  • Noonan (1961) Noonan, T. 1961, PASP, 73, 212
  • Oegerle & Hoessel (1991) Oegerle, W. R. & Hoessel, J. G. 1991, ApJ, 375, 15
  • Oemler (1974) Oemler, A. J. 1974, ApJ, 194, 1
  • Peng et al. (2002) Peng, C. Y., Ho, L. C., Impey, C. D., & Rix, H.-W. 2002, AJ, 124, 266
  • Petrosian (1976) Petrosian, V. 1976, ApJL, 209, L1
  • Popesso et al. (2004) Popesso, P., Böhringer, H., Brinkmann, J., Voges, W., & York, D. G. 2004, A&A, 423, 449
  • Pracy et al. (2005) Pracy, M. B., Driver, S. P., De Propris, R., Couch, W. J., & Nulsen, P. E. J. 2005, MNRAS, 364, 1147
  • Rood & Turnrose (1968) Rood, H. J. & Turnrose, B. E. 1968, ApJ, 152, 1057
  • Sandage & Perelmuter (1990) Sandage, A. & Perelmuter, J.-M. 1990, ApJ, 361, 1
  • Sandage & Visvanathan (1978a) Sandage, A. & Visvanathan, N. 1978a, ApJ, 225, 742
  • Sandage & Visvanathan (1978b) Sandage, A. & Visvanathan, N. 1978b, ApJ, 223, 707
  • Schechter (1976) Schechter, P. 1976, ApJ, 203, 297
  • Schlegel et al. (1998) Schlegel, D. J., Finkbeiner, D. P., & Davis, M. 1998, ApJ, 500, 525
  • Sérsic (1963) Sérsic, J. L. 1963, Boletín de la Asociación Argentina de Astronomía, 6, 41
  • Sérsic (1968) Sérsic, J. L. 1968, Atlas de galaxias australes (Córdoba, Argentina: Observatorio Astronómico, 1968)
  • Shen et al. (2003) Shen, S., Mo, H. J., White, S. D. M., et al. 2003, MNRAS, 343, 978
  • Shimasaku et al. (2001) Shimasaku, K., Fukugita, M., Doi, M., et al. 2001, AJ, 122, 1238
  • Skibba et al. (2008) Skibba, R. A., Bamford, S. P., Nichol, R. C., et al. 2008, ArXiv e-prints
  • Strateva et al. (2001) Strateva, I., Ivezić, Ž., Knapp, G. R., et al. 2001, AJ, 122, 1861
  • Strauss et al. (2002) Strauss, M. A., Weinberg, D. H., Lupton, R. H., et al. 2002, AJ, 124, 1810
  • Syer et al. (1999) Syer, D., Mao, S., & Mo, H. J. 1999, MNRAS, 305, 357
  • Trujillo et al. (2002) Trujillo, I., Aguerri, J. A. L., Gutiérrez, C. M., Caon, N., & Cepa, J. 2002, ApJL, 573, L9
  • Trujillo et al. (2006) Trujillo, I., Förster Schreiber, N. M., Rudnick, G., et al. 2006, ApJ, 650, 18
  • Tully & Fisher (1977) Tully, R. B. & Fisher, J. R. 1977, A&A, 54, 661
  • von der Linden et al. (2007) von der Linden, A., Best, P. N., Kauffmann, G., & White, S. D. M. 2007, MNRAS, 379, 867
  • Weinmann et al. (2009) Weinmann, S. M., Kauffmann, G., van den Bosch, F. C., et al. 2009, MNRAS, 394, 1213
  • Whitmore et al. (1993) Whitmore, B. C., Gilmore, D. M., & Jones, C. 1993, ApJ, 407, 489
  • Yang et al. (2007) Yang, X., Mo, H. J., van den Bosch, F. C., et al. 2007, ApJ, 671, 153
  • Yepes et al. (1991) Yepes, G., Dominguez-Tenreiro, R., & del Pozo-Sanz, R. 1991, ApJ, 373, 336
  • Yip et al. (2004) Yip, C. W., Connolly, A. J., Szalay, A. S., et al. 2004, AJ, 128, 585
  • York et al. (2000) York, D. G., Anderson, Jr., J. E., Anderson, S. F., et al. 2000, AJ, 120, 1579
  • Ziegler et al. (1999) Ziegler, B. L., Saglia, R. P., Bender, R., et al. 1999, A&A, 346, 13

Appendix A Tables

Table 5: C-P04-I cluster sample.
α𝛼\alpha (J200020002000.000000) δ𝛿\delta (J200020002000.000000) z𝑧z σ𝜎\sigma Mvirsubscript𝑀𝑣𝑖𝑟M_{vir} Rvirsubscript𝑅𝑣𝑖𝑟R_{vir} R200subscript𝑅200R_{200}
[hms]delimited-[]𝑚𝑠[h\;m\;s] [°′′\degr\;^{\prime}\;{}^{\prime\prime}] [kms1[\rm{km\leavevmode\nobreak\ s^{-1}}] [h1Msuperscript1subscript𝑀direct-producth^{-1}M_{\odot}] [h1Mpcsuperscript1Mpch^{-1}{\rm{Mpc}}] [h1Mpcsuperscript1Mpch^{-1}{\rm{Mpc}}]
0  41  50.104150.10\,\,41\,\,50.1 9  18  6.89186.8-9\,\,18\,\,6.8 0.0560.0560.056 698.82698.82698.82 0.558x10150.558𝑥superscript10150.558x10^{15} 1.6381.6381.638 1.7291.7291.729
1  19  37.711937.71\,\,19\,\,37.7 +14  53  35.2145335.2+14\,\,53\,\,35.2 0.1290.1290.129 778.90778.90778.90 0.502x10150.502𝑥superscript10150.502x10^{15} 1.1851.1851.185 1.9271.9271.927
7  36  25.073625.07\,\,36\,\,25.0 +39  25  58.4392558.4+39\,\,25\,\,58.4 0.1170.1170.117 605.19605.19605.19 0.482x10150.482𝑥superscript10150.482x10^{15} 1.8871.8871.887 1.4971.4971.497
7  53  19.075319.07\,\,53\,\,19.0 +29  22  26.8292226.8+29\,\,22\,\,26.8 0.0610.0610.061 689.22689.22689.22 0.606x10150.606𝑥superscript10150.606x10^{15} 1.8291.8291.829 1.7051.7051.705
8  9  40.28940.28\,\,9\,\,40.2 +34  55  34.3345534.3+34\,\,55\,\,34.3 0.0820.0820.082 528.46528.46528.46 0.323x10150.323𝑥superscript10150.323x10^{15} 1.6561.6561.656 1.3081.3081.308
8  10  22.681022.68\,\,10\,\,22.6 +42  16  0.842160.8+42\,\,16\,\,0.8 0.0640.0640.064 548.75548.75548.75 0.292x10150.292𝑥superscript10150.292x10^{15} 1.3911.3911.391 1.3581.3581.358
8  22  10.082210.08\,\,22\,\,10.0 +47  5  58.247558.2+47\,\,5\,\,58.2 0.1300.1300.130 674.55674.55674.55 0.671x10150.671𝑥superscript10150.671x10^{15} 2.1142.1142.114 1.6691.6691.669
8  25  27.682527.68\,\,25\,\,27.6 +47  7  10.647710.6+47\,\,7\,\,10.6 0.1260.1260.126 792.06792.06792.06 0.952x10150.952𝑥superscript10150.952x10^{15} 2.1752.1752.175 1.9601.9601.960
8  28  6.78286.78\,\,28\,\,6.7 +44  45  48.2444548.2+44\,\,45\,\,48.2 0.1450.1450.145 577.57577.57577.57 0.187x10150.187𝑥superscript10150.187x10^{15} 0.8030.8030.803 1.4291.4291.429
8  45  29.084529.08\,\,45\,\,29.0 +44  34  28.2443428.2+44\,\,34\,\,28.2 0.0540.0540.054 331.69331.69331.69 0.545x10140.545𝑥superscript10140.545x10^{14} 0.7100.7100.710 0.8210.8210.821
9  13  9.29139.29\,\,13\,\,9.2 +47  43  26.4474326.4+47\,\,43\,\,26.4 0.0520.0520.052 408.98408.98408.98 0.120x10150.120𝑥superscript10150.120x10^{15} 1.0321.0321.032 1.0121.0121.012
9  53  41.595341.59\,\,53\,\,41.5 +1  42  42.514242.5+1\,\,42\,\,42.5 0.0980.0980.098 403.63403.63403.63 0.165x10150.165𝑥superscript10150.165x10^{15} 1.4541.4541.454 0.9990.9990.999
10  23  41.1102341.110\,\,23\,\,41.1 +49  8  5.64985.6+49\,\,8\,\,5.6 0.1440.1440.144 618.10618.10618.10 0.532x10150.532𝑥superscript10150.532x10^{15} 1.9971.9971.997 1.5291.5291.529
10  54  5.510545.510\,\,54\,\,5.5 +54  50  50.6545050.6+54\,\,50\,\,50.6 0.0720.0720.072 448.67448.67448.67 0.192x10150.192𝑥superscript10150.192x10^{15} 1.3681.3681.368 1.1101.1101.110
10  58  26.3105826.310\,\,58\,\,26.3 +56  47  31.9564731.9+56\,\,47\,\,31.9 0.1360.1360.136 597.87597.87597.87 0.332x10150.332𝑥superscript10150.332x10^{15} 1.3301.3301.330 1.4791.4791.479
11  13  22.7111322.711\,\,13\,\,22.7 +2  32  32.623232.6+2\,\,32\,\,32.6 0.0750.0750.075 431.97431.97431.97 0.170x10150.170𝑥superscript10150.170x10^{15} 1.3041.3041.304 1.0691.0691.069
11  15  32.2111532.211\,\,15\,\,32.2 +54  26  5.654265.6+54\,\,26\,\,5.6 0.0700.0700.070 628.67628.67628.67 0.334x10150.334𝑥superscript10150.334x10^{15} 1.2131.2131.213 1.5561.5561.556
11  21  36.2112136.211\,\,21\,\,36.2 +48  3  50.048350.0+48\,\,3\,\,50.0 0.1120.1120.112 728.02728.02728.02 0.541x10150.541𝑥superscript10150.541x10^{15} 1.4621.4621.462 1.8011.8011.801
11  33  17.3113317.311\,\,33\,\,17.3 +66  22  45.5662245.5+66\,\,22\,\,45.5 0.1150.1150.115 847.57847.57847.57 0.934x10150.934𝑥superscript10150.934x10^{15} 1.8651.8651.865 2.0972.0972.097
11  44  8.211448.211\,\,44\,\,8.2 +5  45  22.754522.7+5\,\,45\,\,22.7 0.1030.1030.103 586.83586.83586.83 0.370x10150.370𝑥superscript10150.370x10^{15} 1.5411.5411.541 1.4521.4521.452
11  44  40.8114440.811\,\,44\,\,40.8 +67  24  40.0672440.0+67\,\,24\,\,40.0 0.1170.1170.117 453.55453.55453.55 0.221x10150.221𝑥superscript10150.221x10^{15} 1.5421.5421.542 1.1221.1221.122
12  0  24.512024.512\,\,0\,\,24.5 +3  19  51.631951.6+3\,\,19\,\,51.6 0.1330.1330.133 858.09858.09858.09 0.119x10160.119𝑥superscript10160.119x10^{16} 2.3102.3102.310 2.1232.1232.123
12  17  40.8121740.812\,\,17\,\,40.8 +3  39  41.033941.0+3\,\,39\,\,41.0 0.0770.0770.077 922.14922.14922.14 0.113x10160.113𝑥superscript10160.113x10^{16} 1.9031.9031.903 2.2822.2822.282
12  58  41.1125841.112\,\,58\,\,41.1 1  45  24.814524.8-1\,\,45\,\,24.8 0.0840.0840.084 740.78740.78740.78 0.769x10150.769𝑥superscript10150.769x10^{15} 2.0102.0102.010 1.8331.8331.833
13  2  50.713250.713\,\,2\,\,50.7 2  30  22.323022.3-2\,\,30\,\,22.3 0.0830.0830.083 681.06681.06681.06 0.534x10150.534𝑥superscript10150.534x10^{15} 1.6501.6501.650 1.6851.6851.685
13  3  56.513356.513\,\,3\,\,56.5 +67  31  3.767313.7+67\,\,31\,\,3.7 0.1060.1060.106 659.69659.69659.69 0.358x10150.358𝑥superscript10150.358x10^{15} 1.1791.1791.179 1.6321.6321.632
13  9  17.013917.013\,\,9\,\,17.0 1  36  45.413645.4-1\,\,36\,\,45.4 0.0830.0830.083 519.51519.51519.51 0.238x10150.238𝑥superscript10150.238x10^{15} 1.2641.2641.264 1.2851.2851.285
13  26  17.8132617.813\,\,26\,\,17.8 +0  13  32.501332.5+0\,\,13\,\,32.5 0.0820.0820.082 501.04501.04501.04 0.242x10150.242𝑥superscript10150.242x10^{15} 1.3821.3821.382 1.2401.2401.240
13  30  49.9133049.913\,\,30\,\,49.9 1  52  22.115222.1-1\,\,52\,\,22.1 0.0870.0870.087 659.17659.17659.17 0.480x10150.480𝑥superscript10150.480x10^{15} 1.5851.5851.585 1.6311.6311.631
13  32  38.9133238.913\,\,32\,\,38.9 +54  19  9.554199.5+54\,\,19\,\,9.5 0.1010.1010.101 811.68811.68811.68 0.927x10150.927𝑥superscript10150.927x10^{15} 2.0182.0182.018 2.0082.0082.008
13  36  6.513366.513\,\,36\,\,6.5 +59  12  26.6591226.6+59\,\,12\,\,26.6 0.0710.0710.071 934.40934.40934.40 0.123x10160.123𝑥superscript10160.123x10^{16} 2.0172.0172.017 2.3122.3122.312
13  42  28.3134228.313\,\,42\,\,28.3 +2  14  45.221445.2+2\,\,14\,\,45.2 0.0770.0770.077 752.26752.26752.26 0.686x10150.686𝑥superscript10150.686x10^{15} 1.7381.7381.738 1.8611.8611.861
13  53  0.813530.813\,\,53\,\,0.8 +5  9  21.25921.2+5\,\,9\,\,21.2 0.0790.0790.079 755.36755.36755.36 0.579x10150.579𝑥superscript10150.579x10^{15} 1.4541.4541.454 1.8691.8691.869
14  14  47.4141447.414\,\,14\,\,47.4 0  23  56.802356.8-0\,\,23\,\,56.8 0.1400.1400.140 612.45612.45612.45 0.448x10150.448𝑥superscript10150.448x10^{15} 1.7121.7121.712 1.5151.5151.515
14  24  40.4142440.414\,\,24\,\,40.4 +2  44  46.724446.7+2\,\,44\,\,46.7 0.0550.0550.055 558.59558.59558.59 0.208x10150.208𝑥superscript10150.208x10^{15} 0.9540.9540.954 1.3821.3821.382
14  25  22.9142522.914\,\,25\,\,22.9 +63  11  22.6631122.6+63\,\,11\,\,22.6 0.1390.1390.139 1052.311052.311052.31 0.198x10160.198𝑥superscript10160.198x10^{16} 2.5572.5572.557 2.6042.6042.604
15  12  51.1151251.115\,\,12\,\,51.1 1  28  47.312847.3-1\,\,28\,\,47.3 0.1220.1220.122 812.48812.48812.48 0.895x10150.895𝑥superscript10150.895x10^{15} 1.9431.9431.943 2.0102.0102.010
15  16  34.0151634.015\,\,16\,\,34.0 0  56  55.705655.7-0\,\,56\,\,55.7 0.1180.1180.118 539.58539.58539.58 0.385x10150.385𝑥superscript10150.385x10^{15} 1.8971.8971.897 1.3351.3351.335
15  29  12.1152912.115\,\,29\,\,12.1 +52  50  39.8525039.8+52\,\,50\,\,39.8 0.0740.0740.074 694.40694.40694.40 0.522x10150.522𝑥superscript10150.522x10^{15} 1.5531.5531.553 1.7181.7181.718
16  1  22.116122.116\,\,1\,\,22.1 +53  54  19.1535419.1+53\,\,54\,\,19.1 0.1060.1060.106 491.24491.24491.24 0.284x10150.284𝑥superscript10150.284x10^{15} 1.6861.6861.686 1.2161.2161.216
16  11  17.7161117.716\,\,11\,\,17.7 +36  57  38.2365738.2+36\,\,57\,\,38.2 0.0670.0670.067 529.83529.83529.83 0.275x10150.275𝑥superscript10150.275x10^{15} 1.4061.4061.406 1.3111.3111.311
16  56  20.3165620.316\,\,56\,\,20.3 +39  16  59.9391659.9+39\,\,16\,\,59.9 0.0620.0620.062 440.23440.23440.23 0.140x10150.140𝑥superscript10150.140x10^{15} 1.0341.0341.034 1.0891.0891.089
16  59  45.4165945.416\,\,59\,\,45.4 +32  36  58.0323658.0+32\,\,36\,\,58.0 0.1010.1010.101 512.65512.65512.65 0.257x10150.257𝑥superscript10150.257x10^{15} 1.4031.4031.403 1.2681.2681.268
17  2  42.617242.617\,\,2\,\,42.6 +34  3  40.734340.7+34\,\,3\,\,40.7 0.0990.0990.099 1060.161060.161060.16 0.161x10160.161𝑥superscript10160.161x10^{16} 2.0592.0592.059 2.6232.6232.623
17  12  47.6171247.617\,\,12\,\,47.6 +64  3  47.564347.5+64\,\,3\,\,47.5 0.0800.0800.080 1037.591037.591037.59 0.167x10160.167𝑥superscript10160.167x10^{16} 2.2232.2232.223 2.5672.5672.567
17  18  9.917189.917\,\,18\,\,9.9 +56  39  59.0563959.0+56\,\,39\,\,59.0 0.1130.1130.113 676.01676.01676.01 0.565x10150.565𝑥superscript10150.565x10^{15} 1.7721.7721.772 1.6731.6731.673
21  24  56.3212456.321\,\,24\,\,56.3 6  56  47.465647.4-6\,\,56\,\,47.4 0.1180.1180.118 809.90809.90809.90 0.102x10160.102𝑥superscript10160.102x10^{16} 2.2242.2242.224 2.0042.0042.004
21  57  25.8215725.821\,\,57\,\,25.8 7  47  40.674740.6-7\,\,47\,\,40.6 0.0580.0580.058 649.63649.63649.63 0.498x10150.498𝑥superscript10150.498x10^{15} 1.6921.6921.692 1.6071.6071.607
22  16  15.5221615.522\,\,16\,\,15.5 9  20  23.692023.6-9\,\,20\,\,23.6 0.0840.0840.084 488.35488.35488.35 0.218x10150.218𝑥superscript10150.218x10^{15} 1.3111.3111.311 1.2081.2081.208
Table 5: continued.
Table 6: Analogous to table LABEL:tb:pop, for C-K07-I cluster sample.
α𝛼\alpha (J200020002000.000000) δ𝛿\delta (J200020002000.000000) z𝑧z σ𝜎\sigma Mvirsubscript𝑀𝑣𝑖𝑟M_{vir} Rvirsubscript𝑅𝑣𝑖𝑟R_{vir} R200subscript𝑅200R_{200}
[hms]delimited-[]𝑚𝑠[h\;m\;s] [°′′\degr\;^{\prime}\;{}^{\prime\prime}] [kms1[\rm{km\leavevmode\nobreak\ s^{-1}}] [h1Msuperscript1subscript𝑀direct-producth^{-1}M_{\odot}] [h1Mpcsuperscript1Mpch^{-1}{\rm{Mpc}}] [h1Mpcsuperscript1Mpch^{-1}{\rm{Mpc}}]
15  58  18.4155818.415\,\,58\,\,18.4 +27  16  12.0271612.0+27\,\,16\,\,12.0 0.0900.0900.090 1070.731070.731070.73 0.221x10160.221𝑥superscript10160.221x10^{16} 2.7662.7662.766 2.6492.6492.649
15  10  1.715101.715\,\,10\,\,1.7 +33  28  24.2332824.2+33\,\,28\,\,24.2 0.1100.1100.110 844.46844.46844.46 0.841x10150.841𝑥superscript10150.841x10^{15} 1.6911.6911.691 2.0892.0892.089
13  25  16.7132516.713\,\,25\,\,16.7 +57  37  1.257371.2+57\,\,37\,\,1.2 0.1160.1160.116 747.53747.53747.53 0.772x10150.772𝑥superscript10150.772x10^{15} 1.9801.9801.980 1.8501.8501.850
10  19  55.6101955.610\,\,19\,\,55.6 +40  59  23.3405923.3+40\,\,59\,\,23.3 0.0920.0920.092 899.02899.02899.02 0.747x10150.747𝑥superscript10150.747x10^{15} 1.3251.3251.325 2.2242.2242.224
16  42  38.6164238.616\,\,42\,\,38.6 +27  26  24.0272624.0+27\,\,26\,\,24.0 0.1040.1040.104 983.57983.57983.57 0.145x10160.145𝑥superscript10160.145x10^{16} 2.1512.1512.151 2.4342.4342.434
14  28  30.8142830.814\,\,28\,\,30.8 +56  48  18.7564818.7+56\,\,48\,\,18.7 0.1060.1060.106 776.22776.22776.22 0.875x10150.875𝑥superscript10150.875x10^{15} 2.0812.0812.081 1.9211.9211.921
10  27  46.8102746.810\,\,27\,\,46.8 +10  32  26.9103226.9+10\,\,32\,\,26.9 0.1090.1090.109 673.64673.64673.64 0.438x10150.438𝑥superscript10150.438x10^{15} 1.3831.3831.383 1.6671.6671.667
15  39  50.6153950.615\,\,39\,\,50.6 +30  42  36.0304236.0+30\,\,42\,\,36.0 0.0970.0970.097 751.73751.73751.73 0.647x10150.647𝑥superscript10150.647x10^{15} 1.6421.6421.642 1.8601.8601.860
14  35  20.0143520.014\,\,35\,\,20.0 +55  10  58.1551058.1+55\,\,10\,\,58.1 0.1400.1400.140 910.40910.40910.40 0.121x10160.121𝑥superscript10160.121x10^{16} 2.0952.0952.095 2.2532.2532.253
8  54  15.185415.18\,\,54\,\,15.1 +29  3  30.629330.6+29\,\,3\,\,30.6 0.0850.0850.085 670.67670.67670.67 0.409x10150.409𝑥superscript10150.409x10^{15} 1.3051.3051.305 1.6591.6591.659
14  58  44.4145844.414\,\,58\,\,44.4 +47  32  24.0473224.0+47\,\,32\,\,24.0 0.0850.0850.085 603.92603.92603.92 0.450x10150.450𝑥superscript10150.450x10^{15} 1.7671.7671.767 1.4941.4941.494
8  18  9.88189.88\,\,18\,\,9.8 +54  35  39.1543539.1+54\,\,35\,\,39.1 0.1180.1180.118 438.81438.81438.81 0.216x10150.216𝑥superscript10150.216x10^{15} 1.6071.6071.607 1.0861.0861.086
12  33  13.9123313.912\,\,33\,\,13.9 +67  7  12.067712.0+67\,\,7\,\,12.0 0.1050.1050.105 1000.661000.661000.66 0.202x10160.202𝑥superscript10160.202x10^{16} 2.8882.8882.888 2.4762.4762.476
9  1  30.19130.19\,\,1\,\,30.1 +55  39  16.6553916.6+55\,\,39\,\,16.6 0.1160.1160.116 979.65979.65979.65 0.547x10150.547𝑥superscript10150.547x10^{15} 0.8170.8170.817 2.4242.4242.424
8  54  51.585451.58\,\,54\,\,51.5 +0  50  50.305050.3+0\,\,50\,\,50.3 0.1080.1080.108 685.18685.18685.18 0.525x10150.525𝑥superscript10150.525x10^{15} 1.6041.6041.604 1.6951.6951.695
15  24  11.8152411.815\,\,24\,\,11.8 +29  51  22.0295122.0+29\,\,51\,\,22.0 0.1140.1140.114 1219.201219.201219.20 0.215x10160.215𝑥superscript10160.215x10^{16} 2.0722.0722.072 3.0173.0173.017
15  24  32.0152432.015\,\,24\,\,32.0 +29  43  38.6294338.6+29\,\,43\,\,38.6 0.1120.1120.112 1100.421100.421100.42 0.203x10160.203𝑥superscript10160.203x10^{16} 2.4042.4042.404 2.7232.7232.723
15  47  41.5154741.515\,\,47\,\,41.5 +33  19  53.0331953.0+33\,\,19\,\,53.0 0.1140.1140.114 518.23518.23518.23 0.285x10150.285𝑥superscript10150.285x10^{15} 1.5191.5191.519 1.2821.2821.282
9  23  26.992326.99\,\,23\,\,26.9 +8  39  2.58392.5+8\,\,39\,\,2.5 0.1290.1290.129 844.89844.89844.89 0.996x10150.996𝑥superscript10150.996x10^{15} 2.0012.0012.001 2.0912.0912.091
11  53  51.2115351.211\,\,53\,\,51.2 +15  26  35.9152635.9+15\,\,26\,\,35.9 0.1130.1130.113 748.88748.88748.88 0.551x10150.551𝑥superscript10150.551x10^{15} 1.4091.4091.409 1.8531.8531.853
16  20  31.1162031.116\,\,20\,\,31.1 +29  53  27.6295327.6+29\,\,53\,\,27.6 0.0970.0970.097 853.98853.98853.98 0.103x10160.103𝑥superscript10160.103x10^{16} 2.0302.0302.030 2.1132.1132.113
16  3  19.816319.816\,\,3\,\,19.8 +25  27  13.3252713.3+25\,\,27\,\,13.3 0.0880.0880.088 582.84582.84582.84 0.271x10150.271𝑥superscript10150.271x10^{15} 1.1431.1431.143 1.4421.4421.442
14  54  37.1145437.114\,\,54\,\,37.1 +54  25  23.2542523.2+54\,\,25\,\,23.2 0.1000.1000.100 630.37630.37630.37 0.423x10150.423𝑥superscript10150.423x10^{15} 1.5251.5251.525 1.5601.5601.560
21  30  27.0213027.021\,\,30\,\,27.0 0  0  24.50024.5-0\,\,0\,\,24.5 0.1350.1350.135 555.00555.00555.00 0.317x10150.317𝑥superscript10150.317x10^{15} 1.4781.4781.478 1.3731.3731.373
15  19  33.7151933.715\,\,19\,\,33.7 +4  20  16.842016.8+4\,\,20\,\,16.8 0.1030.1030.103 664.20664.20664.20 0.361x10150.361𝑥superscript10150.361x10^{15} 1.1731.1731.173 1.6431.6431.643
21  49  4.621494.621\,\,49\,\,4.6 8  10  49.481049.4-8\,\,10\,\,49.4 0.1330.1330.133 880.13880.13880.13 0.857x10150.857𝑥superscript10150.857x10^{15} 1.5861.5861.586 2.1782.1782.178
8  50  7.18507.18\,\,50\,\,7.1 +29  32  52.1293252.1+29\,\,32\,\,52.1 0.1040.1040.104 730.39730.39730.39 0.707x10150.707𝑥superscript10150.707x10^{15} 1.8991.8991.899 1.8071.8071.807
8  54  57.585457.58\,\,54\,\,57.5 +35  24  51.8352451.8+35\,\,24\,\,51.8 0.1460.1460.146 1271.751271.751271.75 0.245x10160.245𝑥superscript10160.245x10^{16} 2.1702.1702.170 3.1473.1473.147
14  29  21.1142921.114\,\,29\,\,21.1 +23  6  29.923629.9+23\,\,6\,\,29.9 0.1380.1380.138 716.15716.15716.15 0.493x10150.493𝑥superscript10150.493x10^{15} 1.3791.3791.379 1.7721.7721.772
11  40  33.9114033.911\,\,40\,\,33.9 +10  21  41.0102141.0+10\,\,21\,\,41.0 0.1050.1050.105 412.45412.45412.45 0.143x10150.143𝑥superscript10150.143x10^{15} 1.2011.2011.201 1.0211.0211.021
11  13  48.5111348.511\,\,13\,\,48.5 0  24  30.602430.6-0\,\,24\,\,30.6 0.1000.1000.100 561.71561.71561.71 0.369x10150.369𝑥superscript10150.369x10^{15} 1.6771.6771.677 1.3901.3901.390
16  47  40.6164740.616\,\,47\,\,40.6 +29  55  18.1295518.1+29\,\,55\,\,18.1 0.0990.0990.099 1004.141004.141004.14 0.103x10160.103𝑥superscript10160.103x10^{16} 1.4701.4701.470 2.4852.4852.485
9  7  56.89756.89\,\,7\,\,56.8 +52  48  2.952482.9+52\,\,48\,\,2.9 0.0990.0990.099 732.91732.91732.91 0.462x10150.462𝑥superscript10150.462x10^{15} 1.2321.2321.232 1.8131.8131.813
10  9  34.310934.310\,\,9\,\,34.3 +44  42  38.5444238.5+44\,\,42\,\,38.5 0.1460.1460.146 1080.561080.561080.56 0.161x10160.161𝑥superscript10160.161x10^{16} 1.9741.9741.974 2.6742.6742.674
10  8  0.41080.410\,\,8\,\,0.4 +38  1  5.93815.9+38\,\,1\,\,5.9 0.1120.1120.112 574.80574.80574.80 0.397x10150.397𝑥superscript10150.397x10^{15} 1.7251.7251.725 1.4221.4221.422
10  35  48.9103548.910\,\,35\,\,48.9 +36  5  58.636558.6+36\,\,5\,\,58.6 0.1230.1230.123 462.89462.89462.89 0.169x10150.169𝑥superscript10150.169x10^{15} 1.1341.1341.134 1.1451.1451.145
14  7  46.514746.514\,\,7\,\,46.5 +14  0  11.914011.9+14\,\,0\,\,11.9 0.1350.1350.135 658.33658.33658.33 0.458x10150.458𝑥superscript10150.458x10^{15} 1.5151.5151.515 1.6291.6291.629
11  20  24.7112024.711\,\,20\,\,24.7 +47  9  26.347926.3+47\,\,9\,\,26.3 0.1120.1120.112 605.14605.14605.14 0.425x10150.425𝑥superscript10150.425x10^{15} 1.6641.6641.664 1.4971.4971.497
10  41  34.6104134.610\,\,41\,\,34.6 0  36  53.603653.6-0\,\,36\,\,53.6 0.1350.1350.135 793.10793.10793.10 0.753x10150.753𝑥superscript10150.753x10^{15} 1.7171.7171.717 1.9621.9621.962
2  25  19.222519.22\,\,25\,\,19.2 8  44  5.38445.3-8\,\,44\,\,5.3 0.0540.0540.054 479.32479.32479.32 0.131x10150.131𝑥superscript10150.131x10^{15} 0.8170.8170.817 1.1861.1861.186
0  28  22.502822.50\,\,28\,\,22.5 +13  52  23.5135223.5+13\,\,52\,\,23.5 0.1410.1410.141 578.78578.78578.78 0.496x10150.496𝑥superscript10150.496x10^{15} 2.1252.1252.125 1.4321.4321.432
12  12  52.5121252.512\,\,12\,\,52.5 +6  3  48.26348.2+6\,\,3\,\,48.2 0.1370.1370.137 580.40580.40580.40 0.353x10150.353𝑥superscript10150.353x10^{15} 1.5021.5021.502 1.4361.4361.436
12  47  20.0124720.012\,\,47\,\,20.0 +0  8  39.10839.1+0\,\,8\,\,39.1 0.0890.0890.089 779.99779.99779.99 0.680x10150.680𝑥superscript10150.680x10^{15} 1.6041.6041.604 1.9301.9301.930
14  47  33.3144733.314\,\,47\,\,33.3 +33  2  38.433238.4+33\,\,2\,\,38.4 0.0870.0870.087 314.85314.85314.85 0.901x10140.901𝑥superscript10140.901x10^{14} 1.3031.3031.303 0.7790.7790.779
15  29  1.315291.315\,\,29\,\,1.3 +30  46  20.6304620.6+30\,\,46\,\,20.6 0.1050.1050.105 647.03647.03647.03 0.413x10150.413𝑥superscript10150.413x10^{15} 1.4141.4141.414 1.6011.6011.601
8  29  29.482929.48\,\,29\,\,29.4 +39  9  27.739927.7+39\,\,9\,\,27.7 0.0920.0920.092 659.36659.36659.36 0.417x10150.417𝑥superscript10150.417x10^{15} 1.3761.3761.376 1.6321.6321.632
1  1  3.3113.31\,\,1\,\,3.3 9  57  34.695734.6-9\,\,57\,\,34.6 0.1500.1500.150 776.20776.20776.20 0.765x10150.765𝑥superscript10150.765x10^{15} 1.8201.8201.820 1.9211.9211.921
13  21  54.0132154.013\,\,21\,\,54.0 +57  32  21.5573221.5+57\,\,32\,\,21.5 0.1180.1180.118 379.97379.97379.97 0.121x10150.121𝑥superscript10150.121x10^{15} 1.2011.2011.201 0.9400.9400.940
20  51  42.2205142.220\,\,51\,\,42.2 0  4  8.0048.0-0\,\,4\,\,8.0 0.1080.1080.108 468.59468.59468.59 0.180x10150.180𝑥superscript10150.180x10^{15} 1.1771.1771.177 1.1591.1591.159
21  26  36.9212636.921\,\,26\,\,36.9 6  39  13.063913.0-6\,\,39\,\,13.0 0.1240.1240.124 513.26513.26513.26 0.291x10150.291𝑥superscript10150.291x10^{15} 1.5841.5841.584 1.2701.2701.270
12  4  8.31248.312\,\,4\,\,8.3 +4  19  33.241933.2+4\,\,19\,\,33.2 0.1360.1360.136 737.57737.57737.57 0.654x10150.654𝑥superscript10150.654x10^{15} 1.7241.7241.724 1.8251.8251.825
15  16  46.1151646.115\,\,16\,\,46.1 0  54  2.90542.9-0\,\,54\,\,2.9 0.1180.1180.118 877.76877.76877.76 0.118x10160.118𝑥superscript10160.118x10^{16} 2.2042.2042.204 2.1722.1722.172
10  58  1.510581.510\,\,58\,\,1.5 +41  2  47.841247.8+41\,\,2\,\,47.8 0.1290.1290.129 919.45919.45919.45 0.867x10150.867𝑥superscript10150.867x10^{15} 1.4711.4711.471 2.2752.2752.275
11  21  26.4112126.411\,\,21\,\,26.4 +53  44  56.8534456.8+53\,\,44\,\,56.8 0.1040.1040.104 694.49694.49694.49 0.536x10150.536𝑥superscript10150.536x10^{15} 1.5921.5921.592 1.7181.7181.718
8  14  52.781452.78\,\,14\,\,52.7 +6  57  42.865742.8+6\,\,57\,\,42.8 0.1100.1100.110 575.06575.06575.06 0.283x10150.283𝑥superscript10150.283x10^{15} 1.2251.2251.225 1.4231.4231.423
12  48  40.0124840.012\,\,48\,\,40.0 +62  37  3.062373.0+62\,\,37\,\,3.0 0.1040.1040.104 640.81640.81640.81 0.294x10150.294𝑥superscript10150.294x10^{15} 1.0251.0251.025 1.5861.5861.586
16  45  37.9164537.916\,\,45\,\,37.9 +27  18  45.0271845.0+27\,\,18\,\,45.0 0.1010.1010.101 511.66511.66511.66 0.188x10150.188𝑥superscript10150.188x10^{15} 1.0291.0291.029 1.2661.2661.266
9  15  57.891557.89\,\,15\,\,57.8 +5  29  0.65290.6+5\,\,29\,\,0.6 0.1420.1420.142 624.91624.91624.91 0.445x10150.445𝑥superscript10150.445x10^{15} 1.6331.6331.633 1.5461.5461.546
10  20  15.3102015.310\,\,20\,\,15.3 +39  18  13.3391813.3+39\,\,18\,\,13.3 0.1470.1470.147 445.84445.84445.84 0.169x10150.169𝑥superscript10150.169x10^{15} 1.2181.2181.218 1.1031.1031.103
21  47  8.521478.521\,\,47\,\,8.5 7  53  30.875330.8-7\,\,53\,\,30.8 0.1300.1300.130 761.77761.77761.77 0.447x10150.447𝑥superscript10150.447x10^{15} 1.1041.1041.104 1.8851.8851.885
21  41  16.2214116.221\,\,41\,\,16.2 8  23  9.28239.2-8\,\,23\,\,9.2 0.1290.1290.129 826.61826.61826.61 0.702x10150.702𝑥superscript10150.702x10^{15} 1.4741.4741.474 2.0452.0452.045
15  10  8.915108.915\,\,10\,\,8.9 +2  59  48.825948.8+2\,\,59\,\,48.8 0.0930.0930.093 571.04571.04571.04 0.320x10150.320𝑥superscript10150.320x10^{15} 1.4081.4081.408 1.4131.4131.413
11  46  16.8114616.811\,\,46\,\,16.8 +11  11  1.711111.7+11\,\,11\,\,1.7 0.1120.1120.112 397.07397.07397.07 0.147x10150.147𝑥superscript10150.147x10^{15} 1.3371.3371.337 0.9830.9830.983
22  58  2.622582.622\,\,58\,\,2.6 +14  9  48.614948.6+14\,\,9\,\,48.6 0.0940.0940.094 433.07433.07433.07 0.103x10150.103𝑥superscript10150.103x10^{15} 0.7850.7850.785 1.0721.0721.072
15  43  12.4154312.415\,\,43\,\,12.4 +5  52  6.25526.2+5\,\,52\,\,6.2 0.1060.1060.106 835.13835.13835.13 0.932x10150.932𝑥superscript10150.932x10^{15} 1.9161.9161.916 2.0662.0662.066
11  42  17.5114217.511\,\,42\,\,17.5 +10  17  30.8101730.8+10\,\,17\,\,30.8 0.1170.1170.117 435.71435.71435.71 0.134x10150.134𝑥superscript10150.134x10^{15} 1.0131.0131.013 1.0781.0781.078
9  6  37.69637.69\,\,6\,\,37.6 +10  19  5.210195.2+10\,\,19\,\,5.2 0.1340.1340.134 762.70762.70762.70 0.782x10150.782𝑥superscript10150.782x10^{15} 1.9281.9281.928 1.8871.8871.887
11  44  53.8114453.811\,\,44\,\,53.8 +51  16  1.251161.2+51\,\,16\,\,1.2 0.1290.1290.129 804.40804.40804.40 0.881x10150.881𝑥superscript10150.881x10^{15} 1.9531.9531.953 1.9901.9901.990
12  55  58.8125558.812\,\,55\,\,58.8 +62  8  48.562848.5+62\,\,8\,\,48.5 0.1050.1050.105 653.23653.23653.23 0.303x10150.303𝑥superscript10150.303x10^{15} 1.0181.0181.018 1.6161.6161.616
0  21  7.60217.60\,\,21\,\,7.6 0  55  31.405531.4-0\,\,55\,\,31.4 0.1110.1110.111 623.97623.97623.97 0.375x10150.375𝑥superscript10150.375x10^{15} 1.3821.3821.382 1.5441.5441.544
12  15  1.912151.912\,\,15\,\,1.9 2  41  25.824125.8-2\,\,41\,\,25.8 0.1100.1100.110 347.44347.44347.44 0.823x10140.823𝑥superscript10140.823x10^{14} 0.9780.9780.978 0.8600.8600.860
10  29  25.1102925.110\,\,29\,\,25.1 +37  37  48.0373748.0+37\,\,37\,\,48.0 0.1080.1080.108 304.95304.95304.95 0.108x10150.108𝑥superscript10150.108x10^{15} 1.6661.6661.666 0.7550.7550.755
16  47  44.9164744.916\,\,47\,\,44.9 +29  10  55.2291055.2+29\,\,10\,\,55.2 0.1340.1340.134 1077.761077.761077.76 0.179x10160.179𝑥superscript10160.179x10^{16} 2.2052.2052.205 2.6672.6672.667
15  23  36.5152336.515\,\,23\,\,36.5 +31  1  17.431117.4+31\,\,1\,\,17.4 0.0740.0740.074 909.39909.39909.39 0.120x10160.120𝑥superscript10160.120x10^{16} 2.0822.0822.082 2.2502.2502.250
22  9  56.222956.222\,\,9\,\,56.2 7  50  50.675050.6-7\,\,50\,\,50.6 0.1160.1160.116 555.93555.93555.93 0.355x10150.355𝑥superscript10150.355x10^{15} 1.6471.6471.647 1.3761.3761.376
11  53  58.9115358.911\,\,53\,\,58.9 +9  39  29.993929.9+9\,\,39\,\,29.9 0.1030.1030.103 766.07766.07766.07 0.557x10150.557𝑥superscript10150.557x10^{15} 1.3601.3601.360 1.8961.8961.896
7  59  39.475939.47\,\,59\,\,39.4 +41  50  24.0415024.0+41\,\,50\,\,24.0 0.1320.1320.132 647.49647.49647.49 0.477x10150.477𝑥superscript10150.477x10^{15} 1.6311.6311.631 1.6021.6021.602
15  39  56.0153956.015\,\,39\,\,56.0 2  11  47.821147.8-2\,\,11\,\,47.8 0.1500.1500.150 941.81941.81941.81 0.129x10160.129𝑥superscript10160.129x10^{16} 2.0882.0882.088 2.3302.3302.330
11  43  45.5114345.511\,\,43\,\,45.5 +46  20  56.4462056.4+46\,\,20\,\,56.4 0.1140.1140.114 496.34496.34496.34 0.290x10150.290𝑥superscript10150.290x10^{15} 1.6891.6891.689 1.2281.2281.228
14  29  14.4142914.414\,\,29\,\,14.4 +33  59  23.6335923.6+33\,\,59\,\,23.6 0.1300.1300.130 919.26919.26919.26 0.147x10160.147𝑥superscript10160.147x10^{16} 2.5002.5002.500 2.2752.2752.275
11  48  59.9114859.911\,\,48\,\,59.9 +51  36  54.4513654.4+51\,\,36\,\,54.4 0.1310.1310.131 883.70883.70883.70 0.114x10160.114𝑥superscript10160.114x10^{16} 2.0952.0952.095 2.1872.1872.187
15  16  39.5151639.515\,\,16\,\,39.5 +2  47  12.824712.8+2\,\,47\,\,12.8 0.1110.1110.111 466.11466.11466.11 0.173x10150.173𝑥superscript10150.173x10^{15} 1.1401.1401.140 1.1531.1531.153
14  14  12.3141412.314\,\,14\,\,12.3 +6  52  3.06523.0+6\,\,52\,\,3.0 0.1090.1090.109 639.74639.74639.74 0.469x10150.469𝑥superscript10150.469x10^{15} 1.6421.6421.642 1.5831.5831.583
21  40  1.021401.021\,\,40\,\,1.0 8  5  53.58553.5-8\,\,5\,\,53.5 0.1320.1320.132 709.70709.70709.70 0.653x10150.653𝑥superscript10150.653x10^{15} 1.8601.8601.860 1.7561.7561.756
10  49  37.8104937.810\,\,49\,\,37.8 +3  38  51.433851.4+3\,\,38\,\,51.4 0.1510.1510.151 759.96759.96759.96 0.816x10150.816𝑥superscript10150.816x10^{15} 2.0252.0252.025 1.8801.8801.880
23  49  28.7234928.723\,\,49\,\,28.7 +15  14  6.715146.7+15\,\,14\,\,6.7 0.1140.1140.114 645.35645.35645.35 0.361x10150.361𝑥superscript10150.361x10^{15} 1.2431.2431.243 1.5971.5971.597
11  44  1.411441.411\,\,44\,\,1.4 1  45  27.714527.7-1\,\,45\,\,27.7 0.1060.1060.106 647.10647.10647.10 0.400x10150.400𝑥superscript10150.400x10^{15} 1.3701.3701.370 1.6011.6011.601
13  40  57.8134057.813\,\,40\,\,57.8 +3  9  53.33953.3+3\,\,9\,\,53.3 0.1150.1150.115 483.52483.52483.52 0.270x10150.270𝑥superscript10150.270x10^{15} 1.6531.6531.653 1.1961.1961.196
16  7  33.416733.416\,\,7\,\,33.4 +23  13  18.1231318.1+23\,\,13\,\,18.1 0.0880.0880.088 420.68420.68420.68 0.132x10150.132𝑥superscript10150.132x10^{15} 1.0691.0691.069 1.0411.0411.041
15  42  34.4154234.415\,\,42\,\,34.4 +41  49  13.1414913.1+41\,\,49\,\,13.1 0.1410.1410.141 701.91701.91701.91 0.616x10150.616𝑥superscript10150.616x10^{15} 1.7931.7931.793 1.7371.7371.737
14  30  33.6143033.614\,\,30\,\,33.6 +24  40  3.424403.4+24\,\,40\,\,3.4 0.1340.1340.134 873.70873.70873.70 0.123x10160.123𝑥superscript10160.123x10^{16} 2.3062.3062.306 2.1622.1622.162
10  30  17.4103017.410\,\,30\,\,17.4 +41  8  28.741828.7+41\,\,8\,\,28.7 0.0910.0910.091 483.52483.52483.52 0.180x10150.180𝑥superscript10150.180x10^{15} 1.1051.1051.105 1.1961.1961.196
8  54  10.185410.18\,\,54\,\,10.1 +23  34  33.2233433.2+23\,\,34\,\,33.2 0.1120.1120.112 481.69481.69481.69 0.222x10150.222𝑥superscript10150.222x10^{15} 1.3721.3721.372 1.1921.1921.192
7  53  25.275325.27\,\,53\,\,25.2 +34  16  32.5341632.5+34\,\,16\,\,32.5 0.1390.1390.139 410.75410.75410.75 0.151x10150.151𝑥superscript10150.151x10^{15} 1.2861.2861.286 1.0161.0161.016
8  39  16.783916.78\,\,39\,\,16.7 +8  22  50.982250.9+8\,\,22\,\,50.9 0.1320.1320.132 815.42815.42815.42 0.996x10150.996𝑥superscript10150.996x10^{15} 2.1482.1482.148 2.0182.0182.018
16  34  4.816344.816\,\,34\,\,4.8 +40  55  59.9405559.9+40\,\,55\,\,59.9 0.1360.1360.136 591.23591.23591.23 0.323x10150.323𝑥superscript10150.323x10^{15} 1.3261.3261.326 1.4631.4631.463
10  31  35.7103135.710\,\,31\,\,35.7 +35  3  15.835315.8+35\,\,3\,\,15.8 0.1220.1220.122 928.83928.83928.83 0.130x10160.130𝑥superscript10160.130x10^{16} 2.1612.1612.161 2.2982.2982.298
9  51  14.295114.29\,\,51\,\,14.2 +8  16  51.681651.6+8\,\,16\,\,51.6 0.1420.1420.142 737.42737.42737.42 0.729x10150.729𝑥superscript10150.729x10^{15} 1.9211.9211.921 1.8251.8251.825
10  24  37.1102437.110\,\,24\,\,37.1 +50  13  28.9501328.9+50\,\,13\,\,28.9 0.1560.1560.156 487.80487.80487.80 0.378x10150.378𝑥superscript10150.378x10^{15} 2.2752.2752.275 1.2071.2071.207
10  36  52.7103652.710\,\,36\,\,52.7 +44  52  35.0445235.0+44\,\,52\,\,35.0 0.1240.1240.124 763.93763.93763.93 0.593x10150.593𝑥superscript10150.593x10^{15} 1.4571.4571.457 1.8901.8901.890
13  56  44.8135644.813\,\,56\,\,44.8 +44  54  11.9445411.9+44\,\,54\,\,11.9 0.1260.1260.126 717.58717.58717.58 0.711x10150.711𝑥superscript10150.711x10^{15} 1.9811.9811.981 1.7761.7761.776
10  16  22.8101622.810\,\,16\,\,22.8 +33  38  17.5333817.5+33\,\,38\,\,17.5 0.1290.1290.129 847.43847.43847.43 0.110x10160.110𝑥superscript10160.110x10^{16} 2.2032.2032.203 2.0972.0972.097
14  8  6.71486.714\,\,8\,\,6.7 +6  33  34.963334.9+6\,\,33\,\,34.9 0.1120.1120.112 601.25601.25601.25 0.385x10150.385𝑥superscript10150.385x10^{15} 1.5281.5281.528 1.4881.4881.488
11  27  30.3112730.311\,\,27\,\,30.3 +0  9  19.40919.4+0\,\,9\,\,19.4 0.1310.1310.131 517.61517.61517.61 0.194x10150.194𝑥superscript10150.194x10^{15} 1.0391.0391.039 1.2811.2811.281
8  44  47.384447.38\,\,44\,\,47.3 +27  41  20.8274120.8+27\,\,41\,\,20.8 0.0850.0850.085 483.87483.87483.87 0.160x10150.160𝑥superscript10150.160x10^{15} 0.9830.9830.983 1.1971.1971.197
11  12  6.711126.711\,\,12\,\,6.7 +30  40  41.9304041.9+30\,\,40\,\,41.9 0.0740.0740.074 623.97623.97623.97 0.326x10150.326𝑥superscript10150.326x10^{15} 1.2021.2021.202 1.5441.5441.544
21  50  36.1215036.121\,\,50\,\,36.1 7  53  28.075328.0-7\,\,53\,\,28.0 0.1220.1220.122 639.67639.67639.67 0.351x10150.351𝑥superscript10150.351x10^{15} 1.2291.2291.229 1.5831.5831.583
13  14  24.7131424.713\,\,14\,\,24.7 +62  19  45.8621945.8+62\,\,19\,\,45.8 0.1350.1350.135 580.22580.22580.22 0.341x10150.341𝑥superscript10150.341x10^{15} 1.4521.4521.452 1.4361.4361.436
11  43  4.011434.011\,\,43\,\,4.0 +11  1  36.511136.5+11\,\,1\,\,36.5 0.1530.1530.153 679.73679.73679.73 0.363x10150.363𝑥superscript10150.363x10^{15} 1.1281.1281.128 1.6821.6821.682
12  27  32.3122732.312\,\,27\,\,32.3 +49  28  44.0492844.0+49\,\,28\,\,44.0 0.1190.1190.119 560.16560.16560.16 0.261x10150.261𝑥superscript10150.261x10^{15} 1.1941.1941.194 1.3861.3861.386
10  32  9.410329.410\,\,32\,\,9.4 +53  19  12.7531912.7+53\,\,19\,\,12.7 0.1350.1350.135 557.49557.49557.49 0.330x10150.330𝑥superscript10150.330x10^{15} 1.5201.5201.520 1.3791.3791.379
9  24  30.892430.89\,\,24\,\,30.8 +7  56  56.075656.0+7\,\,56\,\,56.0 0.1050.1050.105 423.20423.20423.20 0.137x10150.137𝑥superscript10150.137x10^{15} 1.0961.0961.096 1.0471.0471.047
11  4  24.811424.811\,\,4\,\,24.8 +48  36  42.8483642.8+48\,\,36\,\,42.8 0.1110.1110.111 581.89581.89581.89 0.337x10150.337𝑥superscript10150.337x10^{15} 1.4251.4251.425 1.4401.4401.440
14  37  50.0143750.014\,\,37\,\,50.0 +48  36  30.6483630.6+48\,\,36\,\,30.6 0.1220.1220.122 782.47782.47782.47 0.769x10150.769𝑥superscript10150.769x10^{15} 1.8011.8011.801 1.9361.9361.936
8  43  33.984333.98\,\,43\,\,33.9 +38  55  56.3385556.3+38\,\,55\,\,56.3 0.1210.1210.121 484.42484.42484.42 0.218x10150.218𝑥superscript10150.218x10^{15} 1.3301.3301.330 1.1991.1991.199
13  21  18.9132118.913\,\,21\,\,18.9 0  43  43.704343.7-0\,\,43\,\,43.7 0.1080.1080.108 627.17627.17627.17 0.271x10150.271𝑥superscript10150.271x10^{15} 0.9870.9870.987 1.5521.5521.552
12  1  39.012139.012\,\,1\,\,39.0 +58  1  38.658138.6+58\,\,1\,\,38.6 0.1040.1040.104 806.22806.22806.22 0.897x10150.897𝑥superscript10150.897x10^{15} 1.9801.9801.980 1.9951.9951.995
10  45  58.5104558.510\,\,45\,\,58.5 +1  26  56.012656.0+1\,\,26\,\,56.0 0.1050.1050.105 375.80375.80375.80 0.143x10150.143𝑥superscript10150.143x10^{15} 1.4511.4511.451 0.9300.9300.930
10  45  1.510451.510\,\,45\,\,1.5 +58  5  6.05856.0+58\,\,5\,\,6.0 0.1160.1160.116 512.04512.04512.04 0.226x10150.226𝑥superscript10150.226x10^{15} 1.2391.2391.239 1.2671.2671.267
16  24  56.8162456.816\,\,24\,\,56.8 +28  33  41.4283341.4+28\,\,33\,\,41.4 0.1450.1450.145 887.74887.74887.74 0.724x10150.724𝑥superscript10150.724x10^{15} 1.3171.3171.317 2.1972.1972.197
9  46  8.69468.69\,\,46\,\,8.6 +3  46  40.834640.8+3\,\,46\,\,40.8 0.1190.1190.119 545.97545.97545.97 0.317x10150.317𝑥superscript10150.317x10^{15} 1.5231.5231.523 1.3511.3511.351
16  47  46.2164746.216\,\,47\,\,46.2 +29  10  9.529109.5+29\,\,10\,\,9.5 0.1340.1340.134 655.71655.71655.71 0.600x10150.600𝑥superscript10150.600x10^{15} 2.0012.0012.001 1.6221.6221.622
11  37  18.2113718.211\,\,37\,\,18.2 +57  8  2.85782.8+57\,\,8\,\,2.8 0.1170.1170.117 560.11560.11560.11 0.201x10150.201𝑥superscript10150.201x10^{15} 0.9acommentary200.9𝑎𝑐𝑜𝑚𝑚𝑒𝑛𝑡𝑎𝑟𝑦200.9acommentary20 1.3861.3861.386
13  48  13.1134813.113\,\,48\,\,13.1 +57  41  38.0574138.0+57\,\,41\,\,38.0 0.1270.1270.127 1090.141090.141090.14 0.193x10160.193𝑥superscript10160.193x10^{16} 2.3232.3232.323 2.6972.6972.697
0  45  49.804549.80\,\,45\,\,49.8 0  51  1.40511.4-0\,\,51\,\,1.4 0.1050.1050.105 567.44567.44567.44 0.311x10150.311𝑥superscript10150.311x10^{15} 1.3861.3861.386 1.4041.4041.404
12  1  4.51214.512\,\,1\,\,4.5 +15  12  35.6151235.6+15\,\,12\,\,35.6 0.1090.1090.109 529.12529.12529.12 0.179x10150.179𝑥superscript10150.179x10^{15} 0.9150.9150.915 1.3091.3091.309
14  27  24.5142724.514\,\,27\,\,24.5 +55  45  1.155451.1+55\,\,45\,\,1.1 0.1310.1310.131 713.57713.57713.57 0.624x10150.624𝑥superscript10150.624x10^{15} 1.7571.7571.757 1.7661.7661.766
10  7  51.310751.310\,\,7\,\,51.3 +62  30  2.262302.2+62\,\,30\,\,2.2 0.1370.1370.137 560.11560.11560.11 0.187x10150.187𝑥superscript10150.187x10^{15} 0.8530.8530.853 1.3861.3861.386
16  41  40.6164140.616\,\,41\,\,40.6 +22  0  54.422054.4+22\,\,0\,\,54.4 0.1510.1510.151 850.87850.87850.87 0.913x10150.913𝑥superscript10150.913x10^{15} 1.8071.8071.807 2.1052.1052.105
13  23  36.1132336.113\,\,23\,\,36.1 +4  42  40.344240.3+4\,\,42\,\,40.3 0.1340.1340.134 794.57794.57794.57 0.724x10150.724𝑥superscript10150.724x10^{15} 1.6431.6431.643 1.9661.9661.966
8  56  0.88560.88\,\,56\,\,0.8 +48  29  10.3482910.3+48\,\,29\,\,10.3 0.1240.1240.124 668.77668.77668.77 0.421x10150.421𝑥superscript10150.421x10^{15} 1.3511.3511.351 1.6551.6551.655
15  21  15.7152115.715\,\,21\,\,15.7 +32  5  12.132512.1+32\,\,5\,\,12.1 0.1110.1110.111 827.47827.47827.47 0.826x10150.826𝑥superscript10150.826x10^{15} 1.7291.7291.729 2.0472.0472.047
13  59  20.8135920.813\,\,59\,\,20.8 +49  26  51.4492651.4+49\,\,26\,\,51.4 0.1060.1060.106 553.87553.87553.87 0.289x10150.289𝑥superscript10150.289x10^{15} 1.3531.3531.353 1.3701.3701.370
9  26  59.792659.79\,\,26\,\,59.7 +54  22  36.1542236.1+54\,\,22\,\,36.1 0.1250.1250.125 673.39673.39673.39 0.276x10150.276𝑥superscript10150.276x10^{15} 0.8720.8720.872 1.6661.6661.666
15  36  29.8153629.815\,\,36\,\,29.8 1  57  48.215748.2-1\,\,57\,\,48.2 0.1450.1450.145 716.22716.22716.22 0.619x10150.619𝑥superscript10150.619x10^{15} 1.7301.7301.730 1.7721.7721.772
11  21  35.4112135.411\,\,21\,\,35.4 +35  23  24.7352324.7+35\,\,23\,\,24.7 0.1030.1030.103 591.23591.23591.23 0.395x10150.395𝑥superscript10150.395x10^{15} 1.6191.6191.619 1.4631.4631.463
11  48  20.4114820.411\,\,48\,\,20.4 +10  21  8.310218.3+10\,\,21\,\,8.3 0.1130.1130.113 999.27999.27999.27 0.158x10160.158𝑥superscript10160.158x10^{16} 2.2692.2692.269 2.4732.4732.473
10  48  8.810488.810\,\,48\,\,8.8 +31  28  31.1312831.1+31\,\,28\,\,31.1 0.1150.1150.115 623.88623.88623.88 0.302x10150.302𝑥superscript10150.302x10^{15} 1.1121.1121.112 1.5441.5441.544
14  23  49.9142349.914\,\,23\,\,49.9 +6  14  32.361432.3+6\,\,14\,\,32.3 0.1130.1130.113 463.77463.77463.77 0.224x10150.224𝑥superscript10150.224x10^{15} 1.4951.4951.495 1.1481.1481.148
14  48  18.4144818.414\,\,48\,\,18.4 +3  31  44.433144.4+3\,\,31\,\,44.4 0.1240.1240.124 741.07741.07741.07 0.522x10150.522𝑥superscript10150.522x10^{15} 1.3621.3621.362 1.8341.8341.834
8  1  7.0817.08\,\,1\,\,7.0 +17  58  45.1175845.1+17\,\,58\,\,45.1 0.1440.1440.144 454.09454.09454.09 0.109x10150.109𝑥superscript10150.109x10^{15} 0.7560.7560.756 1.1241.1241.124
11  13  33.7111333.711\,\,13\,\,33.7 +37  22  27.8372227.8+37\,\,22\,\,27.8 0.1020.1020.102 556.72556.72556.72 0.300x10150.300𝑥superscript10150.300x10^{15} 1.3861.3861.386 1.3781.3781.378
9  40  30.194030.19\,\,40\,\,30.1 +2  28  35.422835.4+2\,\,28\,\,35.4 0.1510.1510.151 865.54865.54865.54 0.813x10150.813𝑥superscript10150.813x10^{15} 1.5561.5561.556 2.1422.1422.142
9  1  18.49118.49\,\,1\,\,18.4 +58  16  8.058168.0+58\,\,16\,\,8.0 0.0970.0970.097 839.35839.35839.35 0.547x10150.547𝑥superscript10150.547x10^{15} 1.1131.1131.113 2.0772.0772.077
14  42  58.5144258.514\,\,42\,\,58.5 +55  10  55.2551055.2+55\,\,10\,\,55.2 0.1050.1050.105 435.71435.71435.71 0.111x10150.111𝑥superscript10150.111x10^{15} 0.8400.8400.840 1.0781.0781.078
8  44  36.584436.58\,\,44\,\,36.5 +29  21  12.6292112.6+29\,\,21\,\,12.6 0.0990.0990.099 505.37505.37505.37 0.171x10150.171𝑥superscript10150.171x10^{15} 0.9600.9600.960 1.2501.2501.250
10  38  1.810381.810\,\,38\,\,1.8 +41  46  25.7414625.7+41\,\,46\,\,25.7 0.1240.1240.124 567.73567.73567.73 0.289x10150.289𝑥superscript10150.289x10^{15} 1.2851.2851.285 1.4051.4051.405
14  52  33.6145233.614\,\,52\,\,33.6 +50  55  22.1505522.1+50\,\,55\,\,22.1 0.1310.1310.131 560.11560.11560.11 0.313x10150.313𝑥superscript10150.313x10^{15} 1.4301.4301.430 1.3861.3861.386
14  6  25.014625.014\,\,6\,\,25.0 +6  35  3.16353.1+6\,\,35\,\,3.1 0.1130.1130.113 477.41477.41477.41 0.239x10150.239𝑥superscript10150.239x10^{15} 1.5011.5011.501 1.1811.1811.181
12  16  49.1121649.112\,\,16\,\,49.1 3  7  55.23755.2-3\,\,7\,\,55.2 0.1110.1110.111 435.64435.64435.64 0.134x10150.134𝑥superscript10150.134x10^{15} 1.0121.0121.012 1.0781.0781.078
23  6  18.923618.923\,\,6\,\,18.9 +14  9  40.714940.7+14\,\,9\,\,40.7 0.1120.1120.112 475.07475.07475.07 0.236x10150.236𝑥superscript10150.236x10^{15} 1.5001.5001.500 1.1751.1751.17●5
1  42  25.614225.61\,\,42\,\,25.6 10  16  11.6101611.6-10\,\,16\,\,11.6 0.1120.1120.112 507.75507.75507.75 0.250x10150.250𝑥superscript10150.250x10^{15} 1.3911.3911.391 1.2561.2561.256
14  17  54.2141754.214\,\,17\,\,54.2 +43  23  17.2432317.2+43\,\,23\,\,17.2 0.1050.1050.105 430.73430.73430.73 0.168x10150.168𝑥superscript10150.168x10^{15} 1.2961.2961.296 1.0661.0661.066
13  23  48.6132348.613\,\,23\,\,48.6 +1  6  48.21648.2+1\,\,6\,\,48.2 0.1080.1080.108 668.18668.18668.18 0.369x10150.369𝑥superscript10150.369x10^{15} 1.1871.1871.187 1.6531.6531.653
8  44  21.184421.18\,\,44\,\,21.1 +51  24  21.2512421.2+51\,\,24\,\,21.2 0.0970.0970.097 496.13496.13496.13 0.186x10150.186𝑥superscript10150.186x10^{15} 1.0811.0811.081 1.2281.2281.228
11  51  10.7115110.711\,\,51\,\,10.7 3  1  41.23141.2-3\,\,1\,\,41.2 0.0910.0910.091 212.72212.72212.72 0.268x10140.268𝑥superscript10140.268x10^{14} 0.8500.8500.850 0.5260.5260.52●6
10  19  35.7101935.710\,\,19\,\,35.7 +14  2  26.514226.5+14\,\,2\,\,26.5 0.1460.1460.146 631.06631.06631.06 0.544x10150.544𝑥superscript10150.544x10^{15} 1.9591.9591.959 1.5611.5611.561
12  13  58.5121358.512\,\,13\,\,58.5 +63  13  16.0631316.0+63\,\,13\,\,16.0 0.1330.1330.133 541.44541.44541.44 0.170x10150.170𝑥superscript10150.170x10^{15} 0.8310.8310.831 1.3401.3401.340
16  20  8.216208.216\,\,20\,\,8.2 +42  30  2.942302.9+42\,\,30\,\,2.9 0.1350.1350.135 658.63658.63658.63 0.524x10150.524𝑥superscript10150.524x10^{15} 1.7321.7321.732 1.6301.6301.630
10  17  17.7101717.710\,\,17\,\,17.7 +8  40  57.784057.7+8\,\,40\,\,57.7 0.1040.1040.104 522.25522.25522.25 0.215x10150.215𝑥superscript10150.215x10^{15} 1.1311.1311.131 1.2921.2921.292
11  37  36.7113736.711\,\,37\,\,36.7 +32  26  40.6322640.6+32\,\,26\,\,40.6 0.1030.1030.103 510.52510.52510.52 0.174x10150.174𝑥superscript10150.174x10^{15} 0.9590.9590.959 1.2631.2631.263
8  28  0.98280.98\,\,28\,\,0.9 +28  15  51.8281551.8+28\,\,15\,\,51.8 0.0930.0930.093 418.11418.11418.11 0.136x10150.136𝑥superscript10150.136x10^{15} 1.1191.1191.119 1.0351.0351.035
9  16  26.791626.79\,\,16\,\,26.7 +5  55  15.255515.2+5\,\,55\,\,15.2 0.1340.1340.134 754.05754.05754.05 0.637x10150.637𝑥superscript10150.637x10^{15} 1.6061.6061.606 1.8661.8661.866
10  9  35.210935.210\,\,9\,\,35.2 +7  9  50.87950.8+7\,\,9\,\,50.8 0.0990.0990.099 425.58425.58425.58 0.131x10150.131𝑥superscript10150.131x10^{15} 1.0381.0381.038 1.0531.0531.053
11  40  9.311409.311\,\,40\,\,9.3 +32  23  20.4322320.4+32\,\,23\,\,20.4 0.1310.1310.131 818.31818.31818.31 0.852x10150.852𝑥superscript10150.852x10^{15} 1.8251.8251.825 2.0252.0252.025
23  47  55.1234755.123\,\,47\,\,55.1 +14  54  52.2145452.2+14\,\,54\,\,52.2 0.1050.1050.105 424.17424.17424.17 0.205x10150.205𝑥superscript10150.205x10^{15} 1.6301.6301.630 1.0501.0501.050
10  28  28.7102828.710\,\,28\,\,28.7 +9  38  58.693858.6+9\,\,38\,\,58.6 0.1060.1060.106 581.90581.90581.90 0.382x10150.382𝑥superscript10150.382x10^{15} 1.6191.6191.619 1.4401.4401.440
0  5  21.10521.10\,\,5\,\,21.1 +15  58  4.815584.8+15\,\,58\,\,4.8 0.1170.1170.117 541.07541.07541.07 0.430x10150.430𝑥superscript10150.430x10^{15} 2.1062.1062.106 1.3391.3391.339
9  6  49.99649.99\,\,6\,\,49.9 +4  46  45.844645.8+4\,\,46\,\,45.8 0.1260.1260.126 727.16727.16727.16 0.475x10150.475𝑥superscript10150.475x10^{15} 1.2881.2881.288 1.7991.7991.799
10  11  58.3101158.310\,\,11\,\,58.3 +33  34  15.2333415.2+33\,\,34\,\,15.2 0.1270.1270.127 631.29631.29631.29 0.349x10150.349𝑥superscript10150.349x10^{15} 1.2551.2551.255 1.5621.5621.562
9  39  9.59399.59\,\,39\,\,9.5 +37  40  1.637401.6+37\,\,40\,\,1.6 0.1480.1480.148 835.21835.21835.21 0.588x10150.588𝑥superscript10150.588x10^{15} 1.2081.2081.208 2.0672.0672.067
10  43  52.0104352.010\,\,43\,\,52.0 +1  3  42.11342.1+1\,\,3\,\,42.1 0.1170.1170.117 419.59419.59419.59 0.140x10150.140𝑥superscript10150.140x10^{15} 1.1371.1371.137 1.0381.0381.038
13  11  22.6131122.613\,\,11\,\,22.6 +48  30  45.4483045.4+48\,\,30\,\,45.4 0.1400.1400.140 807.27807.27807.27 0.970x10150.970𝑥superscript10150.970x10^{15} 2.1342.1342.134 1.9971.9971.997
3  5  59.33559.33\,\,5\,\,59.3 0  9  59.40959.4-0\,\,9\,\,59.4 0.1100.1100.110 623.76623.76623.76 0.256x10150.256𝑥superscript10150.256x10^{15} 0.9440.9440.944 1.5431.5431.543
12  10  52.2121052.212\,\,10\,\,52.2 +15  55  35.0155535.0+15\,\,55\,\,35.0 0.1070.1070.107 553.89553.89553.89 0.262x10150.262𝑥superscript10150.262x10^{15} 1.2271.2271.227 1.3711.3711.371
12  19  9.312199.312\,\,19\,\,9.3 +63  31  42.2633142.2+63\,\,31\,\,42.2 0.1070.1070.107 611.17611.17611.17 0.405x10150.405𝑥superscript10150.405x10^{15} 1.5541.5541.554 1.5121.5121.512
10  27  26.5102726.510\,\,27\,\,26.5 +37  52  37.6375237.6+37\,\,52\,\,37.6 0.1070.1070.107 403.63403.63403.63 0.163x10150.163𝑥superscript10150.163x10^{15} 1.4351.4351.435 0.9990.9990.999
9  50  53.395053.39\,\,50\,\,53.3 +28  48  15.5284815.5+28\,\,48\,\,15.5 0.1130.1130.113 810.78810.78810.78 0.837x10150.837𝑥superscript10150.837x10^{15} 1.8271.8271.827 2.0062.0062.006
12  11  9.812119.812\,\,11\,\,9.8 +6  10  49.861049.8+6\,\,10\,\,49.8 0.1380.1380.138 559.20559.20559.20 0.240x10150.240𝑥superscript10150.240x10^{15} 1.1011.1011.101 1.3841.3841.384
10  25  0.710250.710\,\,25\,\,0.7 +49  51  33.5495133.5+49\,\,51\,\,33.5 0.1350.1350.135 1120.421120.421120.42 0.153x10160.153𝑥superscript10160.153x10^{16} 1.7431.7431.743 2.7722.7722.772
14  33  39.1143339.114\,\,33\,\,39.1 +61  22  3.461223.4+61\,\,22\,\,3.4 0.1130.1130.113 618.08618.08618.08 0.446x10150.446𝑥superscript10150.446x10^{15} 1.6751.6751.675 1.5291.5291.529
11  41  15.1114115.111\,\,41\,\,15.1 +10  43  15.6104315.6+10\,\,43\,\,15.6 0.1050.1050.105 636.26636.26636.26 0.436x10150.436𝑥superscript10150.436x10^{15} 1.5451.5451.545 1.5741.5741.574
9  53  52.695352.69\,\,53\,\,52.6 +12  15  55.4121555.4+12\,\,15\,\,55.4 0.1290.1290.129 521.13521.13521.13 0.286x10150.286𝑥superscript10150.286x10^{15} 1.5081.5081.508 1.2891.2891.289
10  28  45.1102845.110\,\,28\,\,45.1 +37  52  38.3375238.3+37\,\,52\,\,38.3 0.1070.1070.107 541.02541.02541.02 0.421x10150.421𝑥superscript10150.421x10^{15} 2.0622.0622.062 1.3391.3391.339
10  10  45.3101045.310\,\,10\,\,45.3 +33  43  3.733433.7+33\,\,43\,\,3.7 0.1350.1350.135 664.31664.31664.31 0.685x10150.685𝑥superscript10150.685x10^{15} 2.2242.2242.224 1.6441.6441.644
10  21  16.9102116.910\,\,21\,\,16.9 +12  13  0.112130.1+12\,\,13\,\,0.1 0.1290.1290.129 537.06537.06537.06 0.341x10150.341𝑥superscript10150.341x10^{15} 1.6951.6951.695 1.3291.3291.329
9  46  38.194638.19\,\,46\,\,38.1 +29  42  2.229422.2+29\,\,42\,\,2.2 0.1120.1120.112 253.32253.32253.32 0.473x10140.473𝑥superscript10140.473x10^{14} 1.0571.0571.057 0.6270.6270.627
13  2  59.113259.113\,\,2\,\,59.1 +51  18  56.5511856.5+51\,\,18\,\,56.5 0.1210.1210.121 554.46554.46554.46 0.284x10150.284𝑥superscript10150.284x10^{15} 1.3231.3231.323 1.3721.3721.372
1  19  16.511916.51\,\,19\,\,16.5 +14  42  31.0144231.0+14\,\,42\,\,31.0 0.1290.1290.129 525.18525.18525.18 0.339x10150.339𝑥superscript10150.339x10^{15} 1.7601.7601.760 1.2991.2991.299
8  25  48.482548.48\,\,25\,\,48.4 +56  0  48.256048.2+56\,\,0\,\,48.2 0.1380.1380.138 648.50648.50648.50 0.350x10150.350𝑥superscript10150.350x10^{15} 1.1951.1951.195 1.6051.6051.605
13  48  19.9134819.913\,\,48\,\,19.9 +57  45  34.6574534.6+57\,\,45\,\,34.6 0.1270.1270.127 541.44541.44541.44 0.323x10150.323𝑥superscript10150.323x10^{15} 1.5821.5821.582 1.3401.3401.340
22  56  28.3225628.322\,\,56\,\,28.3 0  32  53.903253.9-0\,\,32\,\,53.9 0.1100.1100.110 430.58430.58430.58 0.123x10150.123𝑥superscript10150.123x10^{15} 0.9480.9480.948 1.0651.0651.065
7  59  41.875941.87\,\,59\,\,41.8 +28  46  55.6284655.6+28\,\,46\,\,55.6 0.1390.1390.139 503.43503.43503.43 0.177x10150.177𝑥superscript10150.177x10^{15} 0.9990.9990.999 1.2461.2461.246
14  32  22.8143222.814\,\,32\,\,22.8 +47  6  38.247638.2+47\,\,6\,\,38.2 0.1090.1090.109 311.13311.13311.13 0.698x10140.698𝑥superscript10140.698x10^{14} 1.0341.0341.034 0.7700.7700.770
11  15  16.5111516.511\,\,15\,\,16.5 +53  42  42.5534242.5+53\,\,42\,\,42.5 0.1050.1050.105 903.25903.25903.25 0.106x10160.106𝑥superscript10160.106x10^{16} 1.8671.8671.867 2.2352.2352.235
23  14  58.7231458.723\,\,14\,\,58.7 +14  5  24.414524.4+14\,\,5\,\,24.4 0.0830.0830.083 517.16517.16517.16 0.212x10150.212𝑥superscript10150.212x10^{15} 1.1351.1351.135 1.2801.2801.280
10  11  11.4101111.410\,\,11\,\,11.4 +8  41  31.984131.9+8\,\,41\,\,31.9 0.0970.0970.097 385.05385.05385.05 0.140x10150.140𝑥superscript10150.140x10^{15} 1.3571.3571.357 0.9530.9530.953
15  27  0.215270.215\,\,27\,\,0.2 +29  41  33.0294133.0+29\,\,41\,\,33.0 0.1130.1130.113 689.54689.54689.54 0.512x10150.512𝑥superscript10150.512x10^{15} 1.5431.5431.543 1.7061.7061.706
15  51  37.4155137.415\,\,51\,\,37.4 +45  33  16.2453316.2+45\,\,33\,\,16.2 0.1240.1240.124 693.77693.77693.77 0.441x10150.441𝑥superscript10150.441x10^{15} 1.3141.3141.314 1.7171.7171.717
11  19  49.4111949.411\,\,19\,\,49.4 +55  15  37.8551537.8+55\,\,15\,\,37.8 0.1060.1060.106 537.54537.54537.54 0.251x10150.251𝑥superscript10150.251x10^{15} 1.2451.2451.245 1.3301.3301.330
8  6  33.08633.08\,\,6\,\,33.0 +29  28  55.6292855.6+29\,\,28\,\,55.6 0.1280.1280.128 458.29458.29458.29 0.204x10150.204𝑥superscript10150.204x10^{15} 1.3901.3901.390 1.1341.1341.134
8  20  55.882055.88\,\,20\,\,55.8 +7  52  12.775212.7+7\,\,52\,\,12.7 0.1100.1100.110 558.19558.19558.19 0.287x10150.287𝑥superscript10150.287x10^{15} 1.3211.3211.321 1.3811.3811.381
14  14  9.814149.814\,\,14\,\,9.8 0  8  26.90826.9-0\,\,8\,\,26.9 0.1390.1390.139 1091.891091.891091.89 0.190x10160.190𝑥superscript10160.190x10^{16} 2.2802.2802.280 2.7022.7022.702
11  21  53.8112153.811\,\,21\,\,53.8 +0  41  55.004155.0+0\,\,41\,\,55.0 0.1020.1020.102 654.86654.86654.86 0.422x10150.422𝑥superscript10150.422x10^{15} 1.4101.4101.410 1.6201.6201.620
11  20  19.8112019.811\,\,20\,\,19.8 +47  4  54.547454.5+47\,\,4\,\,54.5 0.1120.1120.112 572.08572.08572.08 0.359x10150.359𝑥superscript10150.359x10^{15} 1.5701.5701.570 1.4161.4161.416
10  48  58.7104858.710\,\,48\,\,58.7 +54  53  22.9545322.9+54\,\,53\,\,22.9 0.1450.1450.145 672.72672.72672.72 0.557x10150.557𝑥superscript10150.557x10^{15} 1.7651.7651.765 1.6651.6651.665
14  59  8.514598.514\,\,59\,\,8.5 +47  19  43.0471943.0+47\,\,19\,\,43.0 0.0890.0890.089 677.50677.50677.50 0.660x10150.660𝑥superscript10150.660x10^{15} 2.0622.0622.062 1.6761.6761.676
10  27  49.7102749.710\,\,27\,\,49.7 +3  40  43.734043.7+3\,\,40\,\,43.7 0.0740.0740.074 819.40819.40819.40 0.960x10150.960𝑥superscript10150.960x10^{15} 2.0512.0512.051 2.0272.0272.027
21  29  58.2212958.221\,\,29\,\,58.2 0  19  47.601947.6-0\,\,19\,\,47.6 0.1350.1350.135 323.62323.62323.62 0.126x10150.126𝑥superscript10150.126x10^{15} 1.7211.7211.721 0.8010.8010.801
Table 6: continued.