On the metallicity gradient of the Galactic disk††thanks: Based on observations made with ESO Telescopes in La Silla Observatory under the program: 60.A-9120(B)
Abstract
Aims. The iron abundance gradient in the Galactic stellar disk provides fundamental constraints on the chemical evolution of this important Galaxy component. However the spread around the mean slope is, at fixed Galactocentric distance, larger than estimated uncertainties.
Methods. To provide quantitative constraints on these trends we adopted iron abundances for 265 classical Cepheids (more than 50% of the currently known sample) based either on high-resolution spectra or on photometric metallicity indices. Homogeneous distances were estimated using near-infrared Period-Luminosity relations. The sample covers the four disk quadrants and their Galactocentric distances range from 5 to 17 kpc. We provided a new theoretical calibration of metallicity-index-color (MIC) relation based on Walraven and NIR photometric passbands. We estimated the photometric metallicity of 124 Cepheids. Among them 66 Cepheids also have spectroscopic iron abundances and we found that the mean difference is dex. We also provide new iron abundances, based on high-resolution spectra, for four metal-rich Cepheids located in the inner disk. The remaining iron abundances are based on high-resolution spectra collected by our group (73) or available in the literature (130).
Results. A linear regression over the entire sample provides an iron gradient of -0.051 0.004 dex . The above slope agrees quite well, within the errors, with previous estimates based either on Cepheids or on open clusters covering similar Galactocentric distances. However, Cepheids located in the inner disk appear systematically more metal-rich than the mean metallicity gradient. Once we split the sample in inner (8 kpc) and outer disk Cepheids we found that the slope (-0.1300.015 dex ) in the former region is 3 times steeper than the slope in the latter one (-0.042 0.004 dex ). We found that in the outer disk the radial distribution of metal-poor (MP, dex) and metal-rich (MR) Cepheids across the four disk quadrants does not show a clear trend when moving from the innermost to the external disk regions. We also found that the relative fractions of MP and MR Cepheids in the 1st and in the 3rd quadrant differ at 8 (MP) and 15 (MR) level. Finally, we found that iron abundances in two local overdensities of the 2nd and of the 4th quadrant cover individually a range in iron abundance of 0.5 dex.
Conclusions. Current findings indicate that the recent chemical enrichment across the Galactic disk shows a clumpy distribution.
Key Words.:
Stars: abundances– Stars: distances – Cepheids1 Introduction
Abundance gradients across the Galactic stellar disk provide fundamental constraints on the chemical evolution of this Galaxy component and on the plausibility of the physical assumptions adopted in chemical evolution models (Andrievsky et al. 2004; Luck et al. 2006; Lemasle et al. 2008). Although the abundance gradients have been the cross-road of several empirical (Friel et al. 2002; Carraro et al. 2007) and theoretical (Portinari & Chiosi 1999, 2000; Chiappini et al. 2001; Cescutti et al. 2007) investigations, we still lack quantitative constraints on the observed spread in chemical composition at fixed Galactocentric distance (Luck et al. 2006; Lemasle et al. 2007). Moreover, we need to assess whether different stellar tracers give similar trends when moving from the inner to the outer disk regions. Galactic Cepheids, when compared with other tracers (open clusters, regions, -type stars, Planetary Nebulae), present several advantages to evaluate elemental abundances in the Galactic disk: i)– they are luminous and easily identified objects; ii)– they are ubiquitous across the disk; iii)– their spectra show a wealth of well defined lines, therefore, accurate abundance measurements of iron and heavy elements can be provided. The more recent estimates of iron abundance gradients based on Cepheids, provide slopes ranging from -0.05 dex (Caputo et al. 2001; Andrievsky et al. 2002b; Luck et al. 2003; Kovtyukh et al. 2005; Luck et al. 2006; Yong et al. 2006; Lemasle et al. 2007) to -0.07 dex (Lemasle et al. 2008). By using a sample of 40 open clusters located between the solar circle and kpc Friel et al. (2002) found a slope of -0.06 dex . More recently, Carraro et al. (2007) using new accurate metal abundances for five old open clusters located in the outer disk ( kpc) and the sample adopted by Friel et al. (2002) found a much shallower global iron gradient, namely -0.018 dex . By using oxygen abundances of regions, with Galactocentric distances ranging from 5 to 15 kpc, Deharveng et al. (2000) also suggest a mild slope (-0.04 dex ), but these young objects do not show evidence of a flattening of the gradient in the outer disk. Moreover, a sharp change in the metallicity gradient for kpc was suggested by Twarog et al. (1997) using 76 open cluster with distances ranging from 6 to 15 kpc. In particular, they found that a good fit of the metallicity gradient can be provided using two zones, namely an inner disk with kpc and an outer disk with kpc. The two zones are characterized by shallow slopes and by a discontinuity of -0.2 dex at kpc. This hypothesis was supported by Andrievsky et al. (2002b), Luck et al. (2003), Andrievsky et al. (2004) and by Caputo et al. (2001). However, these estimates might be hampered by the limited number of tracers close to the edge of the inner disk ( kpc) and in the outskirts of the outer disk (Lemasle et al. 2008). In this paper we investigate the Galactic metallicity gradient using a large sample of both photometric and spectroscopic Cepheid abundances.
2 Photometric and spectroscopic data
Multiband (, , , , ) Walraven photometry for 173 Galactic Cepheids was collected in several observing runs 1962 (Walraven et al. 1964) and 1970-1971 (Pel 1976, 1978) at the Leiden Southern Station (South Africa). The sample is 82% complete for all known Cepheids brighter than mag at minimum light and south of declination +15∘ (Fernie et al. 1995). For each object were collected at least 30 phase points that properly cover the entire pulsation cycle. This means that the intrinsic accuracy of the mean magnitudes determined by fitting a cubic spline is better than a few hundredths of magnitude. Note that these data were transformed into the standard Walraven system using data collected in La Silla (1979-1991, Pel & Lub 2007). Together with optical photometry we also collected for the same objects accurate multiband Near-Infra-Red (NIR) data. These data are available for 98 Cepheids of the Walraven sample. Among them, 92 were collected at SAAO (Laney & Stobie 1994, [38 objects]; van Leeuwen et al. 2007, [45 objects]; unpublished [9 objects]). The uncertainty of each phase point ranges from to for mag, deteriorating to about at mag. This implies an accuracy in the mean magnitudes of mag, depending on the number of points. However, the dominant source of uncertainty in the mean magnitudes is due to the absolute calibration and it is mag. Multiband NIR photometry for six Cepheids (V336 Aql, V600 Aql, RZ CMa, DX Gem, AY Sgr and CK Sct, Pedicelli et al. 2009 in preparation) were collected with the 1.1m telescope AZT-24 available in Campo Imperatore (Aquila). For each object we secured a dozen of random observations per band and the typical uncertainty on the mean magnitudes is mag. Note that the difference in the accuracy between optical and NIR mean magnitudes is mainly due to the difference in the luminosity amplitude. The amplitudes in the former passbands are on average 2–3 times larger than in the latter ones. The mean optical and NIR magnitudes were determinated as a time-average along the linear intensity light curve and then transformed into magnitude. The mean colors were determined as the difference of the mean magnitudes involved in the color index. The mean NIR magnitudes of the other Cepheids were estimated using the 2MASS catalog (Cutri et al. 2003) and the template light curve from Soszyński et al. (2005). The optical amplitudes and the epoch of maximum were retrieved from the Fernie catalog111http://www.astro.utoronto.ca/DDO/research/cepheids/ (Fernie et al. 1995) and from the McMaster catalog222http://crocus.physics.mcmaster.ca/Cepheid/. We compared individual reddening values provided by Fernie et al. (1995) and by Laney & Caldwell (2007) and for the objects in common we found differences of the order of a few percent. To overcome possible systematic uncertainties in the metallicity estimate, we adopted for the entire sample the reddenings provided by Fernie et al. (1995). Selective absorptions in the Walraven bands were estimated following Pedicelli et al. (2008): , and mag. Individual distances were estimated using the ,, mean magnitudes and the empirical NIR Period-Luminosity (PL) relations for fundamental (FU) Cepheids provided by Persson et al. (2004). To estimate the distance of the eight first overtone (FO) Cepheids (FF Aql, GH Car, AZ Cen, BB Cen, V419 Cen, EV Sct, AH Vel, BG Vel) in our sample their periods were fundamentalized, i.e. we added 0.127 to their logarithmic period (Pel & Lub 1978; Fernie et al. 1995; Lemasle et al. 2008). Note that the use of more recent NIR PL relations (Fouqué et al. 2007; van Leeuwen et al. 2007; Groenewegen 2008) does not affect the conclusions of this investigation (see the error bars in the top panel of Fig.3). Selective absorptions in the -bands were estimated using the reddening law by Cardelli et al. (1989). We adopted an LMC true distance modulus of 18.50 mag (Freedman et al. 2001) and the heliocentric distances were estimated as the mean of the three distances in , , and band. The typical standard deviation for the mean distance modulus is smaller than 0.1 mag.
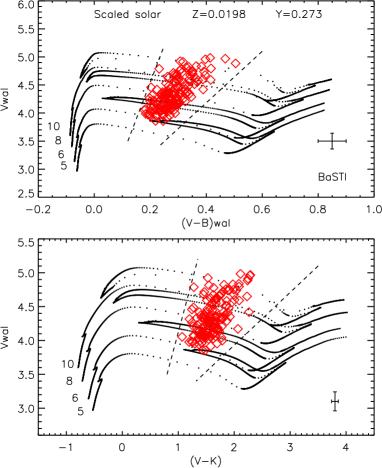
In order to validate current estimates of reddenings and distance moduli we compared theory and observations using scaled solar evolutionary tracks from the BaSTI database333http://albione.oa-teramo.inaf.it/index.html (Pietrinferni et al. 2004, 2006). Therefore, theoretical predictions were transformed into the Walraven bands using the bolometric corrections and the color-temperature relations provided by Castelli & Kurucz (2003). Fig. 1 shows the comparison between theory and observations for the Walraven ,-bands (top panel) and for optical-NIR ,-bands (bottom panel). The error bars in the right corner account for uncertainties on the mean reddening correction (5%) and on the absolute distance (sum in quadrature of the intrinsic dispersions of the NIR PL relations provided by Persson et al. (2004) and on the mean NIR meagnitudes). The solid lines display evolutionary tracks at solar chemical composition (metals, Z=0.0198; helium, Y=0.273) and mass values ranging from 5 to 10 . The dashed lines display the predicted FO blue edge (hotter) and the FU red edge (cooler) of the Cepheid instability strip (Bono et al. 2005) at solar chemical composition. Data plotted in this figure indicate that evolutionary and pulsation predictions agree quite well with observations. This outcome applies to both faint (short period) and bright (long period) Cepheids.
The spectroscopic data set includes: ten Cepheids from Romaniello et al. (2008), 63 from Lemasle et al. (2008, 2007), six from Sziládi et al. (2007), eight from Luck et al. (2006) and 116 from Andrievsky et al. (2002a, b, c). These data were complemented with accurate iron abundances for four inner disk Cepheids (AV Sgr; V340 Ara; VY Sgr; UZ Sct). A more detailed discussion concerning photometric and spectroscopic data for these four Cepheids will be given in a forthcoming paper (Pedicelli et al. 2009, in preparation). We found accurate iron abundances for 77 out of the 173 Walraven Cepheids. Among them we selected the Cepheids with a reddening E(B-V)0.8 mag (66 objects).
3 Calibration of the Metallicity–Index–Color relation
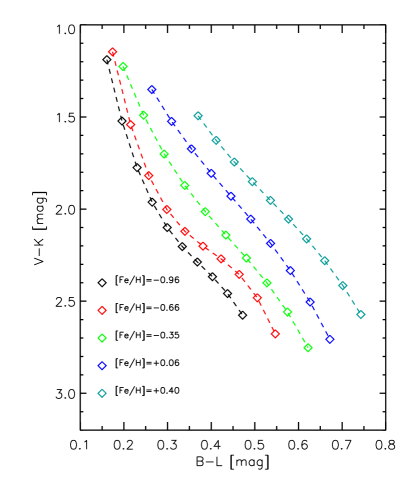
The spectroscopic data set does not allow us to provide a new empirical calibration of the Metallicity–Index–Color (MIC) relation for the Walraven bands, since the range in metallicity covered by these objects is quite limited (-0.4 0.3 dex). To overcome this limitation we adopted several sets of evolutionary models characterized by different chemical compositions (Z=0.002, Y=0.248; Z=0.004, Y=0.251; Z=0.008, Y=0.256; Z=0.0198, Y=0.2734; Z=0.04, Y=0.303) and stellar masses ranging from 5.0 to 10.0 (see Fig.2). The evolutionary tracks were computed by adopting a helium-to-metal enrichment ratio of . For each evolutionary track we selected the helium burning phases (2nd and 3rd crossing) falling inside the predicted edges of the instability strip (Bono et al. 2000, 2005). We performed several sets of multilinear regressions between metal abundance and two independent Walraven, optical and NIR color indices. Eventually, we found the strongest sensitivity to metal abundance when using the Walraven and the optical-NIR color (see Fig.2). The former color presents for warm stars a strong sensitivity to the metal content (Pel & Lub 2007), whereas the latter has a strong sensitivity to the effective temperature (Bono et al. 2005).
In particular, we performed a polynomial fit of the colors of helium burning phases for the different stellar masses and at fixed chemical composition (see dashed lines in Fig.2). To improve the intrinsic accuracy of the MIC relation we uniformly sampled the polynomial fits (see diamonds in Fig.2) and adopted these points in the multi-linear regression. The theoretical MIC relations we derived can be parameterized as follows:
| (1) |
where the symbols have the usual meaning and the number in parentheses are the uncertainties on the coefficients. By adopting this relation, we estimated the iron content for the entire Walraven data set. Interestingly enough, we found that the mean difference between photometric and spectroscopic iron abundances, for the 66 Cepheids for which the spectroscopic iron abundance is available, is as small as = -0.03 dex and the intrinsic dispersion is within photometric and spectroscopic uncertainties ( 0.15 dex).
4 Galactic metallicity gradient
In order to estimate the Galactic iron gradient the Galactocentric distances were determined by assuming for the Sun a Galactocentric distance of 8.5 kpc (Feast & Whitelock 1997) and the classical formula for the Galactocentric distances (Lemasle et al. 2007).
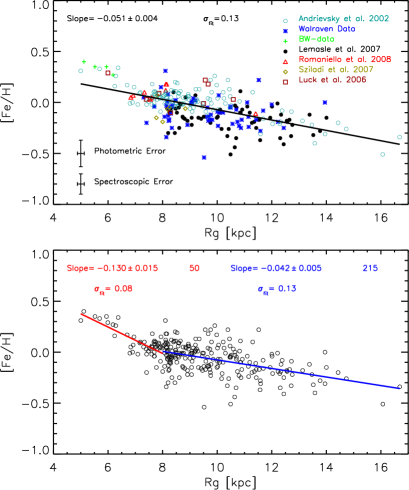
Together with the spectroscopic sample (207, see §2) we adopted 58 new metallicity estimates based on the theoretical MIC relation and we ended up with a sample of 265 Cepheids, i.e. more than 50% of the Galactic Cepheids currently known (Fernie et al. 1995). The top panel of Fig. 3 shows the radial distribution of the entire sample. In particular, the green crosses display the four metal-rich Cepheids for which we have new accurate abundances and new Baade-Wesselink distances, the photometric metallicities are marked with blue asterisks, while the spectroscopic abundances are marked with cyan open circles, Andrievsky et al. (2002a, b, c); black filled circles, Lemasle et al. (2008); red triangles, Romaniello et al. (2008); yellow diamonds, Sziládi et al. (2007); purple squares, Luck et al. (2006). A glance at the data plotted in this panel shows that spectroscopic and photometric metallicities present similar trends. A linear fit over the entire sample gives an iron abundance gradient with a slope of -0.0510.004 dex . This estimate agrees quite well with the most recent literature values based either on Cepheids (Lemasle et al. 2008, -0.0520.003) or on open clusters (Friel et al. 2002, -0.060.01). However, the linear fit plotted in the top panel of Fig. 3 is systematically more metal-poor than observed iron abundances in the innermost disk regions (7 kpc). By using open clusters Twarog et al. (1997) suggested the occurrence of a sharp discontinuity in the metallicity gradient at 10 kpc, while Carraro et al. (2007) found evidence of a flattening in the outer disk. The occurrence of a discontinuity in the outer disk was also supported by Luck et al. (2003) and by Andrievsky et al. (2002b, 2004) using Cepheids. On the other hand, the occurrence of a steepening of the metallicity gradient in the inner disk was suggested by Andrievsky et al. (2002b) using Cepheids. Data plotted in the top panel of Fig. 3 do not support the presence of a discontinuity for 10-12 kpc. This finding is in agreement with the results of Lemasle et al. (2008). Instead, current data show a smooth and steady increase in the slope for 8 kpc. Therefore, we split the Cepheids according to their Galactocentric distance in an inner ( 8 kpc, 50) and in an outer (215) subsample. The bottom panel of Fig. 3 shows that the iron gradient in the inner disk is more than a factor of three steeper (-0.1300.015 dex , =0.08 dex, red line) than the slope in the outer disk (-0.0420.004 dex , =0.13 dex, blue line). In passing, we also note that the current linear fits indicate an iron abundance of 0.3 dex in the innermost disk regions and of -0.3 dex in the outermost disk regions. The difference (0.6 dex) and the flattening of the gradient in the outer disk are still hampered by the limited number of Cepheids in this crucial region.
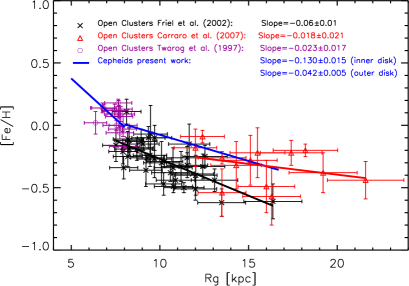
Fig. 4 shows the comparison between the current iron abundance gradients and similar gradients based on open clusters provided by Twarog et al. (1997, purple dots), by Friel et al. (2002, black dots) and by Carraro et al. (2007, red dots). Note that to avoid the crowding between the different samples of open clusters, for the Twarog et al. sample we only plotted the clusters with 8 kpc. Data plotted in this figure show that the Cepheid slope for the outer disk agrees, within the errors, quite well with the slope estimated by Friel et al. (2002), while it appears steeper than the slope estimated by Carraro et al. (2007). The difference in slope is due to a difference in the Galactocentric distribution of the adopted tracers. The flattening in the slope by Carraro et al. (2007) is mainly based on four open clusters with 17 kpc. Unfortunately, we still lack accurate iron abundances for Cepheids located at large Galactocentric distances. The comparison also indicates that in the inner disk the slope based on Cepheids is significantly steeper (-0.13 vs -0.018 dex kpc-1) than the slope based on open cluster collected by Twarog et al. (1997). The outcome is the same if we only account for open clusters with 8 kpc, i.e. -0.13 vs -0.073 dex kpc-1. We cannot reach a firm conclusion concerning the difference between the two different slopes, since the Twarog’s sample includes only one cluster with 6.5 kpc. Finally, we mention that the difference, at fixed Galactocentric distance, between Cepheid and open cluster abundances could be partially due either to a difference in the metallicity scale or to an age effect. The first problem might be addressed using Galactic cluster Cepheids (Fry & Carney 1997), but we still lack firm quantitative constraints. The open clusters in the Friel’s sample cover a broad age range (0.8 – 9 Gyr), while Cepheids are young He-burning stars and their ages using the Period-Age relation provided by Bono et al. (2005) range from 10 to 130 Myr. Empirical evidence (Friel et al. 2002) and theoretical predictions (Portinari & Chiosi 1999, 2000) indicate that the iron gradient flattens as a function of decreasing age. However, firm quantitative constraints on this effect require homogeneous estimates of distances and iron abundances for the two different tracers.
5 Discussion and conclusions
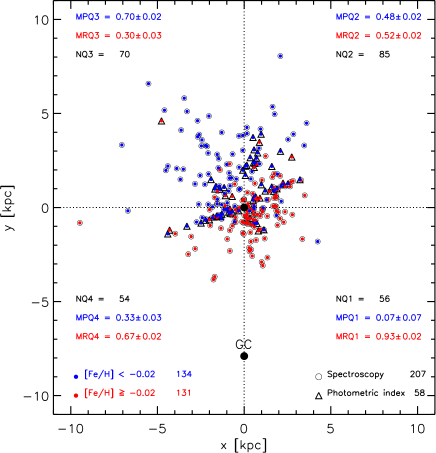
The data plotted in Fig.3 show a significant spread in metallicity at fixed Galactocentric distance. A similar evidence was brought forward by Luck et al. (2006) and confirmed by Lemasle et al. (2008). The former authors, using spectroscopic iron abundances for 205 Cepheids, found evidence of abundance inhomogeneities across the disk. In particular, they found a group of stars approaching supersolar iron abundances (+0.2 dex) for 9.5-10 kpc. The latter authors, using spectroscopic iron abundances for 178 Cepheids, found that the spread in metallicity for 10-12 kpc was strongly correlated with the Galactic longitude (see their Figures 5 and 10). In order to analyze quantitatively the available metallicity data for Cepheids, we performed several tests by selecting the Cepheids either according to their age (period cuts) or to the height above the Galactic plane. The spread in iron content was minimally affected by these selections. Therefore, we projected the positions of our 265 Cepheids onto the Galactic plane. The data plotted in Fig.5 show that our sample covers the four Galactic quadrants quite well. The relative fractions per quadrant are: 21.10.8% (Q1), 32.10.7% (Q2), 26.40.7% (Q3) and 21.40.8% (Q4). The errors on the relative fractions only account for Poisson uncertainties. Moreover, to constrain their radial distribution across the Galactic disk we split the Cepheids in a metal-poor (MP, ) and in a metal-rich (MR, ) subsample with similar number of objects (134 vs 131). The blue (MP) and the red (MR) dots plotted in Fig.5 disclose several interesting features:
-
•
Metallicity Distribution – The metallicity distribution in the four quadrants does not show a smooth trend when moving from the innermost to the outermost disk regions. We found that in the first quadrant the bulk of Cepheids is MR (%), while in the fourth quadrant the relative fractions are % (MR) and % (MP), respectively. Note that the errors on the relative fractions only account for Poisson uncertainty. The asymmetry in the metallicity distribution is also present in the top quadrants. The second quadrant shows, within the errors, similar fractions of MP (%) and MR (%) Cepheids, while in the third quadrant a significant fraction of Cepheids are MP (%) and less than one third are MR (%). Our findings do not indicate a strong asymmetry in the metallicity distribution between bottom and top quadrants, but an asymmetry between the first and the third quadrant. The difference is at more than 8 level for the MP and more than 15 level for the MR subsample.
-
•
Local Inhomogeneities – Abundance inhomogeneities occur not only at level of quadrants, but also on smaller spatial scales. The iron abundance of the Cepheids belonging to the two overdensities located in the second (X2, Y1 kpc) and in the fourth quadrant (X-1.5, Y-0.5 kpc) ranges from -0.20 to 0.25 dex and from -0.30 to 0.20 dex, respectively. This means that in these regions the Cepheids approximately cover the same range in metallicity covered by the global gradient.
-
•
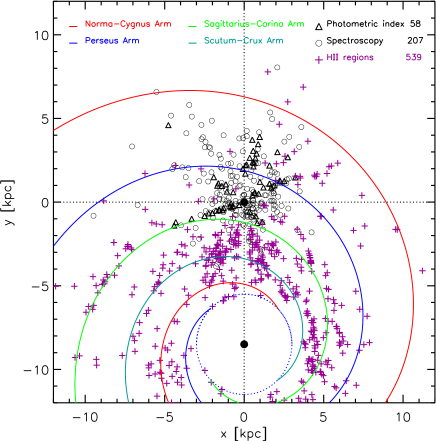
Spatial Distribution – The Cepheid spatial distribution across the disk is reminiscent of Galactic spiral arms. After the seminal investigations by Kraft & Schmidt (1963) it has been recently suggested by Luck et al. (2006) that the overdensity they detected in the second quadrant (at and at about 3 kpc from the Sun) is located in the same region of the Perseus arm. To analyze the correlation between the spatial distribution of Cepheids and spiral arms across the Galactic plane we plotted in Fig.6 Cepheids together with regions collected by Paladini et al. (2004). Note that kinematic distances of regions might be affected by systematic uncertainties (Reid et al. 2009). Moreover, to help the identification with the spiral arms we also plotted the four arms according to the simple Galactic model of Vallée (2005). Note that no general consensus has been reached yet concerning the number of spiral arms, the pitch angles and the number of warps (Reid et al. 2009, and references therein). The arms plotted in Fig.6 are only aimed at a preliminary qualitative correlation. The data plotted in this figure further support the association of the overdensity located at X2, Y1 kpc (second quadrant) with the Perseus arm. Moreover, the overdensity in the fourth quadrant (X-1.5, Y-0.5 kpc) covers more than 2 kpc and it appears to be associated with a group of regions and with the Sagittarius-Carina arm. The small overdensity located in the first quadrant (X0.5, Y-1.0 kpc) is associated with an overdensity of regions located between the Sagittarius-Carina and the Scutum-Crux arm. In the third quadrant (X-2.5, Y3.5 kpc) and in the first quadrant are also present two overdensities, but the number of regions is either limited or missing.
The above findings support recent findings by Luck et al. (2006) and by Lemasle et al. (2007) concerning the occurrence of chemical inhomogeneities across the Galactic quadrants. Moreover and even more importantly, Cepheid abundances indicate that these inhomogeneities are also present at smaller spatial scales. This means that the global abundance gradients should be cautiously treated, since empirical evidence indicates a chemical enrichment with a clumpy distribution across the Galactic disk.
The use of Classical Cepheids not only to trace the chemical enrichment across the disk, but also to constrain together with open clusters, regions and star forming regions its chemical tagging (De Silva et al. 2007) appears particularly promising. The use of homogeneous metallicity scales for field and cluster stars (Yong et al. 2005, 2006; Bragaglia et al. 2009) and homologous distance scales (Fouqué et al. 2007; Groenewegen 2008) should also be explored further. The comparison of metallicity gradients based on different stellar tracers and robust constraints on the age dependence of the metallicity gradient rely on these two relevant requirements.
Acknowledgements.
It is a real pleasure to thank S. Paladini for sending us the data on regions in electronic form. We also thank C. Chiosi and P. Prada Moroni for many useful discussions on Galactic chemical evolution and on Galactic models. One of us (SP) thanks ESO for the PhD studentship. This publication makes use of data from the Two Micron All Sky Survey, which is a joint project of the University of Massachusetts and the Infrared Processing and Analysis Center/California Institute of Technology, funded by the National Aeronautics and Space Administration and the National Science Foundation. We also thank the ESO Science Archive for their prompt support and the anonymous referee for his/her positive opinion concerning the content of this investigation.References
- Andrievsky et al. (2002a) Andrievsky, S. M., Kovtyukh, V. V., Luck, R. E., et al. 2002a, A&A, 381, 32
- Andrievsky et al. (2002b) Andrievsky, S. M., Kovtyukh, V. V., Luck, R. E., et al. 2002b, A&A, 392, 491
- Andrievsky et al. (2004) Andrievsky, S. M., Luck, R. E., Martin, P., & Lépine, J. R. D. 2004, A&A, 413, 159
- Bono et al. (2000) Bono, G., Caputo, F., Cassisi, S., et al. 2000, ApJ, 543, 955
- Bono et al. (2005) Bono, G., Marconi, M., Cassisi, S., et al. 2005, ApJ, 621, 966
- Bragaglia et al. (2009) Bragaglia, A., Carretta, E., Gratton, R., & Tosi, M. 2009, in IAU Symposium, Vol. 254, IAU Symposium, ed. J. Andersen, J. Bland-Hawthorn, & B. Nordström, 227–232
- Caputo et al. (2001) Caputo, F., Marconi, M., Musella, I., & Pont, F. 2001, A&A, 372, 544
- Cardelli et al. (1989) Cardelli, J. A., Clayton, G. C., & Mathis, J. S. 1989, ApJ, 345, 245
- Carraro et al. (2007) Carraro, G., Geisler, D., Villanova, S., Frinchaboy, P. M., & Majewski, S. R. 2007, A&A, 476, 217
- Castelli & Kurucz (2003) Castelli, F. & Kurucz, R. L. 2003, in IAU Symposium, Vol. 210, Modelling of Stellar Atmospheres, ed. N. Piskunov, W. W. Weiss, & D. F. Gray, 20P–+
- Cescutti et al. (2007) Cescutti, G., Matteucci, F., François, P., & Chiappini, C. 2007, A&A, 462, 943
- Chiappini et al. (2001) Chiappini, C., Matteucci, F., & Romano, D. 2001, ApJ, 554, 1044
- Cutri et al. (2003) Cutri, R. M., Skrutskie, M. F., van Dyk, S., et al. 2003, 2MASS All Sky Catalog of point sources. (The IRSA 2MASS All-Sky Point Source Catalog, NASA/IPAC Infrared Science Archive. http://irsa.ipac.caltech.edu/applications/Gator/)
- De Silva et al. (2007) De Silva, G. M., Freeman, K. C., Asplund, M., et al. 2007, AJ, 133, 1161
- Deharveng et al. (2000) Deharveng, L., Peña, M., Caplan, J., & Costero, R. 2000, MNRAS, 311, 329
- Feast & Whitelock (1997) Feast, M. & Whitelock, P. 1997, MNRAS, 291, 683
- Fernie et al. (1995) Fernie, J. D., Evans, N. R., Beattie, B., & Seager, S. 1995, Information Bulletin on Variable Stars, 4148, 1
- Fouqué et al. (2007) Fouqué, P., Arriagada, P., Storm, J., et al. 2007, A&A, 476, 73
- Freedman et al. (2001) Freedman, W. L., Madore, B. F., Gibson, B. K., et al. 2001, ApJ, 553, 47
- Friel et al. (2002) Friel, E. D., Janes, K. A., Tavarez, M., et al. 2002, AJ, 124, 2693
- Fry & Carney (1997) Fry, A. M. & Carney, B. W. 1997, AJ, 113, 1073
- Groenewegen (2008) Groenewegen, M. A. T. 2008, A&A, 488, 25
- Kovtyukh et al. (2005) Kovtyukh, V. V., Wallerstein, G., & Andrievsky, S. M. 2005, PASP, 117, 1173
- Kraft & Schmidt (1963) Kraft, R. P. & Schmidt, M. 1963, ApJ, 137, 249
- Laney & Caldwell (2007) Laney, C. D. & Caldwell, J. A. R. 2007, MNRAS, 377, 147
- Lemasle et al. (2007) Lemasle, B., François, P., Bono, G., et al. 2007, A&A, 467, 283
- Lemasle et al. (2008) Lemasle, B., François, P., Piersimoni, A., et al. 2008, A&A, 490, 613
- Luck et al. (2003) Luck, R. E., Gieren, W. P., Andrievsky, S. M., et al. 2003, A&A, 401, 939
- Luck et al. (2006) Luck, R. E., Kovtyukh, V. V., & Andrievsky, S. M. 2006, AJ, 132, 902
- Paladini et al. (2004) Paladini, R., Davies, R. D., & DeZotti, G. 2004, MNRAS, 347, 237
- Pedicelli et al. (2008) Pedicelli, S., Lub, J., Pel, J. W., et al. 2008, Memorie della Societa Astronomica Italiana, 79, 539
- Pel (1976) Pel, J. W. 1976, A&AS, 24, 413
- Pel (1978) Pel, J. W. 1978, A&A, 62, 75
- Pel & Lub (1978) Pel, J. W. & Lub, J. 1978, in IAU Symposium, Vol. 80, The HR Diagram - The 100th Anniversary of Henry Norris Russell, ed. A. G. D. Philip & D. S. Hayes, 229–236
- Pel & Lub (2007) Pel, J. W. & Lub, J. 2007, in Astronomical Society of the Pacific Conference Series, Vol. 364, The Future of Photometric, Spectrophotometric and Polarimetric Standardization, ed. C. Sterken, 63–+
- Persson et al. (2004) Persson, S. E., Madore, B. F., Krzemiński, W., et al. 2004, AJ, 128, 2239
- Pietrinferni et al. (2004) Pietrinferni, A., Cassisi, S., Salaris, M., & Castelli, F. 2004, ApJ, 612, 168
- Pietrinferni et al. (2006) Pietrinferni, A., Cassisi, S., Salaris, M., & Castelli, F. 2006, ApJ, 642, 797
- Portinari & Chiosi (1999) Portinari, L. & Chiosi, C. 1999, A&A, 350, 827
- Portinari & Chiosi (2000) Portinari, L. & Chiosi, C. 2000, A&A, 355, 929
- Reid et al. (2009) Reid, M. J., Menten, K. M., Zheng, X. W., et al. 2009, ArXiv e-prints
- Romaniello et al. (2008) Romaniello, M., Primas, F., Mottini, M., et al. 2008, A&A, 488, 731
- Soszyński et al. (2005) Soszyński, I., Gieren, W., & Pietrzyński, G. 2005, PASP, 117, 823
- Sziládi et al. (2007) Sziládi, K., Vinkó, J., Poretti, E., Szabados, L., & Kun, M. 2007, A&A, 473, 579
- Twarog et al. (1997) Twarog, B. A., Ashman, K. M., & Anthony-Twarog, B. J. 1997, AJ, 114, 2556
- Vallée (2005) Vallée, J. P. 2005, AJ, 130, 569
- van Leeuwen et al. (2007) van Leeuwen, F., Feast, M. W., Whitelock, P. A., & Laney, C. D. 2007, MNRAS, 379, 723
- Walraven et al. (1964) Walraven, J. H., Tinbergen, J., & Walraven, T. 1964, Bull. Astron. Inst. Netherlands, 17, 520
- Yong et al. (2005) Yong, D., Carney, B. W., & Teixera de Almeida, M. L. 2005, AJ, 130, 597
- Yong et al. (2006) Yong, D., Carney, B. W., Teixera de Almeida, M. L., & Pohl, B. L. 2006, AJ, 131, 2256