Very deep spectroscopy of the Coma cluster line of sight: exploring new territories ††thanks: Based on observations collected at the European Organisation for Astronomical Research in the Southern Hemisphere, Chile (program: 081.A-0172). Also based on observations obtained with MegaPrime/MegaCam, a joint project of CFHT and CEA/DAPNIA, at the Canada-France-Hawaii Telescope (CFHT) which is operated by the National Research Council (NRC) of Canada, the Institut National des Sciences de l’Univers of the Centre National de la Recherche Scientifique (CNRS) of France, and the University of Hawaii. This work is also partly based on data products produced at TERAPIX and the Canadian Astronomy Data Centre as part of the Canada-France-Hawaii Telescope Legacy Survey, a collaborative project of NRC and CNRS.
Abstract
Context. Environmental effects are known to have an important influence on cluster galaxies, but studies at very faint magnitudes (R) are almost exclusively based on imaging. We present here a very deep spectroscopic survey of galaxies on the line of sight to the Coma cluster.
Aims. After a series of papers based on deep multi–band imaging of the Coma cluster, we explore spectroscopically part of the central regions of Coma, in order to confirm and generalize previous results, concerning in particular the galaxy luminosity function, red sequence, stellar populations and the most likely formation scenario for the Coma cluster.
Methods. We have obtained reliable VIMOS redshifts for 715 galaxies in the direction of the Coma cluster centre in the unprecedented magnitude range R, corresponding to the absolute magnitude range .
Results. We confirm the substructures previously identified in Coma by Adami et al. (2005a), and identify three new substructures. We detect a large number of groups behind Coma, in particular a large structure at z0.5, the SDSS Great Wall, and a large and very young previously unknown structure at z0.054, which we named the background massive group (BMG). These structures account for the mass maps derived from a recent weak lensing analysis by Gavazzi et al. (2009). The orbits of dwarf galaxies are probably anisotropic and radial, and could originate from field galaxies radially falling into the cluster along the numerous cosmological filaments surrounding Coma. Spectral characteristics of Coma dwarf galaxies show that red or absorption line galaxies have larger stellar masses and are older than blue or emission line galaxies. R22 galaxies show less prominent absorption lines than R22 galaxies. This trend is less clear for field galaxies which are similar to R22 Coma galaxies. This suggests that part of the faint Coma galaxies could have been recently injected from the field following the NGC 4911 group infall. We present a list of five Ultra Compact Dwarf galaxy candidates which need to be confirmed with high spatial resolution imaging with the HST. We also globally confirm spectroscopically our previous results concerning the galaxy luminosity functions based on imaging down to R=23 () and find that dwarf galaxies follow a red sequence similar to that drawn by bright Coma galaxies.
Conclusions. Spectroscopy of faint galaxies in Coma confirms that dwarf galaxies are very abundant in this cluster, and that they are partly field galaxies that have fallen onto the cluster along cosmological filaments.
Key Words.:
galaxies: clusters: individual (Coma)1 Introduction
On the pathway toward the use of galaxy clusters to constrain cosmology, one must understand how clusters and their galaxy populations evolve. Until very recently, galaxy evolution in clusters was well constrained only down to relatively bright magnitudes (R20 for z0 clusters). However, according to Cold Dark Matter models of hierarchical structure formation (e.g. White Rees 1978, White Frenk 1991), there should be abundant low-mass dark-matter dominated halos present in the Universe and these halos should therefore contain low luminosity galaxies. It is therefore important to sample the faint and very faint cluster galaxy populations. Moreover, in galaxy clusters, these faint galaxies are of major interest as their evolutionary paths are sometimes different from those of bright galaxies: they are very sensitive to environmental effects and can be created via interactions of larger galaxies (e.g. Bournaud et al. 2003). They also keep their dynamical memory longer (e.g. Sarazin 1986), and as a consequence their spatial distribution can possibly be different from that of bright galaxies (e.g. Biviano et al. 1996). With the arrival of large field cameras on medium size telescopes, we started to reach the faint and very faint galaxy regime. Our team concentrated on the Coma cluster (Adami et al. 2005a,b, 2006a,b, 2007a,b, 2008, 2009a,b, Gavazzi et al. 2009, and http://cencosw.oamp.fr/COMA/). This cluster is relatively nearby and this facilitated early searches (e.g. Wolf 1901, see Biviano 1998 and reference therein, and for recent studies, see e.g. Andreon Cuillandre 2002, Beijersbergen et al. 2002, Iglesias-Páramo et al. 2003, Jenkins et al. 2007, Lobo et al. 1997, Milne et al. 2007, Smith et al. 2008, Terlevich et al. 2001, Trentham 1998). Using CFH12K and Megacam data we now have a pretty good statistical view of the faintest galaxies existing in the Coma cluster (M). However, this view is “only” statistical and we only have a rough idea of the behaviour of individual galaxies at these magnitudes. Our previous spectroscopic catalog limit (despite the fact that it gathered most of the literature data available at that time, see Adami et al. 2005a) was far too bright even to begin investigating these faint populations. Besides, the precision on photometric redshifts is far too low to allow any dynamical analysis or spectroscopic characterisation.
In order to fill this gap, we have obtained deep (21R23) VIMOS/VLT spectroscopy and performed the spectroscopic characterisation of these faint Coma cluster galaxy populations.
We describe our new spectroscopic and literature data in Sections 2 and 3. We then present in Section 4 the analysis of the Coma line of sight in terms of detected groups and substructures. We derive the dynamical behaviour of the Coma cluster galaxies in Section 5 and describe the spectral characteristics of the Coma cluster galaxies in Section 6. In Section 7, we build an Ultra Compact Dwarf galaxy candidate catalog. We discuss in Section 8 the luminosity function and color-magnitude-relation of the Coma cluster galaxies. Finally, we summarize our results in Section 9, giving a comprehensive picture of the Coma cluster.
In this paper we assume H0 = 70 km s-1 Mpc-1, =0.3, =0.7, a distance to Coma of 100 Mpc, a distance modulus of 35.00, and a scale of 0.47 kpc arcsec-1. All coordinates are given at the J2000 equinox.
2 VIMOS spectroscopy
2.1 Settings
Selecting targets on the basis of new photometric redshifts computed using deep u*BVRI images, we observed three VIMOS fields in the Coma cluster in order to spectroscopically characterize the faint cluster population and to sample the cluster at unprecedented magnitudes of R23.
We obtained 1000 spectra of faint Coma line of sight galaxies (R[21,23]) using the VLT/VIMOS instrument in 2008 with exposure times of 2 hours, split into five 24 minutes individual exposures. Despite the very unfavourable declination of Coma at the VLT latitude, we were able to observe three masks at airmasses close to 1.7, with a seeing of the order of 1.2 arcsec (the relatively long exposure times for R23 galaxies compensating for the high airmass). The targets were partly selected on a photometric redshift basis (following Adami et al. 2008) and partly randomly in order to increase the number of targets.
Since our aim was to obtain low resolution spectra of very faint nearby galaxies, we used the LR-Blue grism (5.3 Å/pix), providing a S/N between 2 and 5, depending on the galaxy characteristics. Given the redshift range of interest (Coma is at z0.023), it allowed us to efficiently sample emission lines from [OII]3727 to H.
We chose to observe strategically located regions of the Coma cluster (see Fig. 1), where infalling material has been detected (as described in Adami et al. 2005a): the west infalling galaxy layer and substructures close to NGC 4911.
We obtained a reliable redshift (reliability flag 2, see the following) for 715 objects. Among these, slightly less than 100 galaxies are part of the Coma cluster. The minimum number of galaxies expected inside the Coma cluster given the target selection was 70, so our results are in good agreement with our predictions.
2.2 Data reduction
The spectra were extracted using the VIPGI package (Scodeggio et al. 2005), which was extensively used for the VIMOS VLT Deep Survey (VVDS) data (e.g. Le Fèvre et al. 2005). This package (VIMOS Interactive Pipeline and Graphical Interface: VIPGI), is a new software designed to simplify to a very high degree the task of reducing astronomical data obtained with VIMOS (Visible MultiObject Spectrograph). The final product was the wavelength-calibrated 1D spectra of our targets.
Due to the fact that our observations were made at high airmasses, differential refraction was not negligible. However, the level of spectra physical curvature on the CCDs remained modest and was easily compensated by a linear function to define the extraction area. The slope of the linear function was visually adjusted for each quadrant.
We then adopted the same strategy as for the VVDS. Each spectrum was examined independently by two of us (CA and VLB) and redshifts were proposed using well known cross-correlation techniques such as the IRAF package or the VVDS tool (as well as VIPGI-included line gaussian fitting when possible). Finally, the different redshift determinations were compared and a final list was established, including quality flags.
When a redshift determination was possible, it was flagged with a number between 1 and 9, following the VVDS conventions (e.g. Le Fèvre et al. 2004) and indicating the reliability level of the measurement. Flags 2, 3, 4 are the most secure, flag 1 is an indicative measurement based on few supporting features, and flag 9 indicates that there is only one secure emission line corresponding to the listed redshift. Le Fèvre et al. (2005) have shown with repeated observations that these flags correspond to the following probabilities of finding the correct redshift: 55 for flag 1, 81 for flag 2, 97 for flag 3, and 99.5 for flag 4. Given these numbers we simply chose to ignore all objects with flag 1.
We also gave a second integer flag between 0 and 3 (spectral flag): 0 for absorption line only spectra, 1 for spectra showing both emission and absorption lines, 2 for spectra showing only emission lines, and 3 for active objects (i.e. showing broad band emission lines or very strong Balmer lines as compared to oxygen lines).
We finally note that our spectra are not photometrically calibrated.
2.3 VIMOS spectroscopic sample
Table 1 gives the basic details of the spectroscopic VIMOS observations. Out of the 926 slits, 833 objects provided a spectrum with a tentative redshift measure. Among these 833, 118 were flagged with a reliability flag of 1, 298 with a reliability flag of 2, 187 with a reliability flag of 3, 187 with a reliability flag of 4, and 43 with a reliability flag of 9.
After excluding objects with a reliability flag equal to 1, we were left with 715 galaxies, out of which 250 had a spectral flag of 0, 288 a spectral flag of 1, 168 a spectral flag of 2, and 9 a spectral flag of 3.
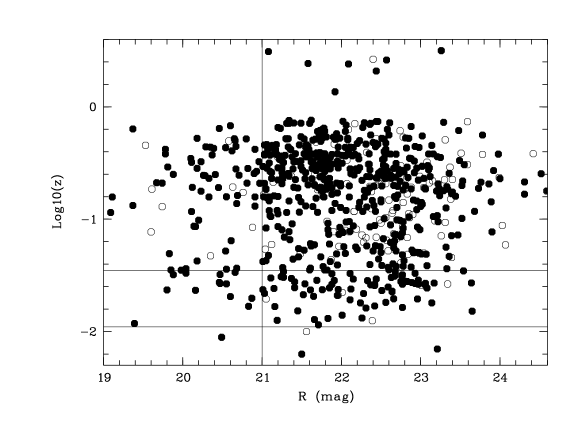
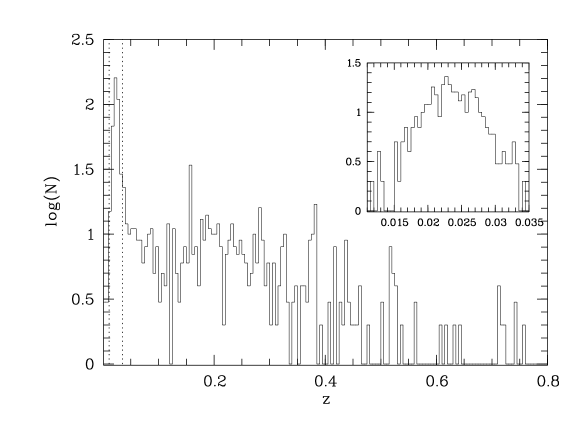
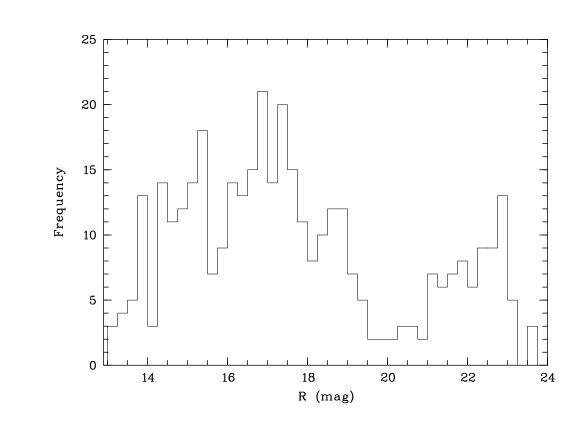
Figs. 2, 3, and 4 give a general idea of the properties of the sample: distribution of the redshifts as a function of the R-band magnitudes, redshift histogram, and magnitude histogram.
| field number | N | Exp. time | ||
|---|---|---|---|---|
| (deg) | (deg) | (s) | ||
| 1 | 194.72 | 27.87 | 322 | 7200 |
| 2 | 194.69 | 28.14 | 298 | 7184 |
| 3 | 195.04 | 27.72 | 306 | 7098 |
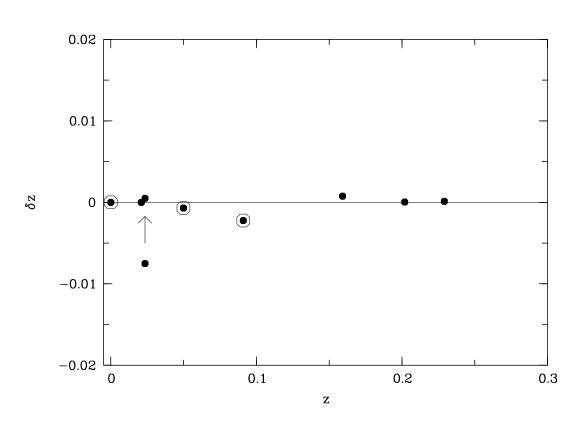
We also investigated the velocity uncertainty resulting from our measurements. With a similar instrumental configuration, Le Fèvre et al. (2005) estimated the redshift uncertainty to be of the order of 280 km/s from repeated VVDS redshift measurements. We did the same exercise by considering the literature redshifts included in our VIMOS sample (6 galaxies between R=17 and 19.8) or observed twice during our spectroscopic run (3 galaxies between R=20.8 and 23), and with a reliability flag strictly greater than 1. Given the reliability flags, we expect to have 8 galaxies over 9 providing a good agreement. In practice, 7 show a good agreement. One galaxy has a 0.008 difference in redshift, but checking the literature spectrum (from the SDSS survey) and applying our redshift measurement methods, we estimate a redshift similar to the one we obtained from our own spectrum of the same galaxy (the SDSS automated measure pipeline misinterpreted the edge of an absorption line as an emission line).
For another galaxy there is a strong redshift discrepancy between our measurement and that of the literature. However, our spectrum corresponds to a flag 4 (z=0.1468) galaxy with strong emission lines, whereas the spectrum from the literature is not available for inspection, making our present determination more reliable than the previous one. Fig. 5 shows the resulting redshift comparison, corresponding to a statistical uncertainty of 196 km/s, slightly lower than the VVDS estimate. We also show in this graph the galaxies observed twice in our spectroscopic runs. Despite the low statistics, these objects do not seem to show a different behaviour compared to brighter objects in the literature.
3 Complementary data
3.1 Spectroscopic data from the literature
A spectroscopic catalog based on data taken from the literature was compiled by one of us (RT) from the NED and SDSS (including up to DR6) databases. We extracted from this catalog all galaxies in our VIMOS region which are not already present in our VIMOS data. We also added a few new redshifts from the SDSS DR7. The resulting literature catalog is therefore more complete than the one we used in Adami et al. (2005a). These additional data were included in Figs. 2, 3, and 4. Fig. 3 shows the Coma cluster itself plus several structures along the line of sight for example at z0.16, 0.38, or 0.52. Fig. 4 shows the magnitude gap between spectroscopic data from the literature and our new VIMOS spectroscopic data. This gap has no consequences on most of the following analyses which are based on R21 objects. We have however to bear in mind the magnitude distribution of the spectroscopic sample when discussing about possible structures along the line of sight.
3.2 u*, B, V, R and I band CFHT imaging data
The B, V, R, and I data are fully described in Adami et al. (2006a). We give here only the salient points. A mosaic of two fields was observed with the CFH12K camera in four bands (B, V, R and I) covering a 5242 arcmin2 field. The total field is approximately centered on the two dominant cluster galaxies (NGC 4874 and NGC 4889). We derived total Kron Vega magnitudes (Kron 1980) from these images. The completeness level in R is close to R24. The seeing conditions were all close to 1 arcsec. All these imaging data are available at http://cencosw.oamp.fr.
The u* data including the previous field are described in Adami et al. (2008). They were obtained between 2006 and 2007 with the CFH Megacam camera in a field of view of 1 deg2 with an average seeing of 1.1 arcsec. The total exposure time was 9.66 hours. We derived total Kron AB magnitudes from this image. Fig. 2 shows a subarea of the total u* image.
These data therefore provide a catalog of objects in the u*, B, V, R and I bands complete down to R24.
4 Groups along the Coma cluster line of sight from the spectroscopic sample
We now present our analysis of the groups found along the Coma line of sight.
First, we have to define the boundaries of the Coma cluster in terms of velocity. From Adami et al. (1998), we know that the Coma cluster galaxy velocity dispersion increases with decreasing luminosity, as expected from dynamical considerations. A natural way to fix cluster boundaries is to limit the cluster velocity range within . Assuming the mean for the faintest galaxies in Adami et al. (1998) (1200 km/s for R17.5), we limit the cluster to the redshift range [0.011;0.035].
Second, in order to determine galaxy orbits, we limit the spectroscopic sample to the areas where photometric redshifts are also available (in order to be able to compute a density profile on the photometric redshift basis). Finally we restrict the magnitude range of the spectroscopic sample to the R=[21,23] range where the sampling rate is the most homogeneous.
In order to search for galaxy groups along the Coma cluster line of sight, we applied the Serna-Gerbal (SG hereafter: Serna Gerbal 1996) method to our total redshift catalogue (VIMOS + literature). This hierarchical method was already applied in one of our early studies (Adami et al. 2005a) and we refer the reader to this paper for more details. Briefly, it allows galaxy subgroups to be extracted from a catalogue containing positions, magnitudes, and redshifts, based on the calculation of their relative (negative) binding energies. Note that this calculation takes into account the mass to luminosity ratio chosen by the user as an a priori input value of the ratio in the structure. The group mass derived later is estimated from the group binding energy and velocity dispersion, and does not depend upon M/L, which proves empirically (e.g. Covone et al. 2006) to act mainly as a contrast criterion. Results do not depend strongly on this factor, since a variation of a factor of two in this parameter does not change significantly the results. Qualitatively, low input values of M/L allow us to detect structures with low binding energies, while high values of M/L only allow the detection of the major structures.
The output of the SG method is a list of galaxies belonging to each group, as well as information on the binding energy and mass of the group itself. We will consider here that a group consists of at least 3 members.
We use a nominal M/L ratio in the R band of 400, and we also search for less strongly linked galaxy groups inside the Coma cluster and inside the z0.5 large scale structure (see the following) assuming lower M/L ratios of 100.
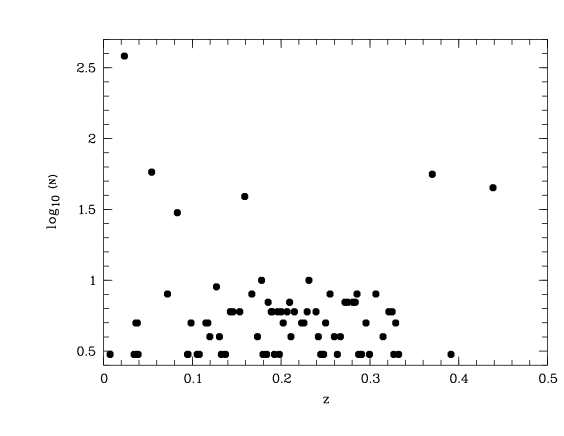
The SG method reveals the existence of 76 “groups” along the line of sight (assuming M/L=400), including the Coma cluster itself. Among them, 52 groups have members, and 44 groups have members. In Fig. 6 we show the log10(N) versus redshift for the 76 groups. There is no relation between N and the group redshifts.
The main caveat of this analysis is that we do not have a complete spectroscopic catalog. We will dedicate the following section to this point.
4.1 Sampling of the total spectroscopic catalog
In order to find all the structures along the Coma cluster line of sight, the SG method would require the galaxy catalogue to be 100 complete, which is obviously never the case. The detection efficiency depends on the completeness of the spectroscopic catalog and we must therefore analyze this completeness in the zone that we considered. For this, we use our CFHT R-band photometric catalog (http://cencosw.oamp.fr/). We pixelize the VIMOS field in several subregions of 0.20.2 deg2 and compute the percentage of objects with a redshift available in our spectroscopic catalog (VIMOS + literature), as a function of R band magnitude. Fig. 7 gives the sampling rate in the VIMOS area for several magnitude ranges.
4.2 Substructures in the Coma cluster
Assuming an M/L of 400, well adapted to find highly gravitationally bound structures, we detect the Coma cluster as a single structure (z0.0234 sampled with 382 redshifts), along with a minor additional substructure (sampled in spectroscopy by only 3 galaxies).
We then investigate how the main detected structure can be split in several substructures. For this, we redo the same SG analysis using this time a M/L ratio of 100. Results are shown in Fig. 8. We essentially confirm in the considered area the results of Adami et al. (2005a), and detect 7 subtructures. Three are directly linked with NGC 4874 (G1 of Adami et al. 2005a). A fourth one (undetected in Adami et al. 2005a) is detected north of NGC 4874 and coincides with the northern part of the west X-ray substructures of Neumann et al. (2003). The last three are detected south of NGC 4874. One of them is along the NGC 4839 infalling path, and coincides with the G8/G9 groups (see Table 2 and Fig. 4 in Adami et al. 2005a), while the last two were not detected in Adami et al. (2005a). These three groups also seem to be visible in the Okabe et al. weak lensing study (private communication) and are included in the south-west mass extension detected by Gavazzi et al. (2009), who used the same photometric data as in the present paper.
4.3 Structures at z0.2 not belonging to Coma
Besides the Coma cluster substructures, we are more specifically interested in the z0.2 structures because they cannot be efficiently removed from the background using only photometric redshift techniques (see Adami et al. 2008).
We give in Fig. 8 and in Table 2 the locations and characteristics of the z0.2 structures, excluding the structures which are members of the Coma cluster.
| N | Tentative mass | redshift | ||
| (2000.0) | (2000.0) | (if virialized) | ||
| (deg) | (deg) | (M) | ||
| 194.9867 | 27.77410 | 3 | 6.67E+13 | 0.0074 |
| 194.7974 | 27.93770 | 5 | 3.9E+12 | 0.0364 |
| 194.8937 | 27.81673 | 3 | 2.0E+12 | 0.0373 |
| 194.7462 | 27.87338 | 5 | 2E+10 | 0.0381 |
| 194.8206 | 27.95107 | 58 | 2.73E+15 | 0.0542 |
| 194.8296 | 27.84444 | 8 | 1.27E+14 | 0.0720 |
| 194.8266 | 27.95877 | 30 | 1.88E+14 | 0.0831 |
| 194.8543 | 27.92563 | 3 | 1.8E+12 | 0.0945 |
| 194.7782 | 28.16868 | 5 | 7E+11 | 0.0986 |
| 194.7517 | 28.17983 | 3 | 5E+11 | 0.0952 |
| 194.9777 | 27.78710 | 3 | 7.2E+12 | 0.1054 |
| 194.8250 | 27.90883 | 3 | 6E+11 | 0.1078 |
| 194.7706 | 27.82888 | 5 | 8.8E+12 | 0.1153 |
| 194.7916 | 27.89518 | 5 | 5.3E+12 | 0.1175 |
| 194.7713 | 27.94355 | 4 | 1.6E+12 | 0.1197 |
| 194.8791 | 27.85061 | 9 | 1.19E+13 | 0.1272 |
| 194.8550 | 27.92140 | 4 | 1.86E+13 | 0.1305 |
| 194.6917 | 27.89147 | 3 | 1E+08 | 0.1326 |
| 194.8280 | 27.82573 | 3 | 4.18E+13 | 0.1374 |
| 194.8205 | 28.02470 | 6 | 8.23E+13 | 0.1427 |
| 195.0567 | 27.73113 | 6 | 1.9E+12 | 0.1458 |
| 194.7197 | 28.09023 | 6 | 3.7E+12 | 0.1534 |
| 194.7230 | 27.89113 | 39 | 8.5E+12 | 0.1590 |
| 194.7263 | 27.99955 | 4 | 8.13E+13 | 0.1734 |
| 194.9545 | 27.85410 | 10 | 2.7E+12 | 0.1780 |
| 194.8757 | 27.91133 | 3 | 1.1E+12 | 0.1796 |
| 195.0393 | 27.76123 | 3 | 3E+10 | 0.1838 |
| 194.9579 | 27.83376 | 7 | 4.68E+13 | 0.1854 |
| 194.8118 | 27.89033 | 6 | 3E+11 | 0.1888 |
| 194.8523 | 28.01927 | 6 | 2.3E+12 | 0.1900 |
| 194.6847 | 27.93407 | 3 | 8E+11 | 0.1925 |
| N | Tentative mass | redshift | ||
| (2000.0) | (2000.0) | (if virialized) | ||
| (deg) | (deg) | (M) | ||
| 194.9353 | 27.83393 | 3 | 3.85E+11 | 0.0117 |
| 194.8504 | 27.96517 | 7 | 4.83E+10 | 0.0128 |
| 194.8732 | 27.95258 | 9 | 2.83E+12 | 0.0162 |
| 194.6830 | 27.84417 | 4 | 2.49E+12 | 0.0193 |
| 194.8887 | 27.95417 | 3 | 1.17E+12 | 0.0236 |
| 194.7610 | 28.15490 | 3 | 1.36E+13 | 0.0283 |
| 194.8395 | 27.82490 | 4 | 5.08E+12 | 0.0342 |
We immediately notice a concentration of structures in a small zone south-west of NGC 4874, which we will call the Putative Filament Area (PFA) in the following, while other parts of the spectroscopic area only present a sparse distribution of z0.2 background groups. The location of these detections cannot be explained by the spectroscopic incompleteness (see Fig. 7) alone. Even if not uniform, this sampling is not preferentially high in the PFA.
Part of the detected groups are included in the SDSS Great Wall (Gott et al. 2005) and are coincident with the PFA, confirming the existence of a complex structure between z0.07 and 0.085. We also detect a new large galaxy structure at z0.054 (the Background Massive Group, or BMG hereafter). This structure, undetected with SDSS data alone, is mainly populated by faint galaxies and is very rich (sampled with 58 spectroscopic redshifts). It is probably not virialized because applying the virial theorem would lead to a mass of 2.7 1015M⊙. Such a major mass concentration would evidently show up in X-rays, and nothing is detected by Neumann et al. (2003) at this location.
This does not mean that this structure has a negligible mass however, and it could significantly contribute to the mass concentration detected with a weak lensing analysis by Gavazzi et al. (2009) at the same location (see Fig. 8). If we define the PFA as centered at =194.772, =27.914 and enclosed in a circle of 5.5’ radius, we can estimate a mass from the Gavazzi et al. (2009) weak lensing analysis of (4.2 0.8) 1013 M⊙ (if at z=0.023), or 2 1013 M⊙ (if at z=0.055). The Adami et al. (2005a) G8 and G9 Coma substructures are probably contributing to the PFA mass detected by weak lensing. However, G8 and G9 are not detected in X-rays and their maximum mass can be inferred to be 0.5 1013 M⊙, the lowest mass Coma substructure emitting in X-rays (the group attached to NGC 4911, see Neumann et al. 2003). Groups G8 and G9 can therefore account for 25 of the PFA estimated mass. The 75% remaining could then come from the z0.054 BMG structure, leading to a mass of the order of M⊙. This mass is high enough to justify the qualification of massive, but small enough to justify the undetected X-ray emission. The large difference of this mass estimate with the virial one clearly argues in favor of an unvirialized structure. With a crossing time of 2.9 108 years at z=0.054, this places the BMG structure in a very early evolutionary stage.
Several other smaller structures are detected between z=0.035 and 0.2 in the PFA. This leads us to suspect the existence of a (minor) line of sight filament joining the Coma cluster and the new z0.054 large galaxy structure, and then extending toward the SDSS Great Wall and beyond.
Such a high level of structures in the immediate background vicinity of the Coma cluster could have a significant effect on the cluster luminosity function determinations in this region, estimated for example from statistical arguments (see Adami et al. 2007a,b), because a significant part of these nearby background groups were not detected in this early study. We will therefore determine in the following a luminosity function only based on our spectroscopic data.
We note that most of these structures (e.g. the BMG or the SDSS Great Wall) do not prominently appear in Fig. 3 because they are not fully virialized and therefore their redshift distribution is not very compact.
4.4 Sampling the Coma back-infalling galaxy layers: nature of galaxy haloes
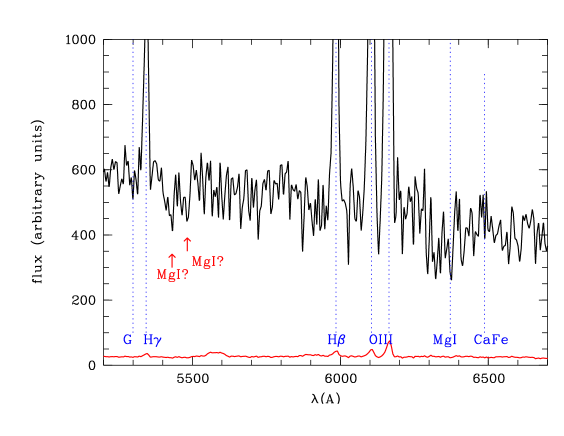
Our spectroscopic sample contains a number of active objects, which can be used to study the foreground gaseous clouds through the absorption features that imprint the spectrum (e.g. Ledoux et al. 1999). This method has led to the discovery of extended halos around field galaxies (e.g. Bergeron Boissé 1991) and of the intergalactic medium (the well known Lyman-alpha forest, see e.g. Croft et al. 2002, for a detailed review), and has allowed to study the internal regions of high redshift galaxies (through the so-called Damped Lyman-alpha systems, see Khare et al. 2007). We tried to detect the gaseous regions just behind the Coma cluster with the same method. However the case is particular, because of the very low redshift of Coma and of the wavelength range of our spectroscopic observations, which impedes us from using high-redshift background targets, since it would have been impossible to disentangle blue restframe wavelength lines at high redshift from redder restframe wavelength lines at low redshift. We therefore looked for low redshift (z0.25) active objects in our spectroscopic data. At those redshifts, the only strong absorption lines that could arise from gaseous halos or interstellar medium, and be detectable in our spectra are MgI and Ca H&K. Other usual absorption lines like MgII or CIV have rest frame wavelengths in the UV, and are not detectable in the optical part of a low redshift spectrum. One object is suitable for our study at a redhift of 0.2312 and located spatially close to the BMG. The spectrum of this VIMOS object is displayed in Fig. 9 and is probably a Seyfert 2 galaxy.
As can be seen on the magnified part of the VIMOS spectrum, there is an unidentified double-line, shortward of the intrinsic MgI line. The respective equivalent widths are 2.8 and 2.5 Å, and the detection levels are . The absorption redshifts correspond to z0.0496 and 0.0595, just behind the Coma cluster and very close to the mean redshift of the BMG structure discussed in Section 4.3. The only possible identification is MgI, as any other identification would either lead to a negative redshift or to a redshift higher than that of the active object. However, MgI is a low ionization line, which arises only in low temperature haloes around field galaxies, and definitely not in high temperature intracluster gas. This therefore suggests that the BMG intrastructure medium does not have a high temperature, consistent with its supposedly unvirialized dynamical status.
We have searched for galaxies located within 100 kpc of the line of sight to the VIMOS active object, as this corresponds to the measured size of low ionization haloes around field galaxies (Fig. 10). There is a galaxy at redshift 0.0482, located kpc away from the active object, plus several galaxies potentially at z0.2 (from photometric redshift estimates by Adami et al. 2008). Given that probably most field galaxies are surrounded by a gaseous halo of radius 90 kpc (Kacprzak et al. 2007) we suggest that one or more of these galaxies (part of the BMG structure) also has its own halo. The intrastructure medium of the BMG therefore allows a gaseous halo to survive in at least one of these galaxies. This is in good agreement with the early evolutionary stage of the BMG.
4.5 Structures at z0.5
In order to characterize the vicinity of the z0.5 galaxy structure detected in Adami et al. (1998 and 2000), we are also interested by the structures near that redshift. Assuming an M/L ratio of 100, we find with the SG method a very extended structure (covering the whole field of view) at z0.52 and sampled with 29 spectroscopic redshifts (Fig. 11), which we do not detect with an M/L ratio of 400. A more concentrated structure is found inside this galaxy layer (sampled with 6 galaxies), located on top of the Adami et al. (1998 and 2000) cluster candidate at z0.52. We therefore have a z0.52 compact structure of galaxies in this zone. We cannot estimate a robust mass because of the low sampling. However, the fact that we detect this structure neither in the weak lensing mass map of Gavazzi et al. (2009) nor in the X-ray maps of Neumann et al. (2003) and Forman et al. (private communication) does not speak in favor of a very massive structure.
5 Galaxy orbits
It is important to characterize the orbits of faint galaxies in Coma as this is a powerful tool to put constraints on their origin. While bright galaxy orbits are relatively well known in clusters (e.g. Biviano Katgert 2004), nothing is known about the orbits of faint dwarf galaxies. We will select in the following all galaxies with magnitudes between R=21 and 23 and having a measured spectroscopic redshift . We assume as a first guess that the dwarf galaxy population is homogeneous in order to perform the Jeans analysis.
5.1 Jeans analysis
In order to determine the orbits of a population of galaxies in a cluster, we need three ingredients:
-
•
the mass profile of the cluster, , where is the 3-D distance from the cluster center;
-
•
the projected number density profile of the galaxies, , where is the projected distance from the cluster center;
-
•
the line-of-sight velocity dispersion profile of the galaxies .
We choose to take from the literature, scaling all parameters to the presently assumed cosmology. Geller et al. (1999) have applied the caustic technique to determine the mass profile of the Coma cluster out to large radii. This technique is claimed to provide a cluster mass profile with little dependence on the assumed orbital velocity anisotropy. They have fit the mass profile with a NFW model with concentration and mass . Another study by Łokas & Mamon (2003) gives for the dark matter profile and a total mass at the virial radius of . These are not very different from the Geller et al. estimates, and support our initial choice.
In both Geller et al.’s and Łokas & Mamon’s analyses, the Coma cluster center is taken to be the position of NGC 4874. Since we base our analysis on their mass profile, we must consistently assume the same center throughout our analysis (i.e. also for and ).
We then consider the value of given by Geller et al. to define the scaling radius and the scaling velocity , so that we can work in the space of normalized radii ( in projection), and velocities , where are the line-of-sight velocities with respect to the cluster mean velocity, corrected for the cosmological term, , where we have taken km s-1 from Geller et al.
We have checked that if we take Łokas and Mamon’s value for instead of Geller et al.’s, the results of the Jeans analysis are essentially unchanged.
In order to compute one must be aware of the problems due to incompleteness. One cannot use the sample of spectroscopically confirmed members, since it is only poorly complete. We therefore consider here the sample of dwarfs whose membership is based on their photometric redshift . We computed a binned by counting galaxies within circular annuli and dividing these counts by the effective area, i.e. the total area of annuli excluding the masked regions (defined in Adami et al. 2006a). The resulting is shown in Fig. 12.

We fit with a core model profile, , with three free parameters. Note that does not enter the Jeans equation solution (it cancels away), so the effective number of interesting parameters is two. The best fit obtained with , and is shown in Fig. 12. Clearly, the density of dwarf galaxies is almost constant with (at least in this central region).

For the determination of we consider the spectroscopic sample. We do not need to care about incompleteness, as long as the velocity dispersion is independent of the galaxy magnitude. This is likely to be the case since dwarf galaxies are very low-mass objects and the timescale of dynamical friction needed to slow down such light objects is beyond the Hubble time in a cluster like Coma. We then determine for the galaxies in circular annuli. The resulting binned profile is shown in Fig. 13.

5.2 Results
We are now in the position of solving the Jeans equation. Ideally, we could perform this analysis splitting our sample in several spectromorphological types, but the statistics are too low for this purpose. We note however that our sample is dominated by absorption line galaxies (with or without emission lines) and by relatively red objects (75 of the considered sample is redder than the 2- lower bound of the Color Magnitude Red Sequence, see Fig. 23). Our results will therefore mainly apply to red dwarf galaxies.
Given and we search for the constant value of that provides the best-fit to , where and are respectively the tangential and radial components of the velocity dispersion. A constant model should be adequate here given that the sampled region does not extend over a wide radial range. We prefer to express the results in terms of . The best fit is given by , significantly different from the isotropic case . This can be seen in Fig. 14.
Should we force isotropy with , we would obtain an unacceptable solution. On the other hand, should we force isotropy and let the concentration of the mass profile free to vary, we would obtain marginally acceptable solutions (90% confidence level) but only for very low concentrations, , which are excluded by all analyses of the mass profiles not only of Coma, but of any galaxy cluster.
We can therefore conclude that dwarf galaxies in Coma have radially anisotropic orbits even close to the cluster center. This is at variance with any other type of galaxies (Biviano and Katgert 2004). Late-type galaxies do move along radially elongated orbits but far from the center. It is tempting to interpret these results in evolutionary terms.
Dwarf galaxies could be the remnants of those galaxies that fall into Coma with radial orbits. Their radial orbits drove them very near the cluster center where they were morphologically transformed by some physical mechanism that is effective only near the center (e.g. tidal effects related to the cluster potential). Galaxies that we still see today as giant spirals would then be those that did not pass very near the Coma center and so managed to survive. Hence their orbits cannot be radially strongly elongated in the central regions (or their pericenters would be small).
Unfortunately, these results depend on the solution for . The density profile is not well determined because it is only well known near the cluster center. We have tried to assess the systematics by forcing the slope of the core model to the value , which corresponds to the traditional King model (King 1962). The fit is still acceptable, with a larger core radius than before, (see Fig. 14). Using this new and the same as before, we obtain a best-fit constant anisotropy solution of the Jeans equation (see Figs. 12 and 14). This solution is consistent with the one previously found, but is also (marginally) consistent with isotropy.
With the current data-set, we have marginally significant evidence that the dwarf galaxies follow radially anisotropic orbits near the center of Coma. Extending the photometric data-set to larger radii would be very useful to better constrain the number density profile slope, which seems to play a critical rôle in the solution of the Jeans equation.
Moreover, if we arbitrarily split the dwarf galaxy sample in two parts (below and above R=22.3) a puzzling behaviour appears: dwarf galaxies with R22.3 have a mean velocity of 6721350 km/s, while dwarf galaxies with R22.3 have a mean velocity of 7846272 km/s. The two values appear quite different and a Kolmogorov-Smirnov test leads to a 93 probability that the two velocity distributions (below and above R=22.3) are different. The fainter sample has a mean velocity equivalent to that of the G4 group of Adami et al. (2005a: not sampled by the VIMOS data). This group is related to the giant galaxy NGC 4911, so we could expect to have the R22.3 dwarf galaxies spatially correlated with the position of NGC 4911. However, this is not the case: a Kolmogorov-Smirnov test does not show any evidence for a different spatial distribution between the two samples of galaxies. An explanation would be that the NGC 4911 group is losing its faint galaxy population along its trajectory, spreading this population all over the Coma cluster.
The velocity dispersions of the two samples are less different: galaxies with R22.3 have 1516 km/s and galaxies with R22.3 have 1942 km/s, higher than the value computed in Adami et al. (1998) of 1200 km/s for R17.5. This is not surprising as we deal here with very low mass objects, for which dynamical relaxation mechanisms are very inefficient in removing initial energy and then in reducing the velocity dispersion.
6 Galaxy spectral characteristics
| Class | N | log(age yr) | |
|---|---|---|---|
| Coma blue | 15 | 9.13 | 6.21 |
| Coma red | 11 | 9.78 | 6.93 |
| Coma RS | 25 | 9.53 | 6.66 |
| Coma non X | 36 | 9.51 | 6.64 |
| Coma X | 28 | 9.46 | 6.50 |
| Coma LSB | 7 | 9.48 | 6.62 |
| Coma abs | 31 | 9.51 | 6.66 |
| Coma abs R22 | 15 | 9.41 | 6.39 |
| Coma abs R22 | 16 | 9.63 | 7.07 |
| Coma em+abs | 26 | 9.45 | 6.45 |
| Coma em+abs R22 | 18 | 9.47 | 6.39 |
| Coma em+abs R22 | 8 | 9.46 | 6.93 |
| Coma em | 4 | 9.17 | 6.48 |
| Non Coma abs | 44 | 9.48 | / |
| Non Coma abs R22 | 31 | 9.50 | / |
| Non Coma abs R22 | 13 | 9.29 | / |
| Non Coma em+abs | 39 | 9.12 | / |
| Non Coma em+abs R22 | 25 | 9.20 | / |
| Non Coma em+abs R22 | 14 | 9.07 | / |
| Non Coma em | 4 | 9.05 | / |
| Non Coma LSB | 4 | 9.76 | / |
6.1 Method
We have produced stacked spectra by computing a weighted mean of the individual clean spectra available, using the -band magnitude as a weight. We measured spectral indices from these stacked spectra and fit them, together with the stacked spectral energy distributions in the bands, with a library of stellar population models. The absorption indices which were used in the fit are Lick_G4300, Lick_Mgb, Lick_Fe5270, Lick_NaD, BH_G, and BH_Mgg. We also used the 4000 Å break: Dn4000.
The fit was performed in a bayesian approach, namely we computed for each stack the probability distribution function (hereafter PDF) of each desired parameter, given an input library of 100 000 models with uniform coverage in their physical parameters (see Salim et al. 2005, Walcher et al. 2008, Lamareille et al. 2009). These models include in particular complex star formation histories. The IMF is that of Chabrier (2003).
We thus derived for each stack the age of the oldest stellar populations, the stellar mass, the dust attenuation, and the stellar metallicity.
6.2 Properties of Coma cluster dwarf galaxies as a function of color: red, blue, and red-sequence galaxies.
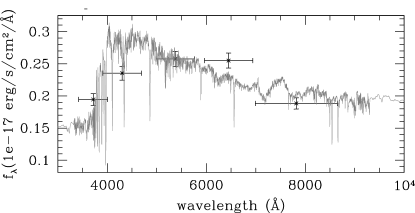
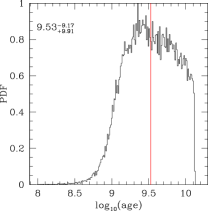
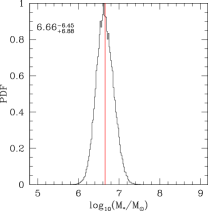
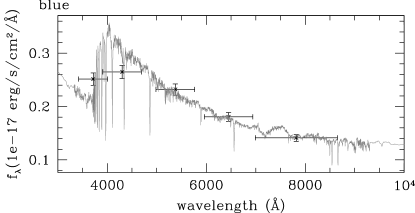
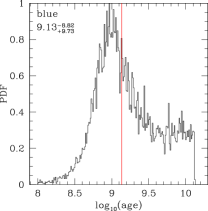
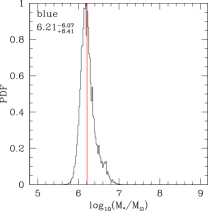
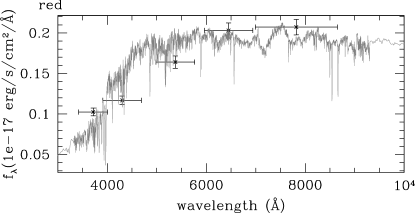
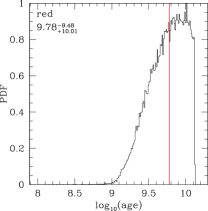
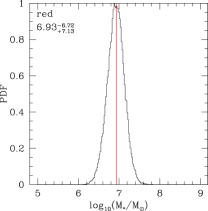
In this analysis we consider three different classes of dwarf galaxies: red galaxies, red-sequence galaxies, and blue galaxies (see section 7.2). Fig. 15 shows the spectral energy distributions and the mean stellar population model for these classes: red-sequence population, blue galaxies, and red galaxies. This figure also shows the PDF for the ages of the oldest stellar populations and the stellar masses.
From blue to red sequence, to red galaxies respectively, the ages of the Coma cluster dwarf galaxies range from to 9.53 and 9.78. The blue galaxies therefore seem to have a young stellar population (1.3 Gyrs) while red galaxies appear to be older objects (6 Gyrs). The stellar masses range from to 6.66 and 6.93. Red galaxies are therefore more massive (regarding their stellar mass) than blue galaxies. We find here for faint dwarf galaxies the same well known tendencies observed for giant galaxies.
Dust attenuation and stellar metallicity do not vary significantly and are not given in Table 4. Metallicities are compatible with solar values, in good agreement with the assumption of Adami et al. (2009b).
6.3 Comparison with non-Coma cluster dwarf galaxies

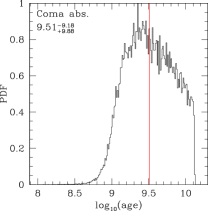
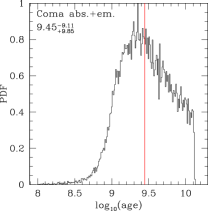
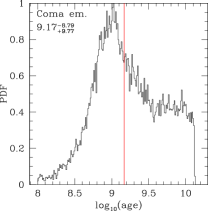
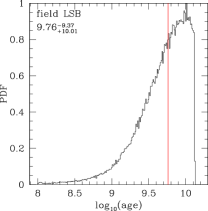
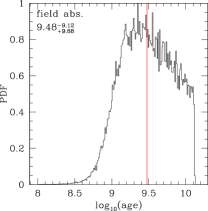
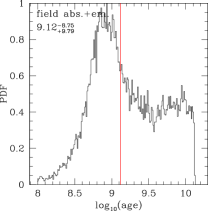
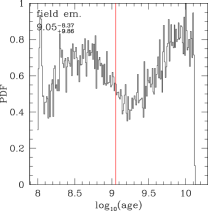
In this analysis, we classify our dwarf galaxies in four different classes: low surface brightness galaxies, absorption-line galaxies, absorption- plus emission-line galaxies, emission-line galaxies. These correspond to the Coma LSB, Coma abs, Coma em+abs, and Coma em lines in Table 4 for the Coma cluster and to Non Coma LSB, Non Coma abs, Non Coma em+abs, and Non Coma em lines in Table 4 for the z0.1 non-Coma cluster galaxies. These galaxies act as a comparison sample, not being subject to the strong influence of the Coma cluster and being at sufficiently low redshift not to exhibit strong evolutionary effects. Fig. 16 shows the PDF for the ages of the oldest stellar populations for these four classes (from left to right) and for galaxies inside and outside the Coma cluster (top to bottom). We observe two trends. First, dwarf galaxies show decreasing mean ages from absorption-line to emission-line galaxies. We note that this trend is also associated with decreasing stellar masses. Second, the Coma cluster dwarf galaxies seem on average older than field dwarf galaxies, even if this trend is not significant. Conversely, low surface brightness galaxies seem to follow the opposite trend: they are barely-significantly older outside the Coma cluster than inside it, where they have ages similar to absorption-line galaxies. There is no significant evidence of an age trend, although, taken at face value, the mean ages would indicate a different origin for at least part of the LSBs in the field and in the Coma cluster. This would be in good agreement with an interaction-induced origin for part of the Coma LSBs (see e.g. Adami et al. 2009b).
Finally, it is interesting to note that the metallicity of the Coma intracluster medium is 0.2 (Strigari et al. 2008), clearly less metal–rich than the dwarf galaxies considered here.
6.4 Influence of the intracluster medium: X-ray substructures.
We check in this section if the intracluster medium X-ray substructures have an influence on the faint Coma dwarf galaxies (R21). Galaxies inside X-ray substructures of Neumann et al. (2003: line in Table 4) and outside of these substructures ( line in Table 4) have very similar properties without any significant differences given our uncertainties. This suggests that whichever influence the cluster substructures may have on the faint dwarf galaxies, this does not occur via the hot gas attached to these substructures.
6.5 Magnitude versus spectral properties
We investigate in this section the possible relation between galaxy magnitudes and their spectral properties within the main magnitude range covered by the VIMOS data (R=[22,23]).
Splitting our Coma sample into R22 (the Coma abs R22, and Coma em+abs R22 lines in Table 4) and R22 (the Coma abs R22, and Coma em+abs R22 lines in Table 4), we show that the ages of galaxies of a given class (pure emission, emission-absorption, or pure absorption spectral features) are independent of their luminosities. Faint and bright galaxies have very similar ages for a given class (pure emission, emission-absorption, or pure absorption spectral features).
Not surprisingly, pure absorption line R22 galaxies have smaller stellar masses than pure absorption line R22 galaxies . We have the same tendency for R22 and R22 emission-absorption galaxies. There is no clear correlation between the stellar mass (expressed in terms of magnitude) and the age.
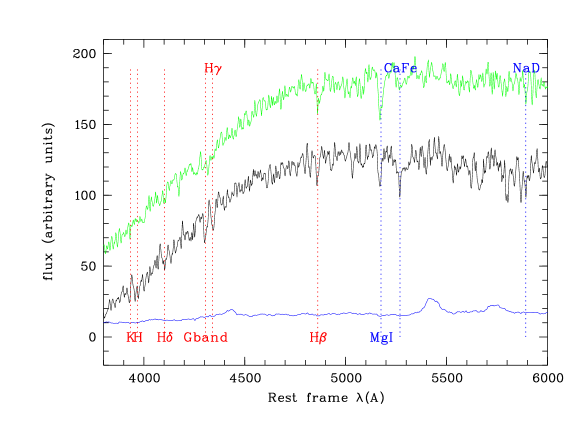
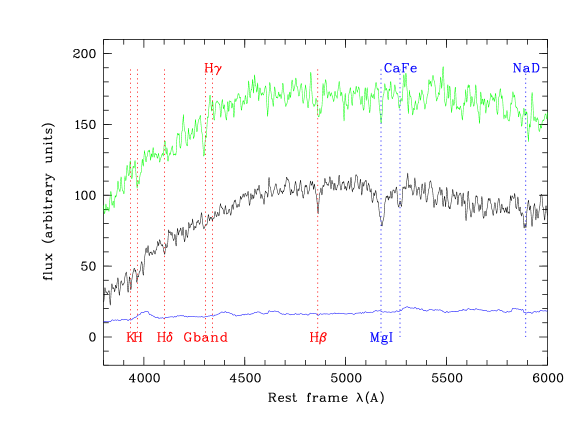
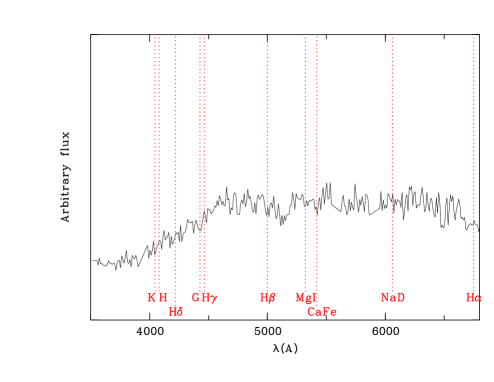
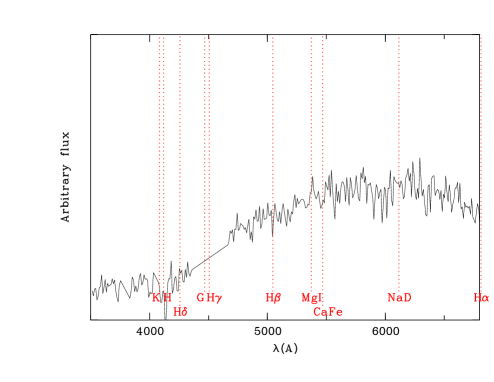
A more detailed analysis (Fig. 17) however shows some differences between Coma pure absorption line galaxies at R22 and R22. R22 galaxies exhibit among others HK, and G-band lines, while such lines are only barely visible in R22 galaxies. Non-Coma z0.1 galaxies do not show the same trend: they exhibit similarly strong absorption lines whatever the magnitude. An explanation would be that the faintest galaxies (which are qualitatively similar to Non-Coma z0.1 galaxies) were recently injected inside the Coma cluster directly from the field, perhaps following the NGC 4911 infalling group (see section 5.2).
7 Ultra Compact Dwarf candidates
In the previous section, we discussed several Coma cluster galaxy subclasses, including faint low surface brightness galaxies. We now investigate the possibility to detect other extreme surface brightness objects, the so-called Ultra Compact Dwarf galaxies (UCD hereafter). These objects are characterized by both a very small diameter and a high surface brightness, being quite similar to stars in terms of luminosity profile. Only a small number of these galaxies are presently known (see e.g. Phillipps et al. 2001 or more recent works by Chilingarian et al. 2008 or Price et al. 2009). For example Price et al. (2009) found only 3 UCDs in the Coma cluster from an HST-ACS and spectroscopic analysis (their sample basically cover the B=18-22 magnitude range). Any additional candidate can therefore significantly contribute to the study of this class of extreme objects.
We adopted a similar search strategy as in Price et al. (2009) but with a much fainter magnitude search range: our spectroscopic sample basically starts where the Price et al. (2009) sample ends. Our photometric data are ground based observations, so we will be unable to finalize a UCD sample, but we can provide some candidates which will be offered to the community for validation via space-based observations.
7.1 Imaging selection
UCDs are a priori located in the star sequence in a surface brightness versus magnitude diagram. We therefore selected all galaxies spectroscopically confirmed as Coma cluster members and located in the star sequence as shown in Fig. 18.
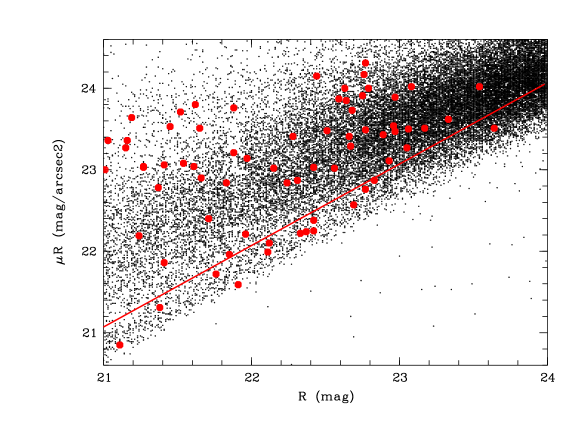
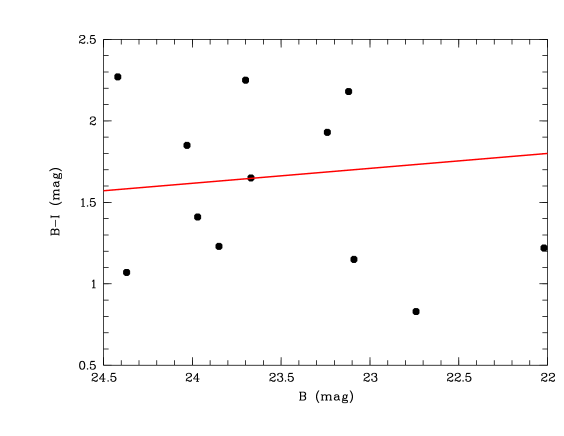
Next, we used a color criterium in order to refine the list of UCD candidates. Similarly to Price et al. (2009), we placed in a B-I versus B diagram the galaxies below the star line in Fig. 18. Fig. 19 then allows us to reduce our UCD candidate list to five objects at B-I1.8 (see Price et al. (2009) for details). These five objects are therefore compact enough and red enough to be potential UCD galaxies.
7.2 Spectroscopy
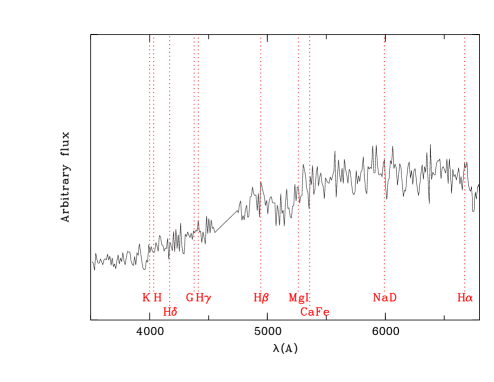
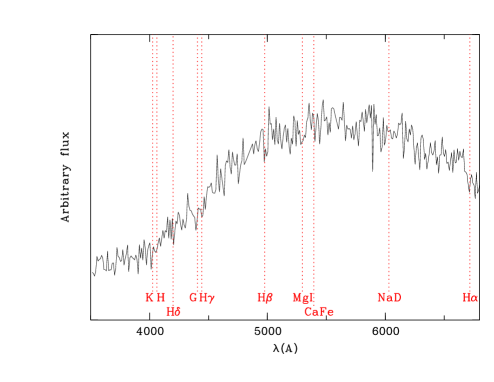
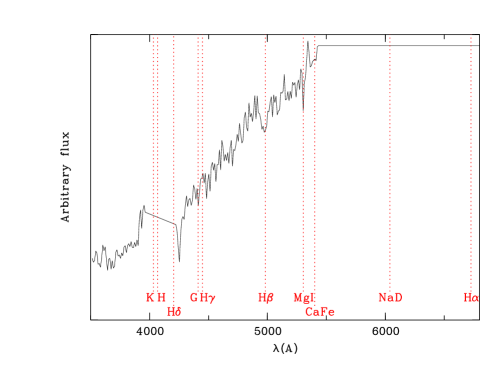
We examined the spectra of these five objects in order to check if they have the typical characteristics of UCD galaxies. The five spectra in Fig. 20 proved to be very similar to the Price et al. (2009) objects, with no detectable emission line. However, our spectra have a too low signal to noise ratio to efficiently adjust spectral models for these five galaxies and we will not push forward such an analysis.
7.3 UCD candidates
As such galaxies are probably produced via strong interaction processes, we checked the location of our 5 candidates. Two are very close to NGC 4874 and all but one are located along the NGC 4874 - NGC 4839 infall direction, where interaction processes are the strongest. Our sample is however rather small and we need more data in order to be able to draw firm conclusions. We give our candidate sample in Table 5.
| Id | B | R | I | redshift | ||
|---|---|---|---|---|---|---|
| (deg) | (deg) | (mag) | (mag) | (mag) | ||
| 22156 ACO1656:194.789+27.8238 | 194.789 | 27.8238 | 24.42 | 22.42 | 22.15 | 0.0169 |
| 16601 ACO1656:194.757+27.7621 | 194.757 | 27.7621 | 24.03 | 22.69 | 22.18 | 0.0380 |
| 30341 ACO1656:194.890+27.9066 | 194.890 | 27.9066 | 23.24 | 21.76 | 21.31 | 0.0236 |
| 36392 ACO1656:194.834+27.9631 | 194.834 | 27.9631 | 23.12 | 21.38 | 20.94 | 0.0250 |
| 14783 ACO1656:195.148+27.7418 | 195.148 | 27.7418 | 23.70 | 21.91 | 21.45 | 0.0285 |
More generally, we note that UCD candidates, even if all confirmed, are a minor component of our spectroscopic sample. They represent at most 5 of the observed dwarf Coma cluster galaxies. General conclusions drawn in this paper therefore apply to normal dwarf galaxies rather than to UCD galaxies.
8 Magnitude and colour distributions of Coma cluster galaxies
8.1 Luminosity function
In order to compute a luminosity function (LF), we have to count the number of galaxies part of the Coma cluster per unit magnitude and per unit area. The most straightforward way to compute such a LF would be to have spectroscopic information for all galaxies along the line of sight. This is certainly an unreachable astronomer’s dream for dwarf galaxies (see also Fig. 7). Therefore for a given magnitude range we have to estimate the percentage of cluster members inside the complete photometric catalog using the spectroscopic sample. This allows us to directly estimate the number of Coma cluster galaxy members, and then the LF.
Such a calculation assumes that the photometric sample is complete. This is not a concern however, because we have shown in Adami et al. (2006a, 2008) that all bands were basically 100 complete at least down to R=23, and this is the faint limit of our spectroscopy.
A more serious concern is the representativeness of the spectroscopic catalog. This catalog has to be free from significant selection biases, which could potentially favour (or not) cluster galaxy members versus non cluster members. Such selection effects are likely to occur at least partially for VIMOS targets because part of them were selected on the basis of a photometric redshift technique in order to increase the number of cluster members. Literature spectra also come from several samples and the selection effects are a priori unpredictable. We therefore study in detail these possible selection biases.
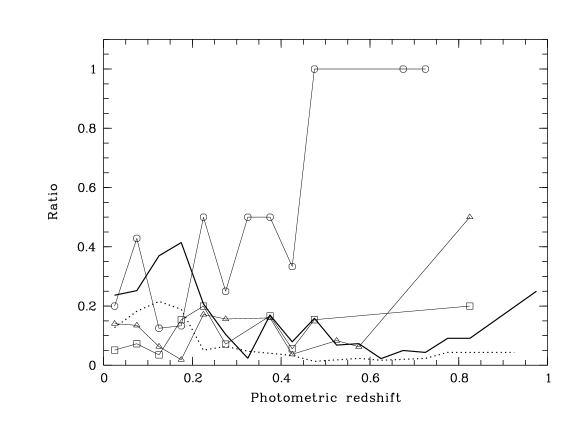
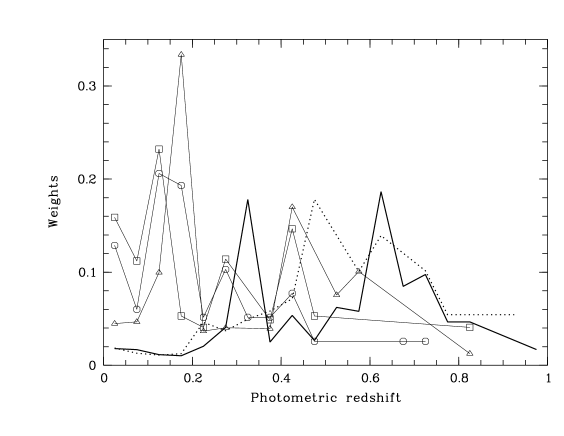
For each magnitude bin, we compare the redshift histogram of the sample with the redshift histogram of the sample (merging VIMOS and spectroscopic data from the literature). Since the main bias comes from the photometric redshift selection, this comparison allows us to quantify the selection biases. If no bias is present, the ratio of these two histograms should be constant as a function of redshift. The observed trends are indeed relatively weak, showing however that we preferentially select low redshift objects for the VIMOS sample and preferentially z0.2 objects for the literature sample. We therefore have to allocate a weight to each galaxy in order to correct the Coma cluster member percentage. Considering the ratio of the two previous histograms with redshift bins of 0.025, we computed such a weight for each galaxy in our spectroscopic sample. In a few words, galaxies preferentially selected in the spectroscopic sample by selection effects are allocated a smaller weight. Fig. 21 shows these weights (and the direct value of the ratio of the redshift histogram of the sample to the redshift histogram of the sample) as a function of redshift for the spectroscopic sample and for five magnitude bins.
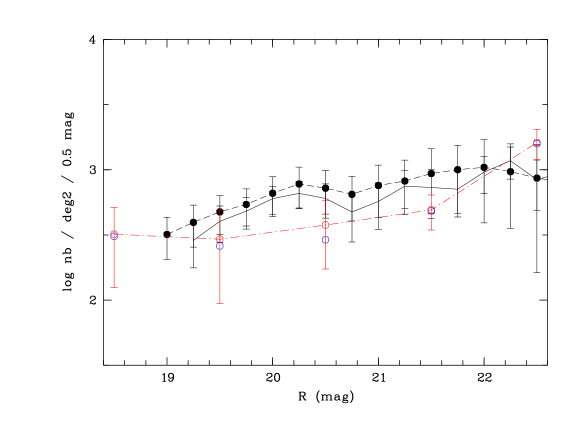
With these weights in hand, we are now able to compute corrected percentages of Coma cluster members using our spectroscopic catalog, and then LFs. We are still limited by the relatively low number of galaxies with spectroscopic redshifts and in order to minimize the error bars we only perform such a calculation in the whole area covered by the VIMOS spectroscopy. The price to pay is that we cannot study environmental effects on the LF with this technique. Fig. 22 shows this LF, as well as the previous estimations from Adami et al. (2007a, 2008) based on statistical subtraction and on photometric redshift estimates of the cluster membership in nearly the same area (namely subregions 4, 6, 7, 8, 11, 12, plus half of regions 9 and 16 of Adami et al. 2008). Error bars from the spectroscopic estimates are Poissonian. We clearly see the general agreement within the respective error bars, even if these errors remain quite large. The R=[20,21] interval shows the largest differences, the spectroscopic estimate being lower than the statistical subtraction and pure photometric redshift estimates. This is easily understandable because this bin is only poorly sampled by literature data and is not yet filled by our VIMOS spectroscopy (which starts at R21). This is also likely to be the magnitude regime when the newly discovered background groups contribute, implying a slightly lower LF for the Coma cluster itself in this specific region of the sky. The R21 range shows a better agreement with previous estimates.
We also have a good agreement between the mean slopes of the LF for the three techniques (computed on the magnitude interval shown in Fig. 22). We stress here that the slopes are not constant (the points are not perfectly aligned) so we only compute mean tendencies. However, given the error bar size, a constant slope cannot be excluded. The statistical subtraction leads to , the pure photometric redshift technique to , and the present spectroscopic technique to . We also see that the correcting weights do not induce large differences for the spectroscopic LF estimate, showing that selection effects, even if present, are not major. All these results put our previous results (Adami et al. 2007a,b, 2008) on firmer grounds.
8.2 Color magnitude relation
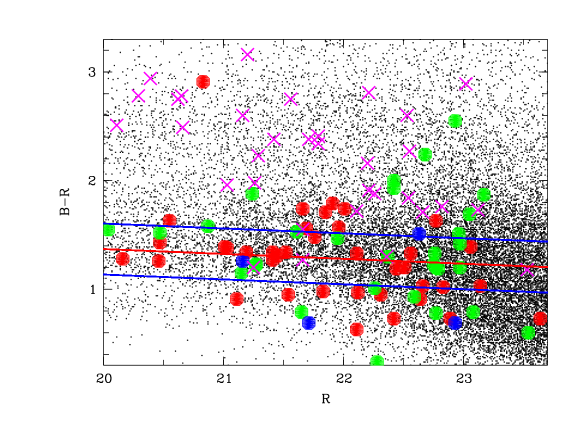
We show in Fig. 23 the BR versus R distribution of the galaxies along the Coma cluster line of sight, comparing the photometric sample and several VIMOS spectroscopic subsamples. Using the red sequence (RS hereafter) defined by the giant galaxies from Adami et al. (2006a), we see that the R20 Coma members still statistically follow this relation. There is only a small percentage of outliers (e.g. the BR2.9 Coma galaxy). This percentage is easily explained by wrong redshifts (we recall that up to 10 of our VIMOS redshifts could be wrong) or bad photometry.
Faint low surface brightness galaxies (Adami et al. 2006b) in Coma also exhibit a similar RS compared to giant galaxies and we now generalize this property to all Coma dwarf galaxies. Pure absorption line dwarf Coma members exhibit a lower dispersion around the mean RS, but emission+absorption line cluster galaxies (likely to be later type objects) also seem to follow the RS.
In order to check that our photometry and our redshift determinations are correct, we selected z0.2 pure absorption line galaxies. These likely early type objects (early type objects do not usually show emission lines) are distant enough to show significant color evolution compared to z=0, and even if they could form their own RS, they should not overlap the RS of the Coma cluster giant galaxies. This is indeed verified in Fig. 23, the large majority of the z0.2 pure absorption line galaxies lying outside the Coma RS area.
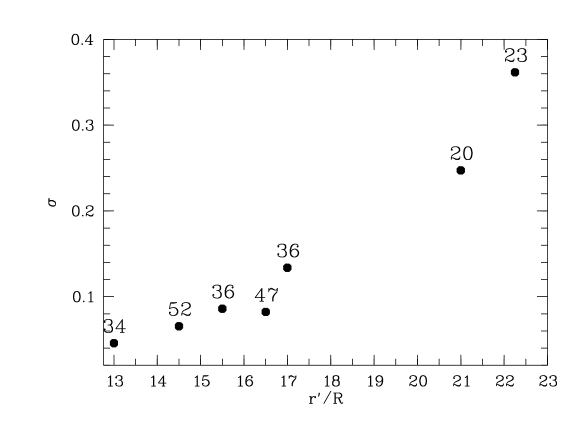
In order to compare our results for dwarf galaxies with trends observed for giant galaxies, we extracted all SDSS DR7 z=[0.011;0.035] galaxies in a circle of 25 arcmin centered on the Coma cluster centre. We manually discarded all galaxies showing emission lines to have the same selection as for the VIMOS z=[0.011;0.035] pure absorption line galaxies. We show in Fig. 24 the variation of the dispersion of the resulting RS as a function of magnitude (g’-r’ versus r’ for SDSS and B-R/R for VIMOS). The faint dwarf pure absorption line galaxies presently considered do not form a very compact RS, as opposed to the Coma giant galaxies. We also find a continuous increase of the RS as a function of magnitude. This tendency was already suspected by Adami et al. (2000) using shallower spectroscopy and is probably related to the various origins of these dwarf galaxies: primordial cluster galaxies or debris coming from a wide range of progenitor galaxy types. Another possibility is downsizing, the formation time of galaxies being regulated by their mass (Cowie et al. 1996).
9 A comprehensive picture of the Coma cluster
We have presented new spectroscopic data covering part of the central regions of the Coma cluster in the unprecedented magnitude range R. This range corresponds to the absolute magnitude range , and therefore reaches dwarf galaxies, some of them barely more massive than globular clusters. Combined with a compilation of all redshifts available in the literature, this leads to the most complete and deepest redshift catalogue presently available for the Coma cluster, and to our knowledge for any cluster.
These data have allowed us to confirm the substructures previously identified in Coma by Adami et al. (2005a), and to add three more substructures.
We detect a large number of groups behind Coma, in particular a large structure at z0.5 and the SDSS Great Wall (Gott et al. 2005). We also detect a large and very young previously unknown structure at z0.054, which may be located behind Coma more or less on the line of sight, and that we named the background massive group (BMG). This structure could be a major component of an unknown filament joining Coma to the SDSS Great Wall.
These structures allow to account for the mass maps derived from the weak lensing analysis by Gavazzi et al. (2009).
By analyzing the spectral characteristics of our sample we show that Coma cluster dwarf galaxies are old when red and young when blue. We also find, by considering emission and absorption line characteristics, that Coma cluster dwarf galaxies are old when showing absorption lines and young when showing emission lines. The same trend is observed as a function of stellar mass: red or absorption line galaxies have larger stellar masses than blue or emission line galaxies. However, the dust content and stellar metallicities do not significantly vary with spectral characteristics or colors.
X-ray substructures do not seem to have any influence on the Coma cluster galaxy properties. The magnitudes of the objects are not correlated with any galaxy properties (besides the stellar mass). However we put in evidence spectral differences between R22 and R22 Coma cluster galaxies, the brightest showing less prominent absorption lines (e.g. HK). This trend is less clear for field galaxies which are similar to R22 Coma galaxies. This suggests, along with the galaxy orbit features, that part of the faint Coma galaxies could have been recently injected from the field following e.g. the NGC 4911 group infall. This could be put in perspective with the fact that red dwarf galaxies are generally very rare in the field (unless associated with bright objects) and that blue dwarf galaxies are generally very rare in clusters (because of gas stripping processes). In Coma, even if blue dwarf galaxies represent only 25 of the total sample, their number is not negligible and is probably explained by the continuous infall of field galaxies.
Our spectroscopic data also allow us to confirm our previous results concerning the galaxy luminosity functions based on a statistical background subtraction and on photometric redshifts (Adami et al. 2007a, b, and 2008) down to R=23. We find however that the LF in the BMG region is somewhat overestimated when spectroscopy is not considered. Our spectroscopy is not deep enough to confirm our luminosity functions between R=23 and 25, but having a relatively good agreement in R=[21,23] suggests that the agreement is probably also good at fainter magnitudes and that luminosity functions are extremely steep at R23 ( from Adami et al. 2007b).
Although our sample is still limited, we show that the orbits of dwarf galaxies are probably anisotropic and radial. Dwarf galaxies have a roughly constant density profile in the considered region, agreeing with the hypothesis that they could originate from field galaxies radially falling into the cluster. In this scenario, at least part of the dwarf galaxies observed in Coma have fallen onto the cluster along the numerous cosmological filaments surrounding Coma. In this hypothesis, the steep faint end slope of the galaxy luminosity function would be linked to the cluster environment.
In a BR versus R colour–magnitude diagram, dwarf galaxies also form a red sequence which is very similar to that of the giant galaxies, which are 10 magnitudes brighter. We therefore confirm the red sequence drawn with low surface brightness galaxies, for which of course spectroscopic information is only very sparse (only 7 Coma low surface brightness galaxies from the Adami et al. 2006b sample have a spectrum). Note however that the dispersion on either side of the red sequence is quite large for dwarf galaxies, implying that these galaxies have not all followed the same formation processes.
We have now acquired a good knowledge of the overall structure and ongoing processes in the Coma cluster. We would now like to analyze spectroscopically the GLF in the outer regions of Coma. It was previously found from imaging data that this slope steepened with increasing distance from the center (Lobo et al. 1997, Beijersbergen et al. 2002, Adami et al. 2008), an important result to understand how the Coma cluster formed. However, such a steepening could be at least partly due to structures located behind Coma, and now requires to be confirmed spectroscopically. We also plan to acquire low resolution spectroscopy similar to the one presented in this paper for very faint galaxies in infalling structures such as the NGC 4839 group, which we are presently analyzing in X-rays.
The following step will be to obtain spectroscopic data for low surface brightness galaxies (including high resolution spectra to compute the galaxy dynamical mass), but this will probably have to wait for the next generation of extremely large telescopes due to prohibitive exposure times even with 10m-class telescopes.
Acknowledgements.
The authors thank the referee for useful and constructive comments. We are grateful to the CFHT and Terapix (for the use of QFITS, SCAMP and SWARP) teams, and to the French CNRS/PNG for financial support. MPU also acknowledges support from NASA Illinois space grant NGT5-40073 and from Northwestern University. We gratefully thank the ESO staff for succeeding in observing such a northern target from the Paranal site. One of us (RT) thanks Gary Mamon for general guidance and for help on some critical NED/SDSS cross-identifications.References
- (1) Adami C., Biviano A., Mazure A., 1998, AA 331, 439
- (2) Adami C., Ulmer M.P., Durret F., et al., 2000, AA 353, 930
- (3) Adami C., Biviano A., Durret F., Mazure A., 2005a, AA 443, 17
- (4) Adami C., Slezak E., Durret F., et al., , 2005b, AA 429, 39
- (5) Adami C., Picat J.P., Savine C., et al., 2006a, AA 451, 1159
- (6) Adami C., Scheidegger R., Ulmer M.P., et al., 2006b, AA 459, 679
- (7) Adami C., Durret F., Mazure A., et al., 2007a, AA 462, 411
- (8) Adami C., Picat J.P., Durret F., et al., 2007b, AA 472, 749
- (9) Adami C., Ilbert O., Pelló R., et al., 2008, AA 491, 681
- (10) Adami C., Gavazzi R., Cuillandre J.C., et al., 2009a, AA 493, 399
- (11) Adami C., Pelló R., Ulmer M.P., et al., 2009b, AA 495, 407
- (12) Andreon S., Cuillandre J.C., 2002, ApJ 569, 144
- (13) Beijersbergen M., Hoekstra H., van Dokkum P.G., van der Hulst T. 2002, MNRAS 329, 385
- (14) Bergeron J., Boissé P., 1991, AA 243, 344
- (15) Biviano A., 1998, Untangling Coma Berenices: A New Vision of an Old Cluster, Proceedings of the meeting held in Marseilles (France), June 17-20, 1997, Eds.: Mazure, A., Casoli F., Durret F. , Gerbal D., Word Scientific Publishing Co Pte Ltd, p. 1.
- (16) Biviano A., Durret F., Gerbal D., et al., 1996, AA 311, 95
- (17) Biviano A., Katgert P., 2004, AA 424, 779
- (18) Bournaud F., Duc P. A., Masset F. 2003, A&A, 411, L469
- (19) Chabrier G., 2003, PASP 115, 763
- (20) Chilingarian A., Cayatte V., Bergond G. 2008, MNRAS 390, 906
- (21) Covone G., Adami C., Durret F., et al., 2006, A&A 460, 381
- (22) Cowie L.L., Songaila A., Hu E.M., Cohen J.G., 1996, AJ 112, 839
- (23) Croft R. A. C., Weinberg D. H., Bolte M., et al., 2002, ApJ 581 20
- (24) Gavazzi R., Adami C., Durret F., et al., 2009, AA 498, L33
- (25) Geller M. J., Diaferio A., Kurtz M. J., 1999, ApJ 517, L23
- (26) Gott J.R.III, Jurić M., Schlegel D., et al., 2005, ApJ 624, 463
- (27) Iglesias-Páramo J., Boselli A., Gavazzi G., Cortese L., Vílchez J.M. 2003, A&A 397, 421
- (28) Jenkins L. P., Hornschemeier A. E., Mobasher B., Alexander D. M., Bauer F. E., 2007, ApJ 666, 846
- (29) Kacprzak G.G., Churchill C.W., Steidel C.C., Murphy M.T., Evans J.L., 2007, ApJ 662, 909
- (30) Khare P., Kulkarni V.P., Péroux C., et al., 2007, A&A 464, 487
- (31) King I.R., 1962, AJ 67, 471
- (32) Kron R.G., 1980, ApJS 43, 305
- (33) Lamareille F., Brinchmann J., Contini T., et al., 2009, AA 495, 53
- (34) Ledoux C., Valls-Gabaud D., Reboul H., et al., 1999, AAS 138, 109
- (35) Le Fèvre O., Vettolani G., Paltani S. et al., 2004, AA 428, 1043
- (36) Le Fèvre O., Vettolani G., Garilli B., et al., 2005, AA 439, 845
- (37) Lobo C., Biviano A., Durret F. et al., 1997, A&A 317, 385
- (38) Lokas E.L., Mamon G.A., 2003, MNRAS 343, 401
- (39) Milne M.L., Pritchet C.J., Poole G.B., et al., 2007, AJ 133, 177
- (40) Neumann D.M., Lumb D.H., Pratt G.W., Briel U.G., 2003, AA 400, 811
- (41) Phillipps S., Drinkwater M.J., Gregg M.D., Jones J.B., et al., 2001, ApJ 560, 201
- (42) Price J., Phillipps S., Huxor A., et al., 2009, MNRAS astro-ph: 0906.1123
- (43) Salim S., Charlot S., Rich R.M., et al., 2005, ApJ 619, L39
- (44) Sarazin C.L., 1986, Rev. of Mod. Physics 58, 1
- (45) Scodeggio M., Franzetti P., Garilli B., et al., 2005, PASP 117, 1284
- (46) Serna A. & Gerbal D. 1996, A&A 309, 65
- (47) Smith R. J., Marzke R. O., Hornschemeier A. E., et al., 2008, MNRAS 386, L96
- (48) Strigari L.E., Bullock J.S., Kaplinghat M., et al., 2008, Nature 454, 1096
- (49) Terlevich A.I., Calswell N., Bower R.G., 2001, MNRAS 326, 1547
- (50) Trentham N. 1998, MNRAS 293, 71
- (51) Walcher C.J., Lamareille F., Vergani D., et al., 2008, AA 491, 713
- (52) White S. D. M., Rees M. J., 1978, MNRAS 183, 341
- (53) White S. D. M., Frenk C. S., 1991, ApJ 379, 52
- (54) Wolf M., 1901, Astron. Nachr. 155, 127