11email: Matteo.Guainazzi@sciops.esa.int
2Harvard-Smithsonian Center for Astrophysics, Cambridge, MA 02318
3INAF-Osservatorio di Arcetri, Firenze, I-50125, Italy
4Dipartimento di Fisica, Università degli Studi Roma Tre, via della Vasca Navale 84, I-00146 Roma, Italy
5Mullard Space Science Laboratory, University College London, Holmbury St Mary, Dorking, Surrey RH5 6NT, UK
6Physics Department, University of Crete, P.O. Box 2208, GR-710 03, Heraklion, Crete, Greece
AGN/starburst connection in action:
the half million second
RGS spectrum of NGC 1365
Abstract
Context. High-resolution X-ray observations in the imaging and spectral domain have recently opened a new window on active galactic nuclei (AGN) feedback onto the circumnuclear gas. Spectral diagnostics, as well as the remarkable morphological coincidence between [O iii] and X-rays, point to AGN photoionisation as the dominant ionisation mechanism on scales as large as a few kpc.
Aims. In this paper we extend these studies to the nearby Seyfert 2 galaxy NGC 1365, known to host a circumnuclear ring of intense star formation at 1.3 kpc from the nucleus. The main scope of this investigation is to study the connection between nuclear activity and star formation in nearby AGN.
Methods. We present a deep (5.8 days) 0.3–2 keV high-resolution spectrum of NGC 1365, collected with the reflection grating spectrometer (RGS) on board XMM-Newton.
Results. The spectrum is dominated by strong recombination lines of He- and H-like transitions from carbon to silicon, as well as by L transitions from Fexvii. The continuum is strong, especially in the 10 to 20Å range. Formal fits require two optically thin, collisionally ionised plasma components, with temperatures 300 and 640 eV. However, they leave the bulk of the forbidden components of the He- Ovii and Nvi triplets unaccounted for. These features can be explained as being produced by photoionised gas. NGC 1365 is therefore the first obscured AGN, whose high-resolution X-ray spectrum requires both collisional ionisation and photoionisation.
Conclusions. The relative weakness of photoionisation does not stem from the intrinsic weakness of its AGN, whose X-ray luminosity is erg s-1. We suggest that it may instead come from the line-of-sight from the active nucleus to the NLR being blocked by optically thick matter in the broad line region, at the same time responsible for the large observed variation of the column density obscuring the X-ray active nucleus. Alternatively, NGC 1365 could host a remarkably luminous nuclear starburst when compared to the AGN accretion power.
Key Words.:
Galaxies: active – Galaxies:Seyferts – Galaxies: starbursts – X-rays:galaxies – X-rays:individual:NGC 13651 Ionising the NLRs: the X-ray view
Most of the observational constraints on the physics and geometry of narrow line regions (NLRs) in active galactic nuclei (AGN) come from optical spectroscopy and imaging. Comparison between spatially resolved spectroscopy of nearby bright obscured AGN and photoionisation models (Ferland & Osterbrock (1986); Osterbrock (1989)) and the study of ionisation cones (Pogge (1988); Tadhunter & Tsvetanov (1989)) indicate that the AGN high-energy emission is the main source of ionising photons, although the contribution by collisionally ionised plasma also seems to be required to accurately match the spectra (Viegas-Aldrovandi & Contini (1989)). A correlation between radio power and line widths (Wilson & Willis (1980); Whittle (1985, 1992); Ulvestad & Ho (2001)) and the good morphological correlation between [OIII] and radio images (Capetti et al. (1996); Axon et al. (1998); see however Das et al. (2006) for a different view) raise the possibility that the interaction between radio jets and the NLR gas may affect the ionisation state of the NLRs as well. Experimental support to this hypothesis has so far been presented in one case only (Axon et al. (1998)).
In this context, X-rays have recently opened a complementary window on NLR physics. Whenever (extended) NLRs in nearby Seyfert 2 galaxies are larger than the angular resolution of the Chandra optics (0.5), X-ray extended emission on scales from a few hundred to about 2 kpc has been discovered (Wilson et al. (2000); Young et al. (2001); Bianchi et al. (2006)). X-rays bear a remarkable morphological similarity to images in the [[OIII] band. Simple photoionisation models applied to the optical to X-ray surface-brightness ratio indicates that solutions exist in terms of a single phase AGN-photoionised medium, where the ionisation parameter remains constant across the whole ENLR (Bianchi et al. (2006)). That implies a radial decrease of the density . This is generally consistent with results derived from optical spectroscopy (Kraemer et al. (2000); Bradley et al. (2004); Kraemer et al. (2008)), although recent high-resolution spatially-resolved spectroscopy in a small sample of local Seyfert galaxies suggests a shallower dependence (Bennert et al. (2006)), in agreement with older results on Mkn 573 (Capetti et al. (1996)).
High-resolution spectroscopy in the soft X-ray band (0.2–2 keV) confirms the overall picture. In this energy band, spectra of obscured AGN are typically dominated by recombination lines from He- and H-like transitions from C to Si, and by a Fe-L transitions “forest”, with negligible continuum contribution (Guainazzi & Bianchi (2007); GB07 hereafter). In a few bright sources, the quality of the spectrum warrants detailed spectral diagnostics. In all these cases, photoionisation seems to be the dominant ionisation mechanism (Kinkhabwala et al. (2002); Sako et al. (2000); Sambruna et al. (2001); Armentrout et al. (2007)). In NGC 1068, by far the brightest obscured AGN of the soft X-ray sky, the contribution from an optically thin collisionally ionised plasma can be constrained to be of integrated soft X-ray flux (Brinkman et al. (2002)). Resonant scattering plays also an important role in the overall ionisation balance (Kinkhabwala et al. (2002)); this constrains the gas column density to cm-2 (GB07), where is the oxygen abundance.
In their spectroscopic study of a sample of 69 Seyfert 2 galaxies observed with the XMM-Newton reflection grating system (RGS; den Herder et al. (2001)), GB07 suggest that the conclusions derived from detailed spectral analysis of the brightest objects can be extended to the underlying population of nearby Seyfert 2 galaxies up to a flux level erg cm-2 s-1. However, GB07 noticed that peculiar objects also exist, whose X-ray spectrum exhibits different phenomenological properties from the rest of the sample. NGC 1365 is the X-ray brightest of these “oddities”.
NGC 1365 is an intriguingly complex galaxy. Optically, it has been classified as a Seyfert either of type 1.5 (Veron et al. (1980); Hjelm & Lindblad (1996)), 1.8 (Maiolino & Rieke (1995)), or 2.0 (Turner et al. (1993)). Following GB07 and Bianchi et al. (2009b), we consider in this paper NGC 1365 a “type 2” AGN on the basis of the column density covering its hard X-ray emission ( cm-2; Risaliti et al. (2007); Risaliti et al. 2009a ). Its obscured active nucleus is highly variable at different wavelengths (Veron et al. (1980); Hjelm & Lindblad (1996); Risaliti et al. (2007)). It hosts a circumnuclear star-forming ring with a diameter of 1.3 kpc (14; 1 pc at the distance of NGC 1365: Mpc, Silbermann et al. (1999)). This ring is resolved into many compact super star clusters (Kristen et al. (1997)). Some of them are extremely massive and young (Galliano et al. (2005, 2008)). The latter were detected also in the CO band (Sakamoto et al. (2007)), leading to an estimate of molecular material mass of the order of within 2 kpc from the AGN. The nuclear starburst ring must be a copious source of X-rays, predominantly produced by two processes (Mass-Hesse et al. (2008); Grimm et al. (2003); Persic & Raphaeli (2002)). Softer thermal-plasma emission comes from gas heated to K by supernova-driven shocks propagating through denser interstellar medium. Harder, usually featureless X-ray emission comes from accreting compact objects (high-mass X-ray binaries).
At the same time, NGC 1365 hosts a 5 bi-conical and asymmetrical [O iii] outflow (Hjelm & Lindblad (1996); Kristen et al. (1997); Veilleux et al. (2003)) and a nuclear radio jet, the latter embedded in the cone and extending 5 SE along the galaxy major axis (Sandqvist et al. (1995)). The fact that the [O iii] 5007 versus H ratio in the cone is larger than one suggests photoionisation by the AGN. [N ii]/Hα ratios 1 are measured out to 5–6 kpc from the nucleus (Veilleux et al. (2003)) and are consistent with either AGN photoionisation or shock ionisation.
For all the above reasons, NGC 1365 represents a unique laboratory to study the connection between nuclear activity and star formation. In this paper we primarily present and discuss the second deepest high-resolution X-ray spectrum of an obscured AGN ever (after NGC 1068). It was collected during an occultation experiment of the NGC 1365 AGN in 2007 (Risaliti et al. 2009b ). Archival data from an earlier (2004) observation of the same field are also presented in this paper.
The paper is organised as follows: we describe the observations and data reduction in Sect. 2; in Sect. 3 we present a phenomenological analysis of the total RGS spectrum, aimed at characterising the emission line content. In Sect. 4 we compare the RGS spectrum with physical model of optically thin, collisionally ionised plasma and photoionisation, and determine the contribution of each mechanism to the emission line spectrum. In Sect. 5 we compare our findings with spatially resolved CCD-resolution spectroscopy obtained with the Chandra ACIS, and discussed in Wang et al. (2009). We put our results in the context of the CIELO (Catalogue of Ionised Emission Lines in Obscured AGN) sample of Seyfert galaxies (GB07) in Sect. 6, and summarise our main results in Sect. 7. Unless otherwise specified, statistical uncertainties are at the 90% confidence level for one interesting parameter.
2 Observations and data reduction
The field around NGC 1365 has been observed several times by XMM-Newton. In order to ensure an accurate reconstruction of the wavelength scale in the RGS spectra, only observations aiming at the galaxy nucleus (Tab. 1) are considered in this paper.
| Observation # | Start date | Exposure time |
|---|---|---|
| (ks, RGS1) | ||
| 0205590301 | 17-Jan-2004 | 59.0 |
| 0205590401 | 24-Jul-2004 | 67.8 |
| 0505140201 | 30-Jun-2007 | 126.9 |
| 0505140401 | 02-Jul-2007 | 127.1 |
| 0505140501 | 04-Jul-2007 | 125.1 |
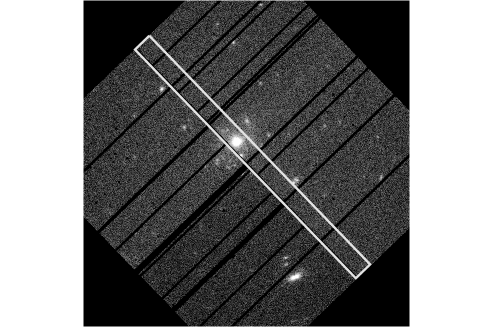
The RGS spectra were reduced following the guidelines in GB07. We used the data reduction pipeline rgsproc in SASv7.1 (Gabriel et al. (2003)), coupled with the most updated calibration files available in August 2008. We choose a fixed celestial reference point for the attitude solution coincident with the NED optical nucleus of NGC 1365 (, ). The RGS aperture encompasses the whole NGC 1365 X-ray nucleus, including the 5 kpc extended emission imaged by Chandra (Wang et al. (2009)), as well as several point-like sources in the galaxy (Fig. 1).
Intervals of flaring particle background were filtered out by applying a fixed threshold of 2 counts per second on the background events, CCD#9, s light curve.
Source spectra were extracted in regions of the dispersion versus cross-dispersion and Pulse Invariant versus cross-dispersion planes, corresponding to 95% of the point spread function (PSF) in the cross-dispersion direction. Background spectra have been generated using a sub-set of blank field observations, whose background count rate matches the level measured during each individual RGS observation. This method is appropriate for sources with extended emission on scales comparable to the PSF such as NGC 1365.
The spectrum is dominated by emission lines, as typically observed in obscured AGN (GB07), although an continuum emission is also clearly visible, especially in the wavelength range between 10 and 20Å. Such a continuum component cannot be associated to transmission of the nuclear emission through a Compton-thin state, because the column density in these states is always higher than cm-2 (Risaliti et al. (2007); Risaliti et al. 2009a ). This component represents a first remarkable difference with respect to the archetypal Seyfert 2 galaxy NGC 1068 (Kinkhabwala et al. (2002)). We compared the intensities of the eight brightest emission lines in the spectra accumulated during each individual observation. In all cases, the intensities were consistent within the statistical uncertainties. We therefore accumulated all the RGS data into a single spectrum (“RGS merged spectrum” hereafter). Its total exposure time is 501 and 439 ks in the RGS1 and RGS2, respectively. In Fig. 2 we show the spectrum obtained merging all the

RGS observations of NGC 1365.
3 The half Ms RGS spectrum: the line content
As first analysis step, we have characterised the emission line content of the spectrum. For this purpose, we fit segments of 100 spectral channels with a simple power-law continuum (spectral index, fixed to 1; the quality of the fit is not significantly improved if this parameter is left free in the fit) corrected by photoelectric absorption due to neutral gas in our Galaxy ( cm-2 according to the LAB survey: Kalberla et al. (2005)) and as many emission lines as required according to the following criterion: that the addition of a new emission line yields a decrease in the value of the C-statistics (Cash) of 9.21, formally corresponding to 99% confidence level for two interesting parameter (Lampton et al. (1976)). We fit He-like triplet components together, imposing a difference among the component’s centroid energy as dictated by the atomic physics. Lines are assumed in this paper to be unresolved, unless otherwise specified.
The results are summarised in Tab. 2, where we show the best-fit line energy and intensity, the intensity normalised to the intensity of the forbidden component of the He- Ovii (“normalised intensity” hereafter), the normalised intensity in NGC 1068 according to our re-analysis of the RGS data of this target, and the most likely identification with the corresponding laboratory energy. The errors in this Table are purely statistical at the 1 level.
| Energy (eV) | Intensity () | [O vii(f)] | [O vii(f)] | Transition ()a | Contribution by |
| (eV) | (10-5 s-1 cm-2) | NGC 1365 | NGC 1068 | (eV) | thermal plasma (%)b |
| CVI Ly- (367.56) | |||||
| NVI He- (r) (430.75) | |||||
| (r) - 4.4 | NVI He- (i) (426.37) | ||||
| (r) - 10.8 | NVI He- (f) (419.86) | ||||
| CVI Ly- (435.91) | |||||
| CVI Ly- (459.42) | |||||
| NVII Ly- (500.31) | |||||
| OVII He- (r) (574.02) | |||||
| (r) - 5.3 | OVII He- (i) (569.07) | ||||
| (r) - 13.0 | OVII He- (f) (561.06) | ||||
| OVIII Ly- (653.70) | |||||
| FeXVII 3s2p (726.29) | |||||
| Ovii RRCc (739.11) | |||||
| Oviii Ly- (774.71)d | |||||
| FeXVIII 3d2p (824.72) | |||||
| OVIII RRC (871.52)e | |||||
| NeIX He- (r) (922.14) | |||||
| (r) - 7.2 | NeIX He- (i) (915.13) | ||||
| (r) - 13.0 | NeIXHe- (f) (905.11) | ||||
| NeX Ly- (1021.92) | |||||
| MgXI He- (r) (1352.24) | |||||
| (r) - 8.0 | MgXI He- (i) (1343.44) | ||||
| (r) - 21.0 | MgXI He- (f) (1331.90) | ||||
| MgXII Ly- (1472.51) | |||||
| SiXIII He- (r) (1867.47) | |||||
| (r) - 13.8 | SiXIII He- (i) (1853.61) | ||||
| (r) - 27.8 | SiXIII He- (f) (1839.76) | ||||
| f | … |
amost likely identification. The laboratory energy is shown in brackets. bcontribution to the total intensity due to the best-fit model in Tab. 3. Values higher than 100% mean that the model over-predicts the data at that energy; cfit with a single Gaussian ( eV). Possible blending with Fe xvii 2s2p (738.98 eV): see Sect. 4.1 for the results of a fit with two Gaussians; dpossible blending with Fexviii 3s2p (773.02 eV); efit with a single Gaussian ( eV). Possible blending with Fexviii 2s2p (872.75 eV). See Sect. 4.1 for the results of a fir with two Gaussians; funidentified.
Only lines detected according to the aforementioned statistical criterion are shown, except for the He- triplets, for which all the components are shown, even if not all of them are formally detected.
The spectrum of NGC 1365 is remarkably different from that of the archetypal Seyfert 2 Galaxy NGC1068. Once the line intensities are normalised to the forbidden component of the Ovii He- triplet, we find that:
-
1.
Ly- transitions of H-like species are stronger in NGC 1365 (except Cvi Ly-)
-
2.
Fe-L transitions are stronger in NGC 1365
-
3.
the intensities of the He-like magnesium and silicon triplet components are higher in NGC 1365, although the poor statistics of these features in the NGC 1068 spectrum prevents us from saying whether there is a difference also in the relative weight of the triplet components
We’ll discuss here briefly these outcomes, because they provide us with a guideline on the spectral analysis developed in Sect. 4 and Sect. 5. A more detailed discussion of the astrophysical implications of the soft X-ray spectrum of NGC 1365 is, however, deferred to Sect. 6.
The forbidden transitions of He-like triplets are strongly suppressed in collisionally ionised plasmas. This provides an explanation for Item#1 above in terms of a larger contribution of a collisionally ionised plasma in NGC 1365. Indeed, a high ratio between the intensity of the Ly- Oviii against the forbidden component of the Ovii He- is an empirical criterion to distinguish starburst from AGN in high-resolution soft X-ray spectra (GB07). A strong contribution by Fe-L transition may also be expected in thermal plasmas (Mewe et al. (1985)). This may provide an explanation for Item#2. Nonetheless, comparatively strong iron lines could also be the signature of metal overabundance. This could also explain the high intensities of magnesium and silicon triplet components. Wang et al. (2009) found regions of high Si- and Fe-abundances N and NW the NGC 1365 nucleus in their analysis of the deep high-resolution Chandra/ACIS image (together with regions of low Si-abundances primarily to the South the nucleus). We will later discuss the issue of heavy elements metallicity in the NGC 1365 interstellar medium. On the other hand, the intensities of the He-like nitrogen, oxygen and neon He- triplet components are comparable in NGC 1068 and NGC 1365.
A feature at centroid energy eV ( Å) is close to the Ovii Radiative Recombination Continuum (RRC). This feature is narrow. If fit with a Gaussian profile the upper limit on its intrinsic width is 0.8 eV. Narrow RRC features are unambiguous signatures of photoionised plasmas (Liedahl et al. (1995)). Nonetheless, contamination by the nearby Fexvii 2s2p feature at 16.780Å is possible. We will further discuss the identification of this feature in the framework of the global thermal fit of the RGS spectrum (Sect. 4.1).
4 Spectral fitting of the RGS spectrum
The next step for the understanding of the physical processes responsible for the soft X-ray emission in NGC 1365 is to use physical emission models to fit globally the whole soft spectrum or, at least, to simultaneously fit the emission lines in Tab. 2. We have followed two complementary approaches: global fit of the RGS spectrum with a combination of thermal components; and simultaneous fits of emission line ratios through CLOUDY-based photoionisation models.
4.1 Thermal fit of the overall RGS spectrum
Firstly we have tried to fit the combined RGS spectra with a combination of optically thin, collisionally ionised plasma (“thermal scenario” hereafter). We used trough this paper the apec model (Smith et al. (2001)) in Xspec v12 (Arnaud (1996)) to model such a component. We used as a criterion to increase the model complexity that any further component yields an improvement of the C-statistic . Following the results from the spatially-resolved spectroscopy of the Chandra diffuse emission (Wang et al. (2009)), we have assumed that each continuum spectral component is modified by its own photoelectric absorption column density. In all the models we also included one power-law and one blackbody continuum. These components are required to fit emission excesses in the softest ( keV) and hardest ( keV) RGS band. The blackbody component may account for the integrated emission of point sources (X-ray binaries and Ultra Luminous X-ray sources, ULX). Alternative parametrisation for this “soft excess” are possible, such as emission from a disk blackbody or bremsstrahlung. They do not substantially affect the main results present in this paper. The power-law component is instead required to fit a featureless hard excess above keV. Only an upper limit on the spectral index is obtained, indicating a very hard spectrum (). Other parametrisation of this component are also possible: a bremsstrahlung yields, for instance, keV. Although in principle this spectral component could be associated with the integrated emission of unresolved X-ray binaries in the RGS aperture, it is difficult to infer any meaningful physical constraints given the small energy range on which it yields a significant contribution to the fit. We will therefore refrain from discussing it any further in this paper. We only observe that the same component with a similar very flat spectrum is required by the fit of the NGC 1365 ACIS spectrum, by contrast to the soft continuum component which is required by the RGS data only (cf. Sect. 5). Finally, we included a photoelectric absorption component covering the whole RGS model, to take into account obscuration by gas in the Galaxy along the line-of-sight to NGC 1365.
The model outlined above, although capable of reproducing most of the emission line intensities, fails at reproducing the Ovii and Nvii triplet ratios. This is illustrated in Fig. 3

which shows the spectral region around the former feature superposed with a model with three thermal plasma components. As expected for the temperatures (in the range 0.2–1 keV) which these fits yield, the model has a much higher recombination component than required by the data. Although it is impossible to associate an absolute confidence level of the fit quality when the C-statistics is used, its high value (13042.7/5304 degrees of freedom) is indicative of an imperfect model.
We have therefore removed from the fit wavelength ranges around the Ovii (21.0-23.0Å) and the Nvi (28.0-30.0 Å) triplets, and repeated the fit procedure. As a cross check we have verified that the best-fit model obtained on this restricted wavelength range does not overproduce the observed counts in the excised wavelength ranges.
Using the restricted wavelength range, the best-fit requires only two thermal components. In principle the abundances of each component with respect to the solar values (Anders & Grevesse (1989)) have been left free to vary independently. However, for only a sub-set of them the corresponding confidence interval are significantly constrained. They are listed in Tab. 3 together
| Parameter | RGS | ACIS |
|---|---|---|
| Thermal components | ||
| (1020 cm-2) | ||
| (eV) | ||
| a | ||
| (1020 cm-2) | ||
| (eV) | ||
| a | ||
| Elemental abundances with respect to solar | ||
| Blackbody | ||
| (eV) | … | |
| b | … | |
ain units of , where is the angular size of the source and and are the electron and H densities, respectively
bin units of 10, where is the source luminosity in units of 1039 erg s-1 and is the distance to the source in units of 10 kpc
with the other best-fit parameters. The measured Galactic column density ( cm-2) is marginally consistent with the contribution estimated from the radio LAB survey. The C-statistic value is 6237.0/4440 degrees of freedom. In Fig. 4 we show the RGS spectrum and


best-fit thermal model as in Tab. 3 superposed. The contribution to the total intensity of each emission line due to this model (“baseline model” hereafter) is given in the rightmost column of Tab. 2.
A multiple-temperature structure could be the results of fitting a single temperature non-equilibrium ionisation plasma. We have tested this hypothesis by alternatively fitting the RGS spectrum with a single vnei (Borkowski et al. (2001)) model in Xspec. The resulting C-statistics is worse (6857.7/4422 dof). Again, this in itself is not enough to rule out this model. Nonetheless, we observe that several lines in the short wavelength regime ( Å) are not well accounted for as in the baseline model with two equilibrium thermal components. Moreover, it remains true also with the non-equilibrium model that most of the forbidden component of the Ovii and Nvi triplets are not accounted for. The discrepancy in the case of the non-equilibrium collisional scenario is even higher than in our baseline model. The recombination (forbidden) component of the Ovii He- in the model is twice as strong (four times weaker) than in the data. We will not consider this solution any longer.
We discuss now the identification of the feature at eV ( Å). Formally, its wavelength is inconsistent with the strongest close transitions: Ovii RRC and Fe xvii 2s2p (at =16.777 and 16.780 Å, respectively). % (1- error) of its intensity are accounted by the thermal scenario best-fit model, although some excess at lower energies remain. We have tried to fit this excess with an additional Gaussian emission line, keeping its centroid energy frozen to the source frame laboratory wavelength of the Ovii RRC. The fits improves by dof. The width and intensity of this additional component are: eV, and photons cm-2 s-1. We will refer to these values hereafter when discussing the properties of the Ovii RRC in NGC 1365.
Similarly, the identification of the emission line at eV ( Å) is not fully unambiguous. The centroid energy is consistent with either Oviii RRC (14.228 Å) of Fexviii 2s2p (14.220 Å). A fit with two Gaussians having centroid energy fixed to the laboratory values, however, yields only an upper limit ( cm-2 s-1) on the intensity of the latter. With this modelling the best-fit parameters of the Oviii RRC are: eV; eV; cm-2 s-1.
We have also tried to constrain the bulk velocity of the lines, by allowing the redshift of the thermal components to vary. Indeed, this yields an improvement in the quality of the fit by dof for a (formal) velocity shift of km s-1. This is comparable to the systematic uncertainties in the RGS wavelength scale (20 mÅ at 3, corresponding to 300 km s-1 at the wavelength of the Ovii He-). We consider therefore this piece of evidence inconclusive as to whether the soft X-ray lines in NGC 1365 are affected by a velocity shift of astrophysical nature.
Assuming the baseline model as in Tab. 3, the observed 0.3-2.0 keV flux is erg cm-2 s-1, corresponding to a luminosity (corrected for Galactic absorption) of erg s-1.
4.2 CLOUDY-simulations of the line emission intensity ratios
In order to estimate the contribution of photoionisation to the soft X-ray lines, we have generated a grid of models of a photoionised nebula with Cloudy (Ferland et al. (1998)). We have assumed a standard AGN continuum, with the following parameter: “blue bump” temperature K; ; ; and (Risaliti et al. (2000)), where the are spectral energy index in the band or between the bands specified by the subscripts. was determined from the strictly simultaneous optical-to-X-ray Spectral Energy Distribution measured by the XMM-Newton EPIC and OM instruments during Compton-thin states (see Risaliti et al. 2009a, 2009b for an analysis of the EPIC spectra). We have generated grid of reflected spectra from a photoionised nebula, spanning a large range in ionisation parameter: =[-2.0,2.0]111the ionisation parameter is defined as , where is the surface flux of ionising photons, and is the total hydrogen density; electronic density =[3,14] and total column density =[17,24] in steps of 0.1 dex. We have extracted intensity ratios from these simulations for all the lines detected in CIELO (GB07). For each model of the grid we have calculated a figure of merit of the agreement between the observed and the simulated line ratios through a generalised function:
where is the observed line intensity (with its statistical error ) and is the intensity predicted by Cloudy, both normalised to the value of the forbidden component of Ovii He-. The sum is carried out on all the line species detected in the RGS spectrum of NGC 1365. We consider acceptable all models, which yield a value +9.21.
No solution exists, which can simultaneously fit the whole line spectrum observed in NGC 1365 in terms of one photoionised component, even if allowance is made for the elemental abundances to vary in the range [0,10 ]. Even more constraining, no solution is able to simultaneously fit the intensity of the Oviii Ly- and of the recombination component of the Ovii He- triplet. Fits with a combination of two pure photoionisation models yields still . On the other hand, the value corresponding to the fit with the RGS baseline model (i.e. two thermal components without any photoionisation components) is 47.0 for 19 dof, significantly better than for two photoionisation components, although still unacceptably high. A fit with one thermal and one photoionisation component is only marginally better: =41.5 for 19 d.o.f. (for 1.4).
These results, coupled with the spatially resolved spectroscopy of the Chandra NGC 1365 field (Wang et al. (2009)) leads us to investigate in this section a physical scenario, where the baseline thermal model developed in Sect. 4.1 applies, and any photoionised component is required only to explain the deviations between the experimental data and this baseline model.
We have therefore applied the grid of Cloudy models to a line spectrum obtained by the RGS observation after subtracting the contribution of the thermal scenario best-fit according to the rightmost column in Tab. 2. Only four of the lines detected in the RGS spectra have still intensity measurements statistically different from zero after the “thermal” contribution is subtracted: the forbidden and inter-combination component of Ovii He-, the forbidden components of Nvi He-, and (marginally) the Oviii Ly- transition, as well as the Ovii and Oviii RRC, which, however, are not simulated by Cloudy. These four lines obviously yield only very loose constraints on the physical properties of the photoionised plasma responsible for their emission. The minimum value is 20.3 for 20 dof, corresponding to . In principle values of comprised between 0.6 and 1.9 yield all value in the acceptance range. One may use the contribution to the of the Nvi forbidden line (Fig. 5)

to further constraint, at a lower statistical significance, the range of acceptable ionisation parameters. At 1: (Fig. 5). In Fig. 6 we show iso- contour plots in the
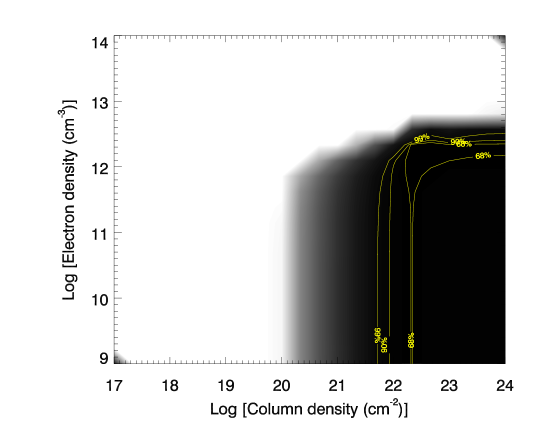
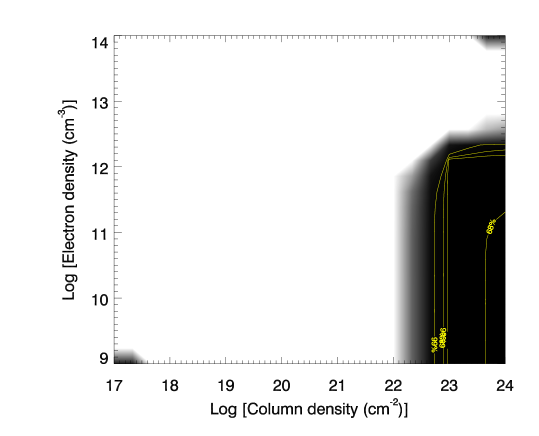
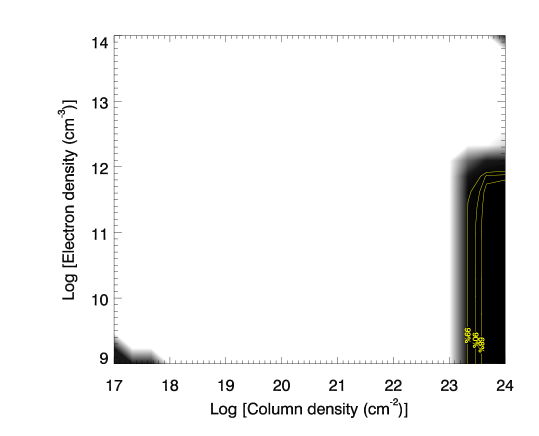
versus plane for 1.2, 1.625, and 1.925. The electron density is only loosely constrained to be cm-3 and the column density cm-2 at the 99% confidence level for two interesting parameters (these intervals are only marginally more tightly constrained if a less demanding confidence interval is chosen).
We stress that these results need not to be over-interpreted, given the simplicity of the model assumed and the strong assumptions underlying it. Our results are to be interpreted more as a simple “proof of existence” of photoionised material in the nuclear region of NGC 1365 rather than as an accurate measure of the photoionised spectrum.
5 Comparison with the Chandra results
Deep Chandra observations of NGC 1365 (Wang et al. (2009)) have shown that the soft X-ray morphology is rather complex, with four components contributing to the overall energy output: a) the unresolved nucleus; b) diffuse emission on scale as large as 5 kpc; c) off-nucleus point sources; d) the jet. Comparing the RGS spectroscopic measurement with CCD resolution spatially-resolved spectroscopy is therefore far from trivial, given the large RGS aperture (cf. Fig. 1). Only a fraction of this field is imaged by Chandra. Nonetheless, a comparison with the Chandra spatially-resolved spectroscopic results may be interesting to evaluate the systematic uncertainties induced by spatially integrated spectroscopy on such a complex source. We remind that the Point Spread Function of the XMM-Newton optics is too large for the diffuse soft X-ray emission associated to the circumnuclear starburst to be discernible.
We have extracted a Chandra-ACIS spectrum from the whole NGC 1365 X-ray surface, including nucleus and point sources (details on the data analysis reduction can be found in Wang et al. 2009), and applied the best-fit RGS baseline model in the 0.3-2 keV energy band. The model provides a good fit to the data (/70 dof), and residuals are visible mainly at an energy consistent with the Ovii He- triplet (Fig. 7),

as expected. The cross-calibration between RGS and the Chandra ACIS is discussed by Plucinsky et al. (2008). Flux measurements at the Ovii energies by ACIS are typically lower (by 10%) than the RGS. The difference becomes smaller () at the Neix and Nex energies. The best-fit model parameters are shown in the rightmost column of Tab. 3. Interestingly enough, the Chandra fit does not require the blackbody component. Taking into account the larger statistical uncertainties associated with the determination of the parameters from the Chandra spectrum, the main differences to the RGS best-fit are the normalisations of the collisionally ionised plasma components and the metallicities. The best-fit metallicities measured by Chandra are systematically higher by a factor 2 to 4 than the RGS one (although consistent within 1). On the other hand, the normalisations of the continua measured by the ACIS are around a factor of 5 lower than measured by RGS. We interpret these findings as due to the contribution of unresolved point sources in the RGS aperture, which dilute the contrast between the emission lines and their underlying continuum. Indeed, point sources detected by Chandra (among them two ULXs, Strateva & Komossa (2008); Soria et al. (2009)) contribute around two thirds of the overall integrated soft X-ray flux. In principle, one could sum up the spectra of these sources, and subtract their contribution to the RGS spectrum. However, given the fact that the XMM-Newton and Chandra observations are not simultaneous, and that these sources are highly variable (Soria et al. (2009)), the outcome of this exercise would be merely academic.
An important additional information instrumental to the interpretation of the RGS spectra comes from ACIS spatially-resolved spectroscopy. In Fig. 8 we compare the best-fit

total ACIS spectrum with a spectrum extracted from the same area once a 1″ region around the nucleus is excised from the spectral accumulation. The main deviations occur once again at the wavelength of the Ovii He- triplet and at short wavelengths. The former evidence suggests the the bulk of the photoionised plasma traced by the He- emission lines is located within the nucleus unresolved by Chandra. The latter piece of evidence suggests that the overall temperature of the collisionally ionised diffuse emission increases approaching to the centre. However, formal fits with a photoelectrically absorbed apec component to the two spectra confirms only marginally this hint (Tab. 4). Only 10% of the total
| “Total” | “No AGN” | |
| (1020 cm-2) | ||
| (eV) | ||
| a | ||
| / dof | 77.5/86 | 72.6/73 |
ain the 0.3–2 keV band in units of erg cm-2 s-1
soft X-ray emission is associated in this galaxy to the unresolved nucleus, by contrast to what typically observed on AGN-dominated Seyfert 2 galaxies (Bianchi et al. (2006)).
6 Discussion
NGC 1365 is the brightest Seyfert 2 known, whose soft X-ray spectrum is energetically dominated by emission from a collisionally ionised plasma. This component is most likely associated to intense episodes of star formation occurring in its nuclear environment. The analysis of the RGS spectrum presented in this paper has provided the first proof of the statement above, while at the same time discovering the signatures of photoionised plasma. NGC 1365 is therefore also in X-rays a privileged laboratory to study the connection between nuclear activity and nuclear star formation.
In this section, we put the above results in the overall context of the soft X-ray emission of Seyfert 2 galaxies.
6.1 NGC 1365: the paradigm of soft X-ray weak obscured AGN
In none of the four good quality soft X-ray high-resolution spectra of nearby AGN222NGC 1068, Mkn 3, the Circinus Galaxy and NGC 4151 the contribution of collisionally ionised plasma is significant. Whenever good quality spectra can be measured, they appear dominated by photoionisation, most likely due to the AGN, whose primary emission illuminates the NLR gas through absorption-free lines-of-sight (Kinkhabwala et al. (2002); Sako et al. (2000); Sambruna et al. (2001); Armentrout et al. (2007)). In NGC 1068, by far the brightest obscured AGN of the soft X-ray sky, the contribution of a collisionally ionised plasma is constrained to be of the integrated 0.3–2 keV flux (Brinkman et al. (2002)).
Are the soft X-ray spectra of bright Seyfert 2 galaxies representative of the whole parent population of nearby obscured AGN? GB07 showed that the distribution of line ratios in their sample of 69 Seyfert 2s observed by the XMM-Newton RGS is fairly uniform with only a few exceptions, NGC 1365 being the most significant of them. However, the statistical quality of line measurements in each individual RGS spectrum is rather low, except for a few lines in a few sources. Nonetheless, GB07 discovered an empirical criterion, which allows us to separate on a statistical basis the soft X-ray spectra of the CIELO Seyfert 2 galaxies from those of a control sample of starburst galaxies: the latter occupy a specific region in a plane where the integrated luminosity in oxygen lines and the ratio between the intensity of the Oviii Ly- and the forbidden component of the Ovii He- are plotted (Fig. 6 in their paper). We present a slightly clearer version of that Figure in Fig. 9,
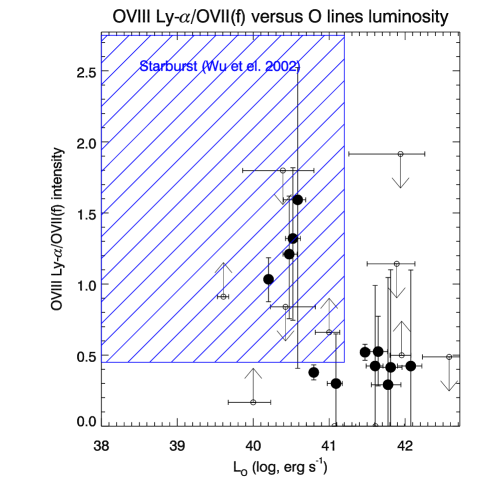
based on a re-analysis of 92 Seyfert 2 galaxies with the same method and procedure described in GB07. Most of CIELO objects are characterised by high oxygen luminosities ( erg s-1) and low Oviii versus Ovii ratio (). The starburst control sample of Wu et al. (2002) nicely occupies a complementary region in this plot.
There are a few Seyfert 2 outliers, i.e. objects characterised by low oxygen luminosities and high Oviii versus Ovii ratios. They are: NGC 1365, NGC 4303, NGC 5506, and NGC 7582. Apart from NGC 1365, NGC 4303 and NGC 7582 are well known to host intense episode of star formation close to the nucleus (Bianchi et al. (2007) and references therein), which in NGC 4303 dominate the UV and soft X-ray energy output (Jiménez-Bailón et al. (2003)). It is therefore tempting to identify these outliers with sources, whose soft X-ray spectrum is substantially “contaminated” by collisionally ionised optically thin emission associated to star formation.
One may try and make another step forward by adding together the information from all those spectra, whose individual data quality is not enough to warrant significant line detection. We do that by stacking together rest frame spectra of CIELO sources with total background counts in the range between 50 and 500. In Tab. 5
| Transition | Low oxygen-La | High oxygen-La |
|---|---|---|
| Fe xviii 3s2p | ||
| Fe xvii 3d2s | ||
| Fe xvii 3s2p | ||
| Fe xxi 3d2p | ||
| Ne ix He- (r) | ||
| Ne ix He- (i) | ||
| Ne ix He- (f) | ||
| N vi He- (r) | ||
| N vi He- (i) | ||
| N vi He- (f) | ||
| N vii Ly- | ||
| O viii Ly- | ||
| O viii Ly- | ||
| O vii He- (r) | ||
| O vii He- (i) | ||
| O vii He- (f) |
anormalised to the Ovii He- (f)
we show the normalised intensity of the emission lines detected in the stacked spectra for objects with total integrated oxygen lines luminosity smaller and higher then erg s-1. Errors in this Table are at 1-. Low-oxygen luminosity sources exhibit: a) stronger Fe-L lines; b) stronger recombination and intercombination transitions in He- triplets of Nexi and Nvi; c) stronger Ly- transitions of Oviii and Nevii All the above trends are consistent with a stronger role played by collisionally ionised plasmas in low-oxygen luminosity sources.
6.2 BLR shielding of the ionising continuum?
CIELO Seyfert 2 which are under-luminous in oxygen lines are not necessarily intrinsically low-luminous. If we consider those galaxies, which have a measurement of the Oviii Ly- versus Ovii(f) intensity ratio in Fig. 9, and exclude NGC 4303, where the presence of an AGN is still under debate (Jiménez-Bailón et al. (2003)): the absorption-corrected 2–10 keV luminosity is erg s-1 in NGC 1365 (Risaliti et al. 2009a ); 1.5–3.2 erg s-1 in NGC 7582 (Bianchi et al. 2009a ), and 4.5–9.1 erg s-1 in NGC 5506 (Bianchi et al. (2003)). NGC 1365 and NGC 7582 share another remarkable observational property: both exhibit extreme (by one order of magnitude) variability of the X-ray absorbing column density on timescales as short as 10 hours (Risaliti et al. 2009b ) and 1 day (Bianchi et al. 2009a ), respectively. Such rapid transitions from Compton-thin (transmission-dominated) to Compton-thick (reflection-dominated) states can be explained only if the X-ray absorbers are located at distances from the black hole comparable to that of the broad line region (BLR). It is intriguing to speculate that the relative weakness of the AGN photoionisation contribution in these objects, as well as the overall weakness of their soft X-ray emission lines, are due to shielding of the ionising high-energy AGN emission by optically thick matter in the BLR. In this respect, however, NGC 5506 does not seem to match this scenario. Large (by a factor of about 2) historical variation of the X-ray flux are accompanied by a very modest variability of the absorbing column density (Guainazzi et al., in preparation). The column density of NGC 5506 (Bianchi et al. (2003)) is also significantly smaller than measured even in the Compton-thinnest states of NGC 1365 and NGC 7582 (2.5 cm-2). It is still possible that such a small column density is associated to matter in the host galaxy rather than in the nuclear environment (Piconcelli et al. (2007); Matt et al. (2003)), and that the ENLR gas is looking at the AGN trough a different optical path where obscuration of the active nucleus is substantially high. As already pointed out by several authors, we are only now starting to glimpse the true complexity of the gas and dust distribution in the innermost parsec around supermassive black holes (Elvis (2000); Risaliti et al. 2005b ; Elitzur & Shloshman (2006)).
6.3 Properties of the photoionised plasma in NGC 1365
It is impossible to significantly constraint the properties of the photoionised plasma responsible for the bulk of the forbidden component of He-like triplets in the RGS spectrum of NGC 1365. With the assumed SED: (1), cm-3, and cm-2. From the best-fit CLOUDY solution (Sect. 4.2), and using the definition of ionisation parameter, we estimate that the inner side of the photoionised nebula is constrained to be located pc from the source of the ionising photons. This is still consistent with a location of this gas within the BLR. However, it is not consistent with the soft X-ray photoionised gas being the same responsible for the highly ionised, outflowing iron absorption lines discovered by XMM-Newton (Risaliti et al. 2005a ), and probably associated to a disk outflow. The width of the oxygen RRC features constrains the gas temperature to be 105 K, of the same order of magnitude as the temperature measured in NGC 1068 (Kinkhabwala et al. (2002)) or other CIELO AGN (GB07). The only He-like ion, for whose He- triplet meaningful constraints on the diagnostic parameters and (Porquet & Dubau (2000)) can be derived is Ovii. The latter is primarily sensitive to density. implies , in agreement with the results of the comparison between Cloudy simulations and the RGS line spectrum. On the other hand, translates into a loose constraints on the photoionised plasma temperature, K, again in agreement with the RRC-based diagnostic.
6.4 Properties of the collisionally ionised plasma in NGC 1365
A formally good fit to the RGS spectrum of NGC 1365 requires two optically thin, collisionally ionised thermal components with temperatures 300 eV and 640 eV. These values should not be interpreted too literally, though. The best-fit temperature is mainly driven by the fit of the emission line strength and position. The tightest constraints are provided by the strongest lines, which are mostly emitted at 0.3 keV (e.g: oxygen and neon lines) and 0.7 keV (Mg lines). Gas at various other temperatures may be also present, however it could not get the same weight in the fitting process because it does not emit as strongly in those lines. It is likely that this results should be interpreted as a distribution of temperature over the nominal best-fit range.
Our analysis qualitatively confirms the results by Wang et al. (2009) that the gas in the circumnuclear environment of NGC 1365 has an overall very low metallicity. However, RGS lacks spatial resolution matching the complex morphology of metal abundances in the NGC 1365 nuclear ambient gas. Besides the overall metal under-abundance, regions of silicon and iron over-abundance were discovered by Chandra (Wang et al. (2009)). Moreover, the high Equivalent Width of the relativistically broadened iron Kα line measured by the XMM-Newton EPIC (Risaliti et al. 2009a ) is also consistent with a factor of about three iron overabundance.
Gas in the spiral arm of the galaxy should be have an even lower metallicity. At the same time, NGC 1365 has a high number of ULX in its disk (Soria et al. (2009)). These pieces of evidence are consistent with a scenario, whereby ULXs are black hole remnants of very metal-poor () stars, which little mass in their winds ().
Does NGC 1365 host a more luminous starburst when compared with obscured AGN of comparable intrinsic AGN power? In Fig. 10 we plot the flux of the
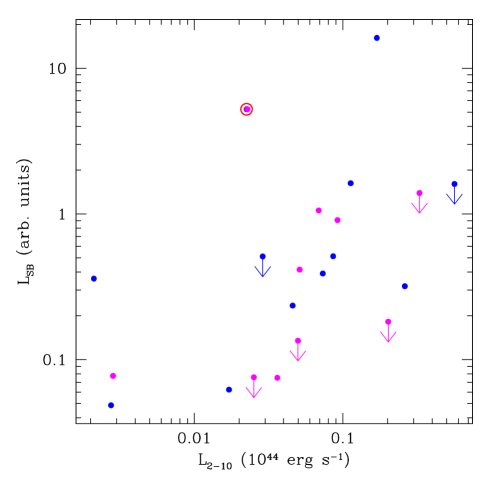
PAH feature at 6.2 as measured by Spitzer as a function of the unobscured 2–10 keV luminosity as measured by CAIXA (Bianchi et al. 2009b ) in a sample of obscured and unobscured local Universe AGN. PAH features are a strong indicator of star formation in active galaxies (see, e.g., Lutz et al. (2008) and references therein). NGC 1365 is the second brightest PAH AGN in the sample after NGC 7469; the latter is well known to exhibit an extremely bright starburst at distances between tens to about 103 of parsecs from the AGN (Díaz-Santos et al. (2007)).
7 Conclusions and summary
In this paper we primarily discuss the 0.5 Ms RGS spectrum of the Seyfert 2 galaxy NGC 1365. The main results of our analysis can be summarised as follows:
-
•
no variability either in the overall spectral shape or in the line intensity is detected when comparing observations distant up to five years apart
-
•
the spectrum is dominated by emission lines from optically thin, collisionally ionised plasma, plus a strong continuum primarily in the 10–20 Å range. Formally, a good fit is obtained with two components, with temperatures 300 eV and 640 eV, the latter seen through a photoelectric absorption column density cm-2. These results are in broad agreement with the range of temperatures and column densities measured by spatially resolved moderate resolution spectroscopy of this galaxy with Chandra (Wang et al. (2009))
-
•
the RGS spectrum confirms the suggestion by Chandra that on the average sub-solar metallicities are required to fit the data, although the unknown level of contamination by individual point-like sources makes the exact measurements of metallicities from the RGS spectrum uncertain
-
•
a residual contribution by a photoionised plasma is required to fit the forbidden component of He-like transitions of oxygen and nitrogen, as well as the intercombination component of Ovii. The physical parameters of the photoionised plasma can be only loosely constrained: 1.6, cm-3, and cm-2, and correspond to a plasma at a distance pc. The detection of oxygen RRC features suggests a photoionised temperature 105 K, in agreement with values typically observed in AGN-dominated Seyfert 2 galaxies.
Despite its comparably low luminosity in soft X-ray lines with respect to AGN-photoionisation dominated Seyfert 2 galaxies, NGC 1365 is not intrinsically X-ray weak. We speculate that the soft X-ray spectrum NGC 1365 could appear as starburst-dominated due to shielding of the primary AGN ionising continuum by optically thick matter associated to the BLR, a scenario which may apply to other AGN (such as NGC 7582), which exhibit extreme and rapid variability of the absorber column density. Good-quality soft X-ray spectra of “changing-look” AGN would be crucial to test this hypothesis. Alternatively, NGC 1365 could host a remarkably luminous nuclear starburst when compared to its AGN accretion power, as suggested by the luminous PAH features detected in its Spitzer spectra.
Acknowledgements.
Based on observations obtained with XMM-Newton, an ESA science mission with instruments and contributions directly funded by ESA Member States and NASA This research has made use of data obtained through the High Energy Astrophysics Science Archive Research Centre Online Service, provided by the NASA/Goddard Space Flight Centre and of the NASA/IPAC Extragalactic Database (NED) which is operated by the Jet Propulsion Laboratory, California Institute of Technology, under contract with the National Aeronautics and Space Administration. A careful reading of the original manuscript by an anonymous referee is gratefully acknowledged.References
- Anders & Grevesse (1989) Anders E. & Grevesse N., 1989, Geochimica et Cosmochimica Acta 53, 197
- Armentrout et al. (2007) Armentrout B.K., Kramer S.B., Turner T.J., 2007, ApJ, 665, 237
- Arnaud (1996) Arnaud, K.A., 1996, Astronomical Data Analysis Software and Systems V, eds. Jacoby G. and Barnes J., 17, ASP Conf. Series volume 101.
- Axon et al. (1998) Axon D.J., Marconi A., Capetti A., Macchetto F.D., Schreier E., Robinson A., 1998, ApJ, 496, L75
- Bennert et al. (2006) Bennert N., Jungwiert B., Komossa S., Haas M., Chini R., 2006, A&A, 456, 953
- Bianchi et al. (2003) Bianchi S., Balestra I., Matt G., Guainazzi M., Perola G.C., 2003, A&A, 402, 141
- Bianchi et al. (2007) Bianchi S., Chiaberge M., Piconcelli E., Guainazzi M., 2007, MNRAS, 374, 697
- Bianchi et al. (2006) Bianchi S., Guainazzi M., Chiaberge M., 2006, A&A, 448, 499
- (9) Bianchi S., Piconcelli E., Chiaberge M., Jiménez-Bailón E., Matt G., Fiore F., 2009a, ApJ, 695, 781
- (10) Bianchi S., Guainazzi M., Matt G., Fonseca Bonilla N., Ponti G., A&A, 2009b, 495, 421
- Borkowski et al. (2001) Borkowski K.J., Lyerly W.J., Reynolds S.P., 2001, ApJ, 548, 820
- Bradley et al. (2004) Bradley L.D., Kaiser M.E., Baan W.A., 2004, ApJ, 603, 463
- Brinkman et al. (2002) Brinkman A.C., Kaastra J.C., van der Meer R.J.L., Kinkhabwala A., Behar E., Kahn S., Pearels F.B.S., Sako M., 2002, A&A, 396, 761
- Capetti et al. (1996) Capetti A., Axon D.J., Macchetto F., Sparks W.B., Boksenberg A., 1996, ApJ, 469, 554
- Das et al. (2006) Das V., Crenshaw D.M., Kraemer S.B., Deo R.P., 2006, AJ, 132, 620
- den Herder et al. (2001) den Herder J., et al., 2001, A&A, 365, L7
- Díaz-Santos et al. (2007) Díaz-Santos T., Alonso-Herrero A., Colina L., Ryder S.D., Knapen J.H., 2007, ApJ, 661, 149
- Elitzur & Shloshman (2006) Elitzur M. & Sholshman I., 2006, ApJ, 648, L101
- Elvis (2000) Elvis M., 2000, ApJ, 545, 63
- Ferland et al. (1998) Ferland G. J., Korista K.T., Verner D.A., Ferguson J.W., Kingdon J.B., Verner E.M., 1998, PASP, 110, 761
- Ferland & Osterbrock (1986) Ferland G.J., Osterbrock D.E., 1986, ApJ, 300, 658
- Gabriel et al. (2003) Gabriel C., Denby M., Fyfe D. J., Hoar J., Ibarra A., 2003, in ASP Conf. Ser., Vol. 314 Astronomical Data Analysis Software and Systems XIII, eds. F. Ochsenbein, M. Allen, & D. Egret (San Francisco: ASP), 759
- Galliano et al. (2005) Galliano E., Alloin D., Pantin E., Lagage P.O., Marco O., 2005, A&A, 438, 803
- Galliano et al. (2008) Galliano E., Alloin D., Pantin E., et al., 2008, A&A, 492, 3
- Grimm et al. (2003) Grimm H.-J., Gilfanov M., Sunyaev R., 2003, MNRAS, 339, 793
- Guainazzi & Bianchi (2007) Guainazzi M., Bianchi S., 2007, MNRAS, 374, 1290 (GB07)
- Hjelm & Lindblad (1996) Hjelm M., Lindblad P.O., 1996, A&A, 305, 727
- Kalberla et al. (2005) Kalberla P.M.W., Burton W.M., Hartmann D., et al., 2005, A&A, 440. 775
- Kinkhabwala et al. (2002) Kinkhabwala A., Sako M., Behar E., et al., 2002, ApJ, 575, 732
- Kraemer et al. (2000) Kraemer S.B., Crenshaw D.M., Hatchings J.B., et al., 2000, ApJ, 531, 278
- Kraemer et al. (2008) Kraemer S.BN., Schnitt H.R., Crenshaw D.M., 2008, ApJ, 679, 1128
- Kristen et al. (1997) Kristen H., Jorsater S., Lindblad P.O., Boksenberg A., 1997, A&A, 328, 483
- Jiménez-Bailón et al. (2003) Jiménez-Bailón E., Santos–LLeo M., Mas-Hesse M., et al., 2003, ApJ, 593, 127
- Lampton et al. (1976) Lampton M., Margon B., Bowyer S., 1976, ApJ, 207, 894
- Liedahl et al. (1995) Liedahl D.A., Osterheld A.L., Goldstein W.H., 1985, ApJL, 438, 115
- Longinotti et al. (2008) Longinotti A.L., Nucita A., Santos–LLeo M., Guainazzi M., 2008, A&A, 484, L311
- Lutz et al. (2008) Lutz D., Sturm E., Tacconi L.J., et al., 2008, ApJ, 684, 753
- Maiolino & Rieke (1995) Maiolino R., Rieke G.H., 1995, ApJ, 454, 95
- Mass-Hesse et al. (2008) Mas-Hesse J.M., Otí-Floranes H., Cerviño M., 2008, A&A, 483, 71
- Matt et al. (2003) Matt G., Bianchi S., Guainazzi M., et al., 2003, A&A, 399, 519
- Mewe et al. (1985) Mewe R., Gronenschild E.H.B.M., van der Oord G.H.J., 1985, A&AS, 62, 197
- Osterbrock (1989) Osterbrock D.E., 1989, Astrophysics of Gasous Nebulae and Active Galactic Nuclei (University Science Books: Mill Valley)
- Persic & Raphaeli (2002) Persic M., Raphaeli Y., 2002, A&A, 382, 843
- Piconcelli et al. (2007) Piconcelli E., Bianchi S., Guainazzi M., Fiore F., Chiaberge M., 2007, A&A, 466, 855
- Plucinsky et al. (2008) Plucinsky P., Haberl F., Dewey D., et al., 2008, SPIE, 7011, 68
- Pogge (1988) Pogge R.W., 1988, ApJ, 328, 519
- Porquet & Dubau (2000) Porquet D., Dubau J., 2000, A&AS, 143, 495
- (48) Risaliti G., Bianchi S., Matt G., et al., 2005a, ApJ, 630, L129
- (49) Risaliti G., Elvis M., Fabbiano G., Baldi A., Zezas A., 2005b, ApJ, 623, L93
- Risaliti et al. (2007) Risaliti G., Elvis M., Fabbiano G., Baldi A., Zezas A., Salvati M., 2007, ApJ, 659, L111
- Risaliti et al. (2000) Risaliti G., Maiolino R., Bassani L., 2000, A&A 356, 33
- (52) Risaliti G., Miniutti G., Fabbiano G., et al., 2009a, ApJ, 696, 160
- (53) Risaliti G., Salvati M., Elvis M., et al., 2009b, MNRAS, 393, L1
- Sakamoto et al. (2007) Sakamoto K., Ho P.T., Mao R.-Q., Matsushita S., Peck A.B., 2007, ApJ, 654, 782
- Sako et al. (2000) Sako M., Kahn S.M., Paerels F., Liedahl D.A., 2000, ApJL 543, L115
- Sambruna et al. (2001) Sambruna R., Netzer H., Kaspi S., Brandt W.N., Chartas G., Garmire G.P., Nousek J.A., Weaver K.A., 2001, ApJ, 546, L13
- Sandqvist et al. (1995) Sandqvist A., Joersaeter S., Lindblad P.O., 1995, A&A, 295, 585
- Silbermann et al. (1999) Silbermann N.A., Harding P., Ferrarese L., et al., ApJ, 515, 1
- Soria et al. (2009) Soria R., Risaliti G., Elvis M., Fabbiano G., Bianchi S., Kuncic Z., 2009, ApJ, 695, 1614
- Smith et al. (2001) Smith R.K., Brickhouse N.S., Liedahl D.A., Raymond J.C., 2001, ApJ, 556, 91
- Strateva & Komossa (2008) Strateva I.V., Komossa S., 2009, ApJ, 692, 443
- Tadhunter & Tsvetanov (1989) Tadhunter C., Tsvetanov Z., 1989, Nature, 341, 422
- Turner et al. (1993) Turner T.J., Urry C.M., Mushotzky R.F., 1993, ApJ, 418, 653
- Ulvestad & Ho (2001) Ulvestad J.S., Ho L.C., 2001, ApJ, 558, 561
- Veron et al. (1980) Veron P., Lindblad P.O., Zuiderwijk E.J., Veron M.P., Adam G., 1980, A&A, 87, 245
- Viegas-Aldrovandi & Contini (1989) Viegas-Aldrovandi S.M., Contini M., 1989, ApJ, 339, 689
- Veilleux et al. (2003) Veilleux S., Shopbell P.L., Rupke D.S., Bland-Hawthorn J., Cecil G., 2003, AJ, 126, 2185
- Young et al. (2001) Young A.J., Wilson A.S., Shopbell P.L., 2001, ApJ, 556, 6
- Wang et al. (2009) Wang J., Fabbiano G., Elvis M., et al. 2009, ApJ, 694, 718
- Whittle (1985) Whittle M., 1985, MNRAS, 213, 33
- Whittle (1992) Whittle M., 1992, ApJS, 79, 49
- Wilson et al. (2000) Wilson A.S., Shopbell P.L., Simpson C., Storchi-Bergmann T., Barbosa F.K.B., Warm M.J., 2000, AJ, 120, 1325
- Wilson & Willis (1980) Wilson A.S., Willis A.G., 1980, ApJ, 240, 429
- Wu et al. (2002) Wu W., Clayton G.C., Gordon K.D., Misselt K.A., Smoth T.L., Calzetti D., 2002, ApJS, 143, 377