The properties of the stellar populations in ULIRGs I: sample, data and spectral synthesis modelling.
Abstract
We present deep long-slit optical spectra for a sample of 36 Ultraluminous Infrared Galaxies (ULIRGs), taken with the William Herschel Telescope (WHT) on La Palma with the aim of investigating the star formation histories and testing evolutionary scenarios for such objects. Here we present the sample, the analysis techniques and a general overview of the properties of the stellar populations; a more detailed discussion will be presented in a forthcoming paper. Spectral synthesis modelling has been used in order to estimate the ages of the stellar populations found in the diffuse light sampled by the spectra in both the nuclear and extended regions of the target galaxies. We find that adequate fits can be obtained using combinations of young stellar populations (YSPs, t 2 Gyr), with ages divided into two groups: very young stellar populations (VYSPs, tVYSP 100 Myr) and intermediate-young stellar populations (IYSPs, 0.1 tIYSP 2 Gyr). Our results show that YSPs are present at all locations of the galaxies covered by our slit positions, with the exception of the northern nuclear region of the ULIRG IRAS 23327+2913. Furthermore, VYSPs are presents in at least 85% of the 133 extraction apertures used for this study, being more significant in the nuclear regions of the galaxies. Old stellar populations (OSPs, t 2 Gyr) do not make a major contribution to the optical light in the majority of the apertures extracted. In fact they are essential for fitting the spectra in only 5% (7) of the extracted apertures. The estimated total masses for the YSPs (VYSPs + IYSPs) are in the range 0.18 50 M⊙. We have also estimated the bolometric luminosities associated with the stellar populations detected at optical wavelengths, finding that they fall in the range 0.07 1012 L 2.2 1012 L⊙. In addition, we find that reddening is significant at all locations in the galaxies. This result emphasizes the importance of accounting for reddening effects when modelling the stellar populations of star-forming galaxies.
keywords:
Galaxies: evolution – galaxies: starburst.1 Introduction
The launch of the Infrared Astronomical Satellite (IRAS) in 1983 triggered a development of infrared astronomy that is still ongoing. Although the majority of the sources discovered by IRAS were modest infrared emitters, some objects had mid- to far-infrared (MFIR) luminosities comparable to the bolometric luminosities of optically-selected QSOs (Houck et al., 1984, 1985; Soifer, 1984a, b; Soifer et al., 1987). Such galaxies are classified as Luminous (L L⊙) or Ultraluminous ( L⊙) infrared galaxies (LIRGs/ULIRGs) depending on their MFIR luminosities.
The prodigious infrared emission of ULIRGs is generally attributed to the optical/UV light of luminous central sources reprocessed by dust. Several infrared spectroscopic studies have provided evidence that the power source of ULIRGs has a composite nature, with a mixture of AGN and starburst activity (Genzel et al., 1998; Lutz et al., 1999; Armus et al., 2007; Imanishi et al., 2007; Farrah et al., 2007). Similar conclusions are reached in the relatively few studies carried out at UV/optical (Veilleux et al., 1995; Veilleux et al., 1999; Farrah et al., 2003) and X-ray (Franceschini et al., 2001, 2003) wavelengths. Therefore these objects provide us with an excellent oportunity to study the links between AGN and starburst phenomena. In addition, ULIRGs are almost unvariably associated with galaxy mergers and interactions (e.g. Kim et al., 2002; Veilleux et al., 2002). Thus, they also represent ideal objects to test models of galaxy evolution via major galaxy mergers (e.g. Mihos & Hernquist, 1996; Barnes & Hernquist, 1996; Springel et al., 2005).
Stellar population studies have the potential to provide key information about the histories of the merger events asscoaited with ULIRGs. To date, two complementary approaches have been used to investigate the stellar populations in such objects: one based on photometric analysis of images of the galaxies taken at different wavelengths, focussed mainly on studying the young stellar populations associated with the bright knots (Surace et al., 1998; Surace & Sanders, 1999; Surace et al., 2000; Surace & Sanders, 2000; Wilson et al., 2006); the other comprising spectrocopic analysis of UV/optical spectra (Canalizo & Stockton, 2000a, b, 2001; Farrah et al., 2005; Rodríguez Zaurín et al., 2007, 2008). Overall, there have been relatively few studies of the stellar populations in ULIRGs. The existing studies mentioned above either concern relatively small samples of ULIRGs, or concentrate on high surface brightness regions which may give a misleading impression of the stellar populations of the systems as a whole.
To remedy this situation we have obtained deep, wide spectral coverage, intermediate-resolution long-slit spectroscopic observations for a sample of 36 ULIRGs with redshifts z 0.18 using the ISIS spectrograph on the WHT. With the aim of studing in detail the properties of the stellar populations in the ULIRGs in our sample, and thereby testing evolutionary scenarios, we model the spectra extracted from a series of apertures using a large number of different combinations of stellar populations synthesis model templates (Bruzual & Charlot, 2003). In this paper we present the sample and the spectral synthesis modelling results, while a more detailed analysis of the results is presented in the forthcoming paper (Rodríguez Zaurín et al., in prep). Detailed analyses of two of the objects in the sample, IRAS 13451+1232 (PKS1345+12) and IRAS 15327+2340 (Arp 220) were presented in Rodríguez Zaurín et al. (2007, hereafter RZ07) and Rodríguez Zaurín et al. (2008, hereafter RZ08) respectively.
Throughout this paper, we assume a cosmology with H0 = 71 km s-1 Mpc-1, , . All the values presented in this paper have been adapted to this cosmology.
2 Observations and data Reduction
2.1 The Sample
In the first place, we observed a complete RA- and declination-limited sub-sample of the Kim & Sanders (1998) 1 Jy sample of ULIRGs 111This is in itself a complete flux-limited sample of 118 ULIRGs identified from the IRAS Faint Source Catalogue (FSC) and selected to have a 60m flux densities greater than 1 Jy in a region of the sky with -40∘ and 30∘., with RAs in the range 12 RA 1:30 h, declinations -23 degrees, and redshifts z 0.13. The redshift limit was chosen to ensure that the objects are sufficiently bright for spectroscopic study, and also to keep the size of the sample tractable for deep observations on 4m class telescopes. Throughout the paper, we will refer to this sample of 26 objects as the complete sample (CS). Table 1 summarizes some of the properties of the ULIRGs in the CS.
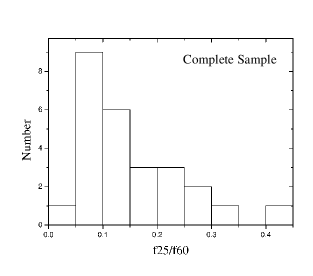
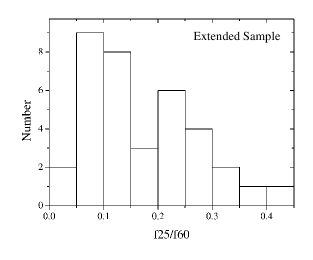
As shown in the table, only 8 ULIRGs with warm mid- to far-IR colours (f25/f60 0.2)222The quantities f25 and f60 represent the IRAS flux densities in Janskys at 25m and 60m. are included in the CS. However, one of the aims of the project was to study the presence of an evolutionary link between cool and warm ULIRGs. Therefore, we extended the sample to include 6 higher-redshift objects classified as warm ULIRGs: IRAS 13305-1739, IRAS 14252-1739, IRAS 16156+0146, IRAS 17044+6720, IRAS 23060+0505 and IRAS 23389+0303. In addition, since we also aim to test the evolutionary scenario in which ULIRGs evolve into QSOs or a radio galaxies (e.g. Surace et al., 1998; Surace & Sanders, 1999; Canalizo & Stockton, 2001; Tadhunter et al., 2005), we decided to include IRAS 17179+5444, which is classified as a cool ULIRG with a Sy2-like optical spectrum. Finally, three ULIRGs were included in the sample (IRAS 08572+3915, IRAS 10190+1322 and IRAS 10494+4424) which have redshifts z 0.13, but fall outside the RA range of the CS. One of them, IRAS 08572+3915, is classified as a warm ULIRG. Thus, the total sample discussed in this paper comprises 36 objects: 21 cool ULIRGs, and 15 warm ULIRGs. We will refer to this sample as the extended sample (ES). With an upper limiting redshift of z 0.18, the ES includes all the warm ULIRGs within the RA and declination range of the CS with redshifts z 0.15. Table 2 summarizes some of the properties of the 10 ULIRGs which, together with the CS, comprise the ES. Optical and near-IR images for all the objects in the ES are presented in Kim et al. (2002).
| Object Name | z | RA | DEC | log | f25/f60 | Nuclear | NS | IC | ST |
|---|---|---|---|---|---|---|---|---|---|
| IRAS | (J2000.0) | (J2000.0) | Lir | structure | (kpc) | ||||
| (L⊙) | |||||||||
| (1) | (2) | (3) | (4) | (5) | (6) | (7) | (8) | (9) | (10) |
| 00091–0738 | 0.118 | 00 11 43.4 | -07 22 06 | 12.23 | 0.08 | Double | 2.2 | IIIb | H |
| 00188–0856 | 0.128 | 00 21 26.0 | -08 39 29 | 12.37 | 0.14 | Single | – | V | L |
| 01004–2237 | 0.129 | 01 02 51.2 | -22 21 51 | 12.28 | 0.28 | Single | – | V | H |
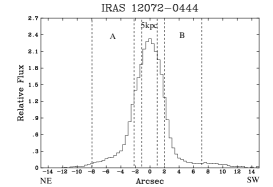
| 12072–0444a | 0.129 | 12 09 45.4 | -05 01 14 | 12.39 | 0.21 | Double | 2.8 | IVb | S2 |
| 12112+0305 | 0.073 | 12 13 47.3 | 02 48 34 | 12.32 | 0.06 | Double | 4.0 | IIIb | L |
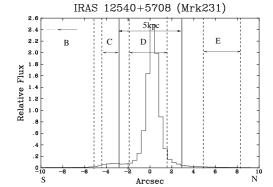
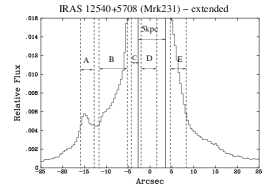
| 12540+5708 | 0.042 | 12 56 15.0 | 56 52 17 | 12.54 | 0.27 | Single | – | IVb | S1 |
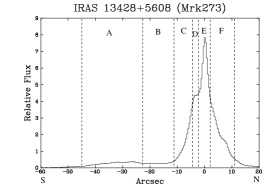
| 13428+5608a | 0.037 | 13 44 41.8 | 55 53 14 | 12.14 | 0.10 | Double | 0.7 | IVb | S2 |
| 13451+1232 | 0.122 | 13 47 33.3 | 12 17 24 | 12.32 | 0.35 | Double | 4.2 | IIIb | S2 |
| 13539+2920 | 0.108 | 13 56 10.9 | 29 05 29 | 12.04 | 0.06 | Double | 7.4 | IIIb | H |
| 14060+2919 | 0.117 | 14 .08 17.5 | 29 04 57 | 12.07 | 0.08 | Single | – | IVa | H |
| 14348–1447 | 0.083 | 14 37 37.3 | -15 00 20 | 12.32 | 0.07 | Double | 5.1 | IIIb | L |
| 14394+5332b | 0.105 | 14 41 04.3 | 53 20 08 | 12.08 | 0.17 | Multiple | 54.0 | Tpl | S2 |
| 15130–1958 | 0.109 | 15 15 55.6 | -20 09 18 | 12.09 | 0.20 | Single | – | IVb | S2 |
| 15206+3342 | 0.125 | 15 22 38.0 | 33 31 36 | 12.22 | 0.20 | Single | – | IVb | H |
| 15327+2340 | 0.018 | 15 34 57.1 | 23 30 10 | 12.21 | 0.07 | Double | 0.4 | IIIb | L |
| 15462-0450 | 0.100 | 15 48 56.6 | -04 59 36 | 12.21 | 0.15 | Single | – | IVb | S1 |
| 16474+3430 | 0.111 | 16 49 14.7 | 34 25 13 | 12.15 | 0.09 | Double | 6.9 | IIIb | H |
| 16487+5447 | 0.104 | 16 49 47.8 | 54 42 34 | 12.16 | 0.07 | Double | 5.7 | IIIb | L |
| 17028+5817 | 0.106 | 17 03 41.8 | 58 13 48 | 12.14 | 0.04 | Double | 24.6 | IIIa | L |
| 20414-1651 | 0.086 | 20 44 17.4 | -16 40 14 | 12.18 | 0.08 | Single | – | IVb | H |
| 21208–0519 | 0.130 | 21 23 28.7 | -05 06 59 | 12.05 | 0.13 | Double | 14.9 | IIIa | H |
| 21219–1757 | 0.112 | 21 24 42.5 | -17 44 40 | 12.10 | 0.42 | Single | – | IVa | S1 |
| 22491–1808 | 0.076 | 22 51 49.0 | -17 52 27 | 12.13 | 0.10 | Double | 2.4 | IIIb | H |
| 23233+2817 | 0.114 | 23 25 48.7 | 28 34 19 | 12.04 | 0.22 | Single | – | Iso. | S2 |
| 23234+0946 | 0.128 | 23 25 56.0 | 10 02 52 | 12.09 | 0.05 | Double | 7.8 | IIIb | L |
| 23327+2913 | 0.107 | 23 35 12.5 | 29 30 05 | 12.10 | 0.10 | Double | 24.0 | IIIa | L |
a Kim et al. (2002) classified these objects as single nucleus systems. However, a double nucleus structure is revealed in the studies of Dasyra et al. (2006a) and Scoville et al. (2000) for IRAS 12072-0444 and IRAS 13428+5608 respectively. These objects will be classified as double nucleus systems for the work presented here.
b This source is a multiple ( 2 nucleus) system. The two main components are separated 54 kpc, but the eastern component itself comprises two close nuclei.
| Object Name | z | RA | DEC | log | f25/f60 | Nuclear | NS | IC | ST |
|---|---|---|---|---|---|---|---|---|---|
| IRAS | (J2000.0) | (J2000.0) | Lir | structure | (kpc) | ||||
| (L⊙) | |||||||||
| (1) | (2) | (3) | (4) | (5) | (6) | (7) | (8) | (9) | (10) |
| 08572+3915 | 0.058 | 09 00 25.0 | 39 03 56 | 12.15 | 0.22 | Double | 6.0 | IIIb | L |
| 10190+1322 | 0.077 | 10 21 41.9 | 13 07 01 | 12.04 | 0.11 | Double | 5.9 | IIIb | H |
| 10494+4424 | 0.092 | 10 52 22.2 | 44 08 59 | 12.17 | 0.04 | Single | – | IVb | L |
| 13305–1739 | 0.148 | 13 33 15.2 | -17 55 01 | 12.25 | 0.33 | Single | – | V | S2 |
| 14252–1550 | 0.149 | 14 28 01.4 | -16 03 43 | 12.19 | 0.20 | Double | 8.8 | IIIb | L |
| 16156+0146 | 0.132 | 16 18 08.2 | 01 39 21 | 12.08 | 0.24 | Double | 8.0 | IIIb | S2 |
| 17044+6720 | 0.135 | 17 04 28.5 | 67 16 34 | 12.17 | 0.28 | Single | – | IVb | L |
| 17179+5444 | 0.147 | 17 18 55.1 | 54 41 50 | 12.24 | 0.14 | Single | – | IVb | S2 |
| 23060+0505 | 0.173 | 23 08 34.2 | 05 21 29 | 12.48 | 0.37 | Single | – | IVb | S2 |
| 23389+0303 | 0.145 | 23 41 31.1 | 03 17 31 | 12.13 | 0.28 | Double | 5.2 | IIIb | S2 |
 |
 |
 |
 |
 |
 |
 |
 |
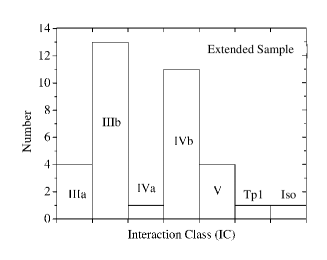 |
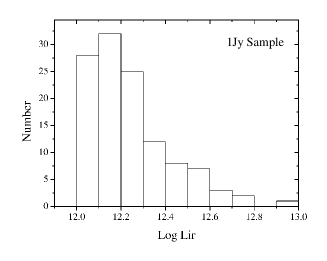
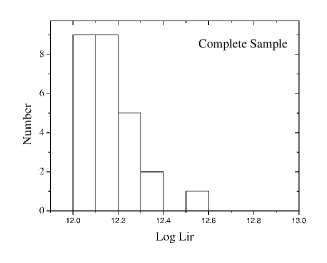
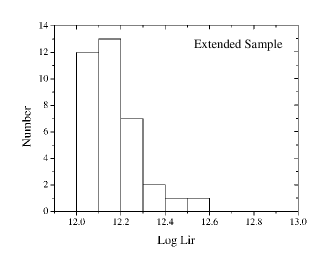
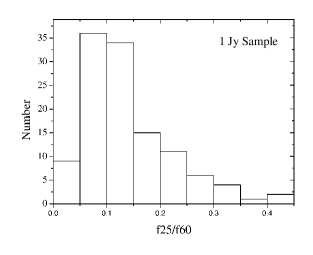
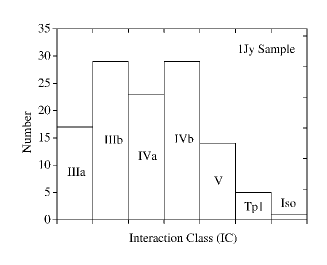
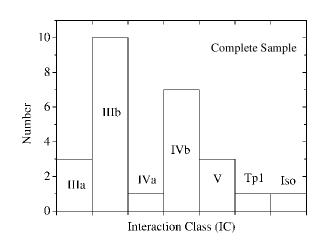
Figure 1 presents histograms comparing the full 1Jy sample, the CS and the ES in terms of IR-luminosity, f25/f60 flux ratio and morphological type distributions, respectively. The upper panel shows that both the CS and the ES are representative of the 1Jy sample in terms of IR-luminosities, while the middle panel of the figure shows that, as expected, the ES is biased towards objects classified as warm ULIRGs (f25/f 0.2). Using the morphological classification scheme described in Veilleux et al. (2002), the lower panel in Figure 1 shows the distribution of the different morphological types of the objects comprising each sample. To summarize (see Veilleux et al., 2002, for further details), the different classes are: class I (first approach), class II (first contact), class III (pre-merger), class IV (merger), class V (old merger), Tpl (triple) and Iso (Isolated). As is clear in the figure, both the CS and the ES samples account for most of the morphological types of objects found in the full 1 Jy sample, with the exception of those classified as IVa333In the Veilleux et al. (2002) morphological classification, objects classified as IVa are those with prominent tidal features and diffuse extended central regions, but only one nucleus.. This is due to the fact that all but 4 of the IVa sources in the 1 Jy sample are at redshifts z 0.13 (one of these 4 sources, IRAS 14060+2919, is included in the CS), and the objects in the CS are selected at low (z 0.13) redshifts. In addition, among the 23 objects classified as IVa in the 1Jy sample, only one is classified as a warm ULIRG, and therefore, these objects were not selected, a priori, to be observed and included in the ES. To summarize, the CS and the ES samples are representative of ULIRGs in the local universe, although the ES contains a higher proportion of warm objects.
2.2 Optical spectroscopy
Long-slit spectra of all the objects in the ES were taken in July 2005, December 2005 and May/July 2006, with the ISIS dual-beam spectrograph on the 4.2-m William Herschel Telescope (WHT), on La Palma, Spain. With the exception of IRAS 22491-1808, described below, we used the R300B grating with the EEV12 CCD, and the R316R grating with the MARCONI2 CCD on the blue and the red arm respectively, along with a dichroic cutting at 5300 Å. A 22 binning mode was used during the observations, leading to a final spatial scale of 0.4 arcsec/pix for both arms, and a dispersion of 1.72 Å/pix in the blue and 1.65 Å/pix in the red arm. The observed useful wavelength range is 3300 – 7800 Å. A slit of width 1.5 arcsec was used for all the objects in the ES. In the case of IRAS 22491-1808, the settings in the blue arm were the same as described above. However, on the red arm, the R600R grating with the MARCONI2 CCD was used, with 22 binning mode. The final spatial scale was 0.4 arcsec/pixel and the dispersion was 0.89 Å/pixel. The observed useful wavelength range is 3300 – 7100 Å. Details of the observations for all the objects included in the ES are presented in Table 3.
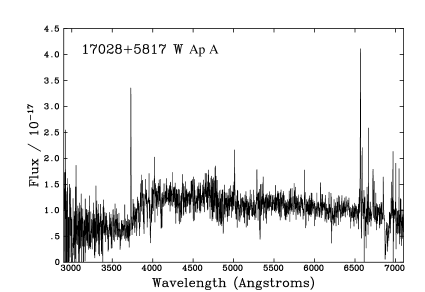
The position angles (PA) of the slit were carefully selected to cover the main features of the objects (nuclei,tidal tail, bridges, knots). In order to minimize the effects of differential atmospheric refraction, the objects were observed either along parallactic angle or at small airmass (AM 1.1). For those objects with a double nucleus structure, the slits covered both nuclei, with the exceptions of IRAS 08572+3915 and PKS 1345+12, for which it was not possible to observe the object at the parallactic angle and we did not have sufficient time to observe both nuclei during the night of the observations. In the cases of the double nucleus objects IRAS 16487+5447 and IRAS 17028+5817, because of the parallatic angle constraints, the two nuclei in each system were observed with separate slit PAs.
| Object name | PA | Arm | Exposure | Airmass | Seeing FWHM |
|---|---|---|---|---|---|
| IRAS | (s) | (arcsec) | |||
| (1) | (2) | (3) | (4) | (5) | (6) |
| 00091-0738 | 0 | B | 2700 | 1.24 | 1.2 |
| R | 2700 | 1.24 | 1.2 | ||
| 00188-0856 | 332 | B | 2100 | 1.33-1.37 | 1.3 |
| R | 2100 | 1.33-1.37 | 1.3 | ||
| 01004-2237 | 352 | B | 2100 | 1.60 | 2.8 |
| R | 2100 | 1.60 | 2.8 | ||
| 08572+3915 | 265 | B | 3600 | 1.14-1.32 | 1.3 |
| R | 3600 | 1.14-1.32 | 1.3 | ||
| 10190+1322 | 64 | B | 3600 | 1.04 | 1.2 |
| R | 3600 | 1.04 | 1.2 | ||
| 10494+4424 | 167 | B | 3600 | 1.03-1.07 | 1.2 |
| R | 3600 | 1.03-1.07 | 1.2 | ||
| 12072-0444 | 45 | B | 2700 | 1.30-1.42 | 1.1 |
| R | 2700 | 1.30-1.42 | 1.1 | ||
| 12112-0305 | 15 | B | 2700 | 1.11 | 1.2 |
| R | 2700 | 1.11 | 1.2 | ||
| 12540+5708 | 180 | B | 2700 | 1.13 | 0.7 - 1.6 |
| R | 2700 | 1.13 | 0.7 - 1.6 | ||
| 13305-1739 | 342 | B | 2700 | 1.53-1.62 | 1.7 |
| R | 2700 | 1.53-1.62 | 1.7 | ||
| 13428+5608 | 180 | B | 2700 | 1.12 | 1.7 |
| R | 2700 | 1.12 | 1.7 | ||
| 13451+1232 | 160 | B | 3600 | 1.05 | 1.3 |
| R | 3600 | 1.05 | 1.3 | ||
| 230 | B | 3600 | 1.1 | 1.7 | |
| R | 3600 | 1.1 | 1.7 | ||
| 13539+2920 | 285 | B | 2700 | 1.01 | 1.1 - 1.6 |
| R | 2700 | 1.01 | 1.1 - 1.6 | ||
| 14060+2919 | 83 | B | 2700 | 1.06-1.11 | 0.9 - 1.3 |
| R | 2700 | 1.06-1.11 | 0.9 - 1.3 | ||
| 14252-1550 | 40 | B | 2700 | 1.63-1.82 | 0.8 |
| R | 2700 | 1.63-1.82 | 0.8 | ||
| 14348-1447 | 35 | B | 2700 | 1.61-1.80 | 1.4 - 2.1 |
| R | 2700 | 1.61-1.80 | 1.4 - 2.1 | ||
| 14394+5332 | 92 | B | 3600 | 1.47-1.70 | 1.6 |
| R | 3600 | 1.47-1.70 | 1.6 | ||
| 15130-1958 | 358 | B | 2700 | 1.53 | 0.8 - 1.1 |
| R | 2700 | 1.53 | 0.8 - 1.1 | ||
| 15206+3342 | 90 | B | 2700 | 1.23-1.28 | 0.9 - 1.8 |
| R | 2700 | 1.23-1.28 | 0.9 - 1.8 | ||
| 15327+2340 | 160 | B | 2700 | 1.03-1.07 | 1.3 - 2.0 |
| R | 2700 | 1.03-1.07 | 1.3 - 2.0 | ||
| 75 | B | 2700 | 1.14-1.19 | 0.6 | |
| R | 2700 | 1.14-1.19 | 0.6 | ||
| 75* | B | 3600 | 1.27-1.46 | 0.7 | |
| R | 3600 | 1.27-1.46 | 0.7 | ||
| 15462-0450 | 10 | B | 2700 | 1.2 | 1.6 |
| R | 2700 | 1.2 | 1.6 | ||
| 16156+0146 | 313 | B | 2700 | 1.16-1.21 | 1.2 - 1.7 |
| R | 2700 | 1.16-1.21 | 1.2 - 1.7 | ||
| 16474+3430 | 166 | B | 2700 | 1.01 | 1.0 |
| R | 2700 | 1.01 | 1.0 | ||
| 16487+5447NE | 110 | B | 2700 | 1.12 | 1.2 |
| R | 2700 | 1.12 | 1.2 | ||
| 16487+5447NW | 165 | B | 2700 | 1.26-1.32 | 1.1 |
| R | 2700 | 1.26-1.32 | 1.1 |
| Object name | PA | Arm | Exposure | Airmass | Seeing |
|---|---|---|---|---|---|
| IRAS | (s) | (arcsec) | |||
| (1) | (2) | (3) | (4) | (5) | (6) |
| 17028+5817NE | 130 | B | 2700 | 1.23-1.28 | 1.2 |
| R | 2700 | 1.23-1.28 | 1.2 | ||
| 17028+5817NW | 110 | B | 2700 | 1.31-1.39 | 0.9 |
| R | 2700 | 1.31-1.39 | 0.9 | ||
| 17044+6720 | 160 | B | 2700 | 1.20-1.29 | 1.4 - 1.9 |
| R | 2700 | 1.20-1.29 | 1.4 - 1.9 | ||
| 17179+5444 | 122 | B | 2700 | 1.22-1.28 | 0.9 |
| R | 2700 | 1.22-1.28 | 0.9 | ||
| 20414-1651 | 5 | B | 2700 | 1.42 | 1.4 - 1.7 |
| R | 2700 | 1.42 | 1.4 - 1.7 | ||
| 21208-0519 | 15 | B | 2700 | 1.20 | 1.2 |
| R | 2700 | 1.20 | 1.2 | ||
| 21219-1757 | 333 | B | 3600 | 1.54-1.67 | 1.5 |
| R | 3600 | 1.54-1.67 | 1.5 | ||
| 22491-1808 | 338 | B | 3600 | 1.54-1.58 | 1.0 - 1.5 |
| R | 3600 | 1.54-1.58 | 1.0 - 1.5 | ||
| 23060+0505 | 338 | B | 3600 | 1.09-1.13 | 0.7 |
| R | 3600 | 1.09-1.13 | 0.7 | ||
| 23233+2817 | 168 | B | 2100 | 1.00 | 1.2 |
| R | 2100 | 1.00 | 1.2 | ||
| 23234+0946 | 115 | B | 2700 | 1.06 | 1.1 |
| R | 2700 | 1.06 | 1.1 | ||
| 23327+2913 | 175 | B | 2700 | 1.00 | 1.7 |
| R | 2700 | 1.00 | 1.7 | ||
| 23389+0300 | 24 | B | 3600 | 1.12 | 0.7 |
| R | 3600 | 1.12 | 0.7 |
The data were reduced (bias subtracted, flat field corrected, cleaned of cosmic rays, wavelength calibrated and flux calibrated) and straightened before extraction of the individual spectra using the standard packages in IRAF and the STARLINK packages FIGARO and DIPSO. The wavelength calibration accuracy, measured as the mean shift between the measured and published (Osterbrock et al., 1996) wavelength of night-sky emission lines, is 0.35 Å for the blue spectra and 0.25 for the red spectra. No significant variations of these values were found for the observations of the objects comprising the sample used in this paper. The spectral resolutions, calculated using the widths of the night-sky emission lines (FWHM), are in the ranges of 3.4 – 6.03 Å and 4.44 – 5.84 Å for the blue and red arms, respectively.
Accurate relative flux calibration is vital for the purpose of this project, and therefore several (4 – 6) photometric standard stars were observed during each night of the observations. The relative flux calibration accuracy is estimated to be 5% over the entire useful spectral range (3300 – 7800 Å). This is confirmed by the excellent match between the fluxes in the overlapping region of the blue and red arm spectra.
3 Analysis
3.1 Aperture extraction
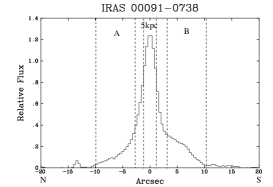
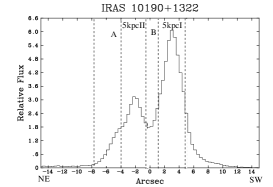
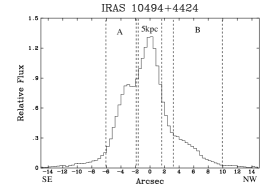
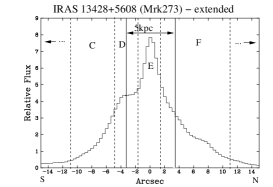
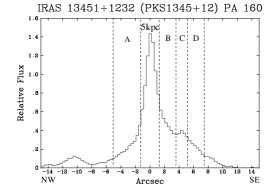
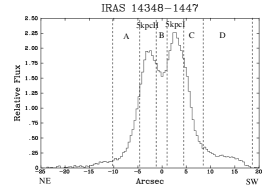
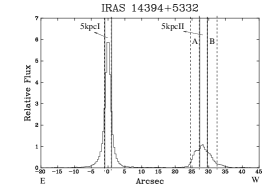
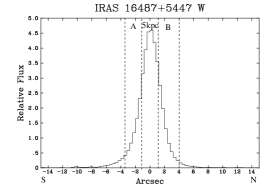
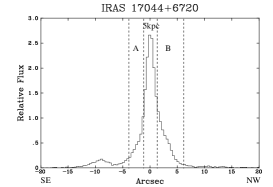
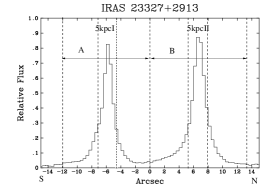
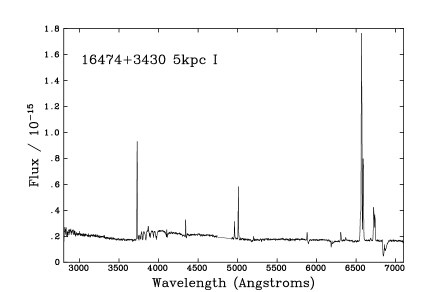
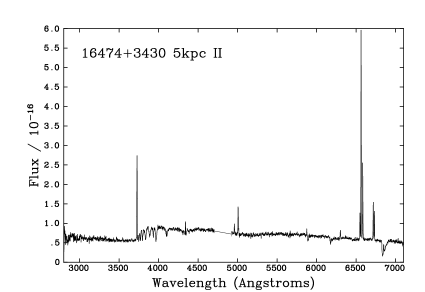
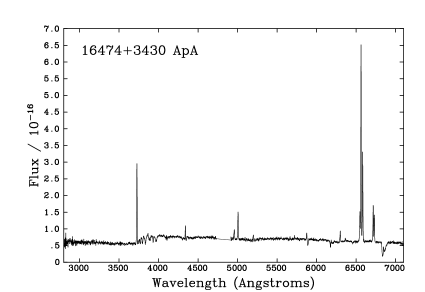
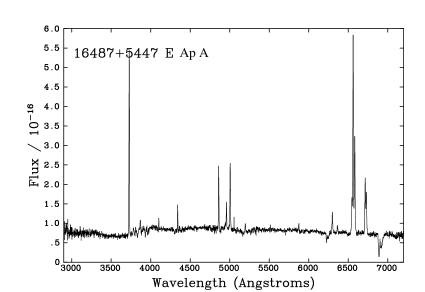
The relatively low redshifts of the objects in the ES, the wide spectral coverage, intermediate spectral resolution, excellent flux calibration and high S/N of the spectra, make it possible to perform detailed studies of their stellar populations. The extraction apertures were selected from spatial cuts of the 2-D frames in the line-free continuum wavelength range 4400 – 4600 Å, based on the visible extended structures and the requirement that the apertures are large enough to have a sufficiently high S/N ratio for further analysis. In order to compare the stellar populations between the objects in our sample, apertures with a metrical scale of 5kpc centred on the main nuclei were extracted for all the objects in the extended sample (ES), including separate extractions for multiple nuclei in individual sources. As mentioned before, a detailed analysis of the particular cases of IRAS 1341+1232 (PKS 1345+12) and IRAS 15327+2740 (Arp 220) can be found in RZ07 and RZ08 respecively. In the case of PKS 1345+12 the aperture labelled as ’NUC AP’ in the RZ07 paper has a metric scale of 5.2 kpc and, hereafter, we will refer to this as the 5kpc aperture for this galaxy. In the case of Arp 220, the closest object in the sample (z = 0.018, resulting in a scale of 0.363 kpc arcsec-1 and a distance of 77.6 Mpc), a 5 kpc aperture covers a large region of the slit and, therefore, was not selected a priori when performing the study presented in RZ08. In order to compare Arp 220 with the other ULIRGs included in the sample used for the work presented here, we used the slit with PA 160 and extracted a 5kpc aperture, as shown in Figure 2, sampling the central region of the galaxy (see Figure 1 in RZ08). A second set of apertures was then selected to sample the spatial features of those objects in the ES showing tails, bridges and other diffuse structures. A total of 133 apertures was extracted for the ULIRGs in the ES. Figure 2 shows the spatial profiles of the 2-D frames in the wavelength range 4400 – 4600 Å along with the extraction apertures.
The extracted spectra, in the rest frame, are shown in Figure 6. In the particular case of Arp220 we extracted a total of 24 apertures. As discussed in RZ08, the morphologies of the extracted spectra (and the properties of the stellar populations) are similar across the entire extent of the galaxy. Therefore, in Figure 6, we decided to show a representative sample of the whole set of extracted apertures. These are the apertures labelled as APTOTAL in Figure 2 for each of the slit PAs used for this galaxy (see RZ08 for more details).
3.2 Modelling technique
To study in detail the properties of the stellar populations we have modelled the full spectral range of the extracted spectra using the stellar population synthesis model templates of Bruzual & Charlot (2003). These spectra were created assuming an instantaneous burst of star formation, solar metallicity and using the Salpeter (1955) initial mass function (IMF) with lower and upper mass cut offs: mL = 0.1 M⊙ and mU = 100 M⊙ (see Tadhunter et al., 2005, for a justification of these assumption). On the other hand, ULIRGs have large gas and dust contents. Therefore, it is important to carefully account for reddening effects. Reddened synthetic spectra were created using the Calzetti et al. (2000) reddening law, appropriate for starburst galaxies, and also the Seaton (1979) reddening law, representing the Galactic extinction case. During this process, the intrinsic extinction was modelled using a foreground screen geometry. Overall, there is good consistency between results obtained with the two reddening laws, suggesting that the main results for the ULIRGs in the CS and the ES samples are not sensitive to the details of the reddening law assumed at optical wavelengths
Of the 133 extraction apertures, four sample the nuclear regions of Sy1 galaxies (5kpc and Ap D for Mrk 231, 5kpc for IRAS 15462-0405, and 5kpc in the case of IRAS 21219-1757) and, therefore, it was not possible to model the extracted spectra due to the strong AGN contamination. In addition, Ap A for IRAS 23233+2817 samples a region to the south of the nucleus, including the bright knot detected in the K-band image shown in Kim et al. (2002) (their Figure 1). Our extracted spectrum for this aperture shows that it is strongly contaminated by a Galactic M star (see Figure 3). Therefore no attempt was made to model the spectrum for this aperture.
Prior to the modelling, the spectra were corrected for Galactic reddening using the far-IR based maps of extinction by Schlegel et al. (1998). An additional potential contaminant of the stellar emission in the optical is the nebular continuum emission (e.g. Dickson et al., 1995). In order to account for this effect, we subtracted a nebular continuum for those apertures for which strong emission lines were detected, following the technique described in RZ07, i.e. we used H to generate the nebular continuum and considered two extreme cases: (i) maximum nebular continuum assuming no reddening of the emission-line region; (ii) zero nebular continuum, corresponding to high reddening. The final nebular continua were subtracted from the spectra prior to performing the modelling. The modelling was carried out for both the nebular-corrected and uncorrected spectra.
Overall, a total of 128 extraction apertures were modelled. To perform the fit, we have used the CONFIT code (see Robinson et al. 2000 and RZ08 for details) which assumes two stellar components plus a power-law in some cases. To summarize, the CONFIT approach consists of a direct fit to the overall continuum shape of the extracted spectra using a minimum technique. For each spectroscopic aperture, the flux is measured in several wavelength bins (typically 50 – 70) chosen to be as evenly distributed in wavelength as possible, and to avoid strong emission lines and atmospheric absoption features. A relative flux calibration error of 5% was assumed during the modelling. Models with 1 are deemed to provide an acceptable fit to the overall continua (see discussion in Tadhunter et al., 2005). From these, the best fitting models were selected based on a visual inspection of the fits to the detailed absorption features that have relatively little emission line contamination, such as high order Balmer lines, He I lines, CaII K 3934, G-band 4305, MgIb 5173 band. In addition, for those objects classified as HII-galaxies, we used the H equivalent widths to further constrain the ages of the VYSP444Note that since the continua of the spectra are affected by dilution due to the emission of older stellar components, the H equivalent width measurements provide upper limits for the age of the VYSP..
The model fit results are quantified in terms of the percentage contribution of the different stellar components in a normalising bin. Due to the different spectral morphologies of the extracted spectra, it was not possible to select exactly the same normalising bin for all the extracted apertures. However, the normalising bin was always selected to be located within the wavelength range 4400 – 4800 Å, and usually extends 100 Å.
Since CONFIT allows for a maximum of two stellar components plus a power-law in some cases and the stellar contents of the galaxy are not known a priori, we used various combinations of spectra during the modelling process in order to determine the properties of the dominant stellar populations. We would like to emphasize that the techniques and the modelling philosophy used in this paper are based on the results of RZ08 for the ULIRG Arp 220, and to a lesser extent on those of RZ07 for the case of PKS1345+12.
 |
 |
 |
 |
 |
 |
 |
 |
 |
 |
 |
 |
 |
 |
 |
 |
 |
 |
 |
 |
 |
 |
 |
 |
 |
 |
 |
 |
 |
 |
 |
 |
 |
 |
 |
 |
 |
 |
 |
 |
 |
 |
 |
 |
Throughout this paper, we define young stellar populations (YSPs) as stellar components with ages tYSP 2 Gyr, and old stellar populations (OSP) as components with ages tOSP2 Gyr. With the aim of better describing each combination, it is convenient to divide the YSPs into two groups:
-
•
very young stellar populations (VYSP): stellar components with ages tVYSP 0.1 Gyr;
-
•
intermediate-age young stellar populations (IYSP): stellar components with ages in the range of 0.1 tIYSP 2 Gyr.
Generally, for models that include an old plus a young and/or an intermediate stellar component it is not possible to distiguish between OSP ages in the range 2 tOSP 12 Gyr, and therefore, we decided not to use such stellar populations during the modelling analysis described below. Instead, we fixed the age of the OSP at 12.5 Gyr. The different combinations used during the modelling were:
-
•
Combination I: as a first approach we used a two component model comprising a YSP (t 2 Gyr) with varying reddening (0.0 2.0, increasing in steps of 0.1), along with an unreddened555Although we cannot entirely rule the idea that these stellar populations are significantly reddened, assuming zero reddening for OSP is reasonable since such populations are likely to be situated in the extended bulge/halo in the foreground of the system (along the line of sight), or else completely obscured by the circum-nuclear dust in the background of the system OSP of age 12.5 Gyr. Accounting for an old component covers the case in which one or more of the merging galaxies is early-type or bulge-dominated galaxy. It is worth mentioning that this combination is almost identical to the one used in RZ07 for the ULIRG PKS1345+12. However, the version of the fitting code used here represents an updated version of the one used in that paper. Therefore, in order to compare the results obtained or this galaxy with those of the other ULIRGs in our sample, we decided to model again the extracted spectra for PKS1345+12 using this combination and the updated version of the code. The results obtained here are consistent with those of RZ07. For consistency, the spectra of this source were also modelled using the other two combinations described below.
-
•
Combination II: this combination consists of three components: an OSP of age 12.5 Gyr and zero reddening, along with a YSP with variable reddening (0.0 2.0, increasing in steps of 0.1), and a power-law () with a spectral index in the range . The power-law is included to represent either scattered or direct AGN continuum component (Tadhunter et al., 2002), or a highly reddened VYSP.
-
•
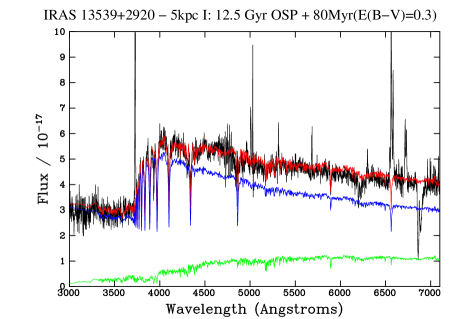
Combination III: for ULIRGs as a class, there is no reason, a priori, to expect a large contribution to the optical emission from a 12.5 Gyr OSP. Therefore, in order to explore the possibility of YSPs dominating the optical light from the objects in our sample, we used a combination of two YSP components: a IYSP with ages in the range 0.3 – 2.0 Gyr, and values of 0.0, 0.2 or 0.4, plus a VYSP with age in the range 1 – 100 Myr and reddenings (0.0 2.0, increasing in steps of 0.1). Note that for this combination, we assume that the IYSPs have relatively low reddening ( 0.4).
The modelling results found for all the ULIRGs in the CS and the ES are shown in Tables 5, 6, 7, 8, 9 and 10 for Combination I, Combination II and Combination III (hereafter Comb I, Comb II and Comb III). For the majority of the objects in our sample, the nebular correction mentioned before did not lead to a significant change in the modelling results for any of the combinations, and the uncertainties in the ages, reddenings and percentage contributions presented in the tables already account for such minor changes. Therefore we show only results for zero nebular correction in the tables for all objects with the exception of PKS1345+12. For this galaxy, the nebular correction changes the modelling results when using Comb I for Ap A and to a lesser extent Ap B. In this case both the nebular corrected and uncorrected results are shown in Table 5. We now give a general overview of the results obtained for Comb I, Comb II and Comb III.
4 Modelling results.
4.1 Combination I
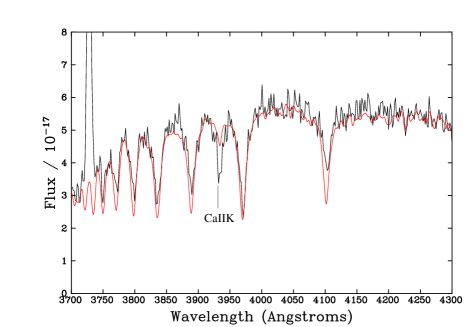
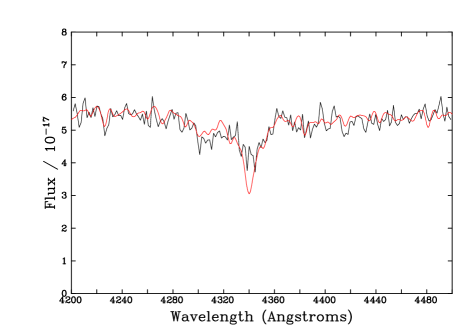
In the case of Comb I, adequate fits ( 1.0) to the overall shape of the SED were obtained for all the extraction apertures modelled, with the exception of the 5 kpc aperture in IRAS 23060+0505, for which a power-law is required. However, although this combination fits the overall shape of the continuum, it fails to fit the absoption features (high-order Balmer lines, CaII K, G-band) for 42% (54) of the extraction apertures modelled. Figure 3 shows a representative example of the fits obtained using this combination. The aperture selected for the figure samples the south-eastern nucleus (5kpcI) of IRAS 13539+2920. The figure shows the best fitting model to both the continuum and the detailed absorption feartures, obtained for that aperture. It is clear from the figure that Comb I fits the optical continuum SED adequately, but there is an underprediction of the CaII K absorption feature and, also, the fit to the Balmer lines and the G-band is not entirely satisfactory. This result suggests that the simple Comb I models may not be adequate for modelling the detailed absorption features for a subset of the ULIRGs in our sample. However, note that, the greatest disagreement between the Comb I fits and the data often occurs for the CaII K line, which potentially has a contribution from absorption by the ISM in the host galaxy666 46% of the apertures for which Comb I does not perfectly fit the CaII K absorption feature show an NaI D excess. The NaI D line is also potentially affected by the ISM of the host galaxy.. Therefore, for many of the 42% without adequate fits to the absorption lines, it is difficult to rule out the idea that Comb I provides adequate fits to the stellar continuum.
Overall, even if the Comb I fits are not always perfect, they give single-valued estimates of the luminosity-weighted age, reddening and percentage contribution of the YSPs within each aperture. Therefore the results of Comb I – presented in Table 5 and 6 – are still useful when performing a statistical analysis of the results.
4.2 Combination II
For those ULIRGs in our sample also classified as Sy2 galaxies, it is possible that the optical spectrum is a composite of stellar and AGN continuum emission (e.g. scattered light or weak direct AGN light: see Tadhunter et al., 2002). In this context, we note that significant starburst activity has already been detected in the nuclear regions in Sy2 galaxies. González Delgado et al. (2001) found high-order Balmer lines and He I absorption lines, strong indicators of the presence of YSPs, in their optical spectroscopic study of a sample of 20 Sy2 galaxies. Most of the objects in the González Delgado et al. (2001) sample are classified as LIRGs, and one, Mrk 273, is classified as a ULIRG and included in the work presented here. Therefore, it is straightforward to understand that Comb II, including a power law, is particularly useful for those ULIRGs in our sample also classified as Sy2 galaxies at optical wavelegths.
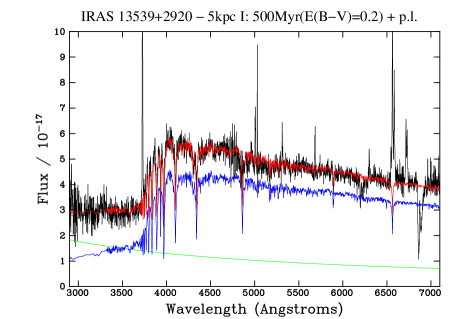
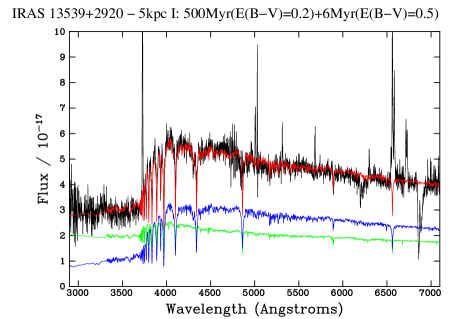
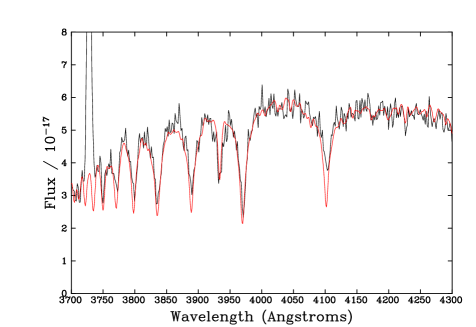
Since the power law also represents a highly reddened VYSP, comb II gives an idea of the contribution level of the OSPs in each galaxy. Therefore, we decided to use it for the whole sample of ULIRGs. Adequate fits ( 1.0) to the overall SED shapes were found for all of the apertures of all objects using this combination. On the other hand, this combination fails to fit the detailed absorption features for 10% (13 apertures) of the apertures modelled. Figure 4 shows an example of a fit obtained for IRAS 13539+2920 using Comb II for the same extraction aperture shown in Figure 3. It is clear from the figure that the underprediction of the CaII K absorption line disappears when a power-law is included. Finally, as shown in Tables 7 and 8 the minimum precentage contribution of the OSP component is less that 10% (due to the uncertainties inherent in the modelling techniques percentage contributions 10% are considered negligible) for most of the apertures. This result suggest that an OSP component is not required to fit the data in the majority of the objects in the ES.
4.3 Combination III
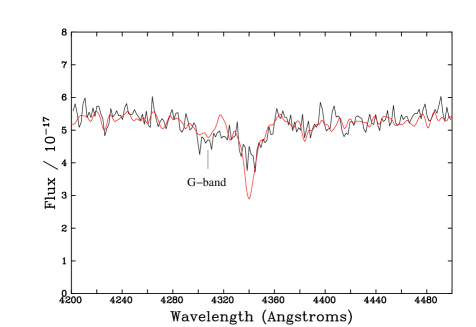
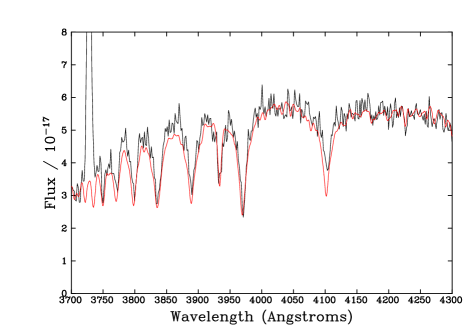
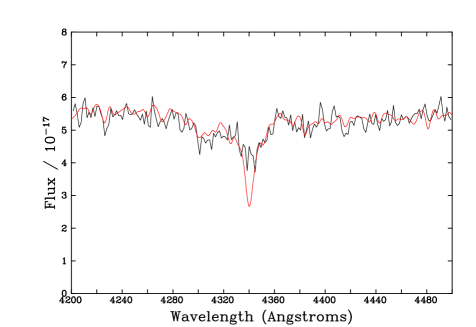
A drawback of Comb II is that, for those cases in which the power-law is likely to represent a VYSP component, it gives no information about the detailed properties (age and reddening) of such a component. Therefore, in order to better investigate the detailed properties of the VYSPs in the galaxies, we used Comb III. Adequate fits to both the continuum and the detailed absorption features are obtained for all but 9 ( 7%) of the extraction apertures modelled. In the minority of the cases for which no adequate fits could be obtained using Comb III, either an OSP or a power-law component was required in addition to a YSP. Figure 5 shows an example of a fit obtained using Comb III for the same extraction aperture shown in Figures 3 and 4 in the case of IRAS 13539+2920. The figure clearly demonstrates that Comb III provides the best fit to all of the detailed absorption features.
At this stage, it is worth re-iterating that there is no reason, a priori, to expect a major contribution to the optical emission from a 12.5 Gyr OSP in ULIRGs. The lack of an OSP is also suggested by the results of Combination II and, to a lesser extent, those of Combination I. Therefore, in the following, we will concentrate on the modelling results for Comb III and use those for Comb I and II as additional information, unless otherwise specified.
5 Estimating masses and bolometric luminosities
| Object Name | Mass | Mass | Mass | Lbol | LIR | % of LIR |
|---|---|---|---|---|---|---|
| IRAS | VYSP | IYSP | OSP | |||
| 109 M⊙ | 1010 M⊙ | 1011 M⊙ | 1012 L⊙ | 1012 L⊙ | ||
| (1) | (2) | (3) | (4) | (5) | (6) | (7) |
| 00091–0738 | 1.8 | 4.4 | - | 0.56 | 1.69 | 33 |
| 00188–0856 | 7.8 | 9.3 | - | 0.24 | 2.34 | 10 |
| 01004–2237 | 0.4 | 1.5 | - | 0.07 | 1.90 | 4 |
| 08572+3915 | 3.9 | 2.4 | - | 0.11 | 1.41 | 8 |
| 10190+1322 | 3.0 | 3.6 | - | 0.83 | 1.10 | 75 |
| 10494+4424 | 31.0 | 2.1 | - | 0.48 | 1.48 | 32 |
| 12072–0444 | 17.4 | 1.9 | - | 0.18 | 2.45 | 7 |
| 12112+0305 | 0.4 | 7.2 | - | 0.21 | 2.10 | 10 |
| 13305–1739 | 4.9 | 3.4 | - | 1.80 | 1.78 | 101 |
| 13428+5608 | 4.3 | 7.0 | - | 0.58 | 1.08 | 54 |
| 13451+1232 | 4.5 | 50.0 | - | 2.10 | 2.09 | 100 |
| 13539+2920 | 7.4 | 2.7 | - | 0.88 | 1.10 | 80 |
| 14060+2919 | 2.1 | 5.4 | - | 0.53 | 1.17 | 45 |
| 14252–1550 | 46.0 | 0.7 | - | 0.96 | 1.55 | 62 |
| 14348–1447 | 13.0 | 9.5 | - | 0.36 | 2.09 | 17 |
| 14394+5332E | 10.0 | 1.2 | - | 0.80 | 1.20 | 67 |
| 14394+5332W | 18.0 | 2.2 | - | 0.53 | - | - |
| 15130–1958 | 0.5 | 4.0 | - | 0.20 | 1.23 | 16 |
| 15206+3342 | 2.2 | 8.2 | - | 1.69 | 1.66 | 102 |
| 15327+2340 | 0.5 | 3.5 | - | 0.16 | 1.62 | 10 |
| 16156+0146 | 1.0 | 3.1 | - | 0.27 | 1.20 | 23 |
| 16474+3430 | 1.1 | 8.4 | - | 0.33 | 1.41 | 23 |
| 16487+5447 | 3.3 | 9.0 | - | 0.17 | 1.44 | 12 |
| 17028+5817E | 1.3 | 0.5 | - | 0.22 | - | |
| 17028+5817W | 41.4 | 0.9 | - | 0.65 | 1.38 | 47 |
| 17044+6720 | 3.4 | 2.4 | - | 0.77 | 1.48 | 52 |
| 17179+5444 | 7.5 | 16.6 | - | 2.0 | 1.74 | 114 |
| 20414-1651 | 0.8 | 3.4 | - | 0.32 | 1.51 | 21 |
| 21208–0519 | 3.8 | 9.2 | - | 0.77 | 1.12 | 69 |
| 22491–1808 | 2.7 | 2.5 | - | 0.8 | 1.35 | 59 |
| 23060+0505 | 19.0 | - | 0.5 | 2.2 | 3.01 | 73 |
| 23233+2817 | 10.0 | - | 2.2 | 0.16 | 1.1 | 15 |
| 23234+0946 | 5.2 | 4.3 | - | 0.65 | 1.23 | 53 |
| 23327+2913N | - | - | 3.5 | - | - | |
| 23327+2913S | 1.8 | - | 1.2 | 0.23 | 1.25 | 18 |
| 23389+0303 | 2.1 | 1.9 | - | 0.49 | 1.35 | 36 |
Note that since it was not possible to model the stellar populations in the nuclear regions of the three ULIRGs classified as Sy1 galaxies (IRAS 12540+5708,IRA 15462–0450 and IRAS 21219–1757), no results for these objects are presented in the table (see Apendix A for details).
It is also possible to estimate the masses and bolometric luminosities associated with the stellar populations detected at optical wavelengths using the modelling results. For this purpose, we extracted and modelled a large aperture including all the structure visible in the 2-D frames (and in the spatial cut in Figure 2) for each object. Assuming that the stellar population mix remains constant across the entire visible extents of the galaxies, we chose a model from all the adequate fits obtained, selected to be as representative as possible of all the stellar populations in the galaxy. Once the model was selected, we estimated the mass contribution of each of the stellar components in the large aperture. Since the slit does not cover the full extent of each galaxy, we then used the Kim et al. (2002) total magnitudes of the galaxies in the R-band to scale the results and estimate the masses in the various stellar components. However, due to the diversity of the stellar populations found, it is sometimes hard to select a particular representative model for some ULIRGs. In such cases, the selection is biased towards models consistent with the results obtained for the nuclear region, since it is likely that most of the mid- to far-IR luminostity arises from these regions. The estimated total masses of the YSPs (VYSPs plus IYSPs, results presented in Table 10) fall in the range 0.18 50 M⊙. In the cases where both VYSPs and IYSPs are present, the IYSP is, in most cases, more massive than the VYSP (the exceptions are IRAS 10494+4424, IRAS 14252-15550 and IRAS 17028+5817W)
To estimate the bolometric luminosities associated with the stellar populations detected in the optical, we assumed the same combination of stellar populations as used for the mass measurements, scaling the unreddened stellar templates using the mass values previously obtained. We then integrated the scaled synthetic spectra over their entire wavelength range. The results are presented in Table 4. We find stellar bolometric luminosities in the range of 0.07 1012 L 2.2 1012 L⊙. Assuming that most of the optical light is absorbed and then re-processed by dust, we can compare the estimated bolometric luminosities with the mid- to far-IR luminosities of the sources, presented in Table 1. Column 7 in the table shows the estimated bolometric luminosities of the YSPs detected in the optical expressed as percentages of the measured mid- to far-IR luminosities.
Finally, we would like to emphasize that the results in Table 4 are indicative rather than exact, and they must be interpreted carefully due to the various uncertainties attached to the process. Above all, the major source of uncertainity arises from the selection of the model; different combinations of stellar populations may change the results significantly.
6 Summary of general patterns and results
In order to give an overview of the properties of the stellar populations of the ULIRGs in our sample as a whole, the general results and patterns obtained from the modelling can be summarized as follows.
-
•
Modelling technique: three different combinations of stellar populations have been used for the analysis presented here: combination I (OSP + YSP), combination II (OSP + YSP + p.l.) and combination III (VYSP + IYSP). In general, adequate fits to the overall shapes of the continua in individual apertures are obtained using all of the combinations. However, Comb I fails to fit the detailed absorption features for 42% (54) of the extraction apertures. This percentage is reduced down to 10% (13 apertures) and 7% (9 apertures) in the cases of Comb II and Comb III, respectively. Note that adequate fits for both the continuum and the detailed absorption features are found for 60% of the extraction apertures using all of the combinations. This clearly demonstrates the difficulty in obtaining a unique solution when using combinations of different stellar populations to model the optical spectra of starburst systems.
-
•
Young stellar populations: young stellar populations (YSPs, t 2.0 Gyr) are present in all apertures in all sources, with the exception of IRAS 23327+2913 5kpc-II. Furthermore, very young stellar populations (VYSPs, t 100 Myr) are essential to obtain adequate fits in all but 20 ( 15%) of the extraction apertures, 14 of which sample the extended regions of Arp220 and the radio galaxy IRAS 13451+1232 (PKS1345+12).
At this stage we would like to add a caveat about the properties of the so-called intermediate-age young stellar populations (IYSPs, 0.1 t 2.0 Gyr). For this component, we have assumed a limited range of ages and, in particular, reddening values, in comparison with those of the VYSPs. Therefore, the ranges of age and reddening presented in Tables 9 and 10 for the IYSPs are partially a consequence of these assumptions.
-
•
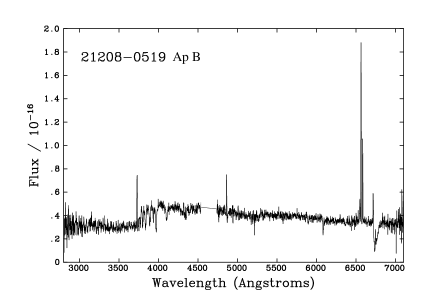
Old stellar populations: old stellar populations (OSPs, 12.5 Gyr) do not make a major contribution to the optical light in most apertures for most sources. The modelling results show that OSPs are essential for fitting the optical continuum in only 7 ( 5%) of all the apertures considered; in the majority of the cases, adequate fits can be obtained using combinations of IYSPs and VYSPs. Only in the cases of IRAS 23327+2913 (5kpc-II) and IRAS 21208-0519 (5kpc-II) we find that the OSPs dominate. In addition, in the cases of IRAS 13451+1232, IRAS 14394+5332 5kpc-II, IRAS 16487+5447E and IRAS 23234+0946 5kpc-II either OSPs, or dominant “old” IYSPs (1 - 2 Gyr), are required to model the data.
-
•
Reddening: the study presented here further emphasizes the importance of carefully accounting for dust reddening effects when modelling the stellar populations of star-forming galaxies.
-
•
Double nucleus systems: 20 of the 36 ULIRGs in our sample are classified as double nucleus systems and one, IRAS 14394+5322, is classified as a multiple ( 2 nucleus) system. For 14 of these systems, it was possible to study the stellar populations within the different nuclei individually. In 71% of the cases (10 of the 14 objects) the results are consistent with the stellar populations being similar in the two nuclei in terms of ages, reddenings and percentage contributions. However, in four cases (IRAS 14394+5332, IRAS 16487+5447, IRAS 21208-0519 and IRAS 23327+2913) we find marked differences between the mix of ages of the stellar populations in the two nuclei.
-
•
Extended and nuclear apertures: in the majority of the objects we find that we require the same stellar components (IYSP and VYSP) at all locations of the systems to model the spectra adequatelly.
-
•
Masses of the YSP: the estimated total masses of the YSPs (VYSPs plus IYSPs) fall in the range 0.18 50 M⊙. In the cases where both VYSPs and IYSPs are present, the IYSP is, in most cases, more massive than the VYSP (the exceptions are IRAS 10494+4424, IRAS 14252-15550 and IRAS 17028+5817W).
-
•
Bolometric luminosities: we have also estimated the bolometric luminosities associated with these stellar populations. For 48% of the objects in the ES sample (16 of the 33 objects, excluding the Sy1 galaxies), the bolometric luminosities of the YSPs detected in the optical can account for a large fraction ( 50%) of the mid- to far-IR luminosity of the source.
More detailed information about individual sources is presented in Appendix A.
7 Conclusions
This is the first of two papers presenting a detailed study of the stellar populations in a large sample of ULIRGs, based on long-slit optical spectroscopic observations. In this paper we have introduced the sample and described the analysis techniques and the general results obtained from the modelling. In addition, we present estimated values for the total masses of the stellar populations within the objects and the bolometric luminosities associated with them.
Overall, the results for the sample in general are consistent with those obtained in the detailed studies of RZ07 and RZ08 for PKS1345+12 and Arp 220 respectively, in terms of:
-
•
the requirement for a mixture of VYSPs and IYSPs, with the proportional contribution of the VYSP component increasing towards the nuclei in most cases; and
-
•
the importance of taking into account the reddening of the YSP component, with clear evidence of increasing reddening towards the nuclei in a number of the objects.
The work presented here clearly shows the utility of spectral synthesis modelling techniques for studying the properties of the stellar populations in star forming galaxies. In addition, it also shows the difficulty in obtaining a unique solution when using combinations of different stellar populations to model spectra, especially on the basis of fits to the SED alone (i.e. not examining the detailed absorption features). We have shown that some results, and therefore the conclusions based on them, can change significantly if different models are used.
The results described in this paper will be analyzed in more detail in a forthcoming paper (Rodríguez Zaurín et al. 2009b), where they will be discussed in the context of evolutionary models for merging systems, and the results obtained for similar systems in the high redshift universe.
Acknowledgments
We thank the referee for useful comments that have helped to improve the manuscript. JRZ acknowledges financial support from the STFC in the form of a PhD studentship. JRZ also acknowledges financial support from the spanish grant ESP2007-65475-C02-01. RGD is supported by the Spanish Ministerio de Educación y Ciencia under grant AYA 2007-64712. We also thank support for a joint CSIC-Royal Astronomy Society bilateral collaboration grant. The William Herschel Telescope is operated on the island of La Palma by the Isaac Newton Group in the Spanish Observatorio del Roque de los Muchachos of the Instituto de Astrofisica de Canarias.
References
- Armus et al. (2007) Armus L., Charmandaris V., Bernard-Salas J., Spoon H.W.W.and Marshall J., Higdon S., Desai V., Teplitz H., Hao L., Devost D., Brandl B., Wu Y., Sloan G., Soifer B., Houck J., Herter T., 2007, ApJ, 656, 148
- Armus et al. (1990) Armus L., Heckman T., Miley G., 1990, ApJ, 364, 471
- Arribas & Colina (2002) Arribas S., Colina L., 2002, ApJ, 573, 576
- Arribas et al. (2000) Arribas S., Colina L., Borne K., 2000, ApJ, 542, 228
- Bruzual & Charlot (2003) Bruzual G., Charlot S., 2003, MNRAS, 344, 1000
- Calzetti et al. (2000) Calzetti D., Armus L., Bohlin R., Kinney A., Koornneef J., Storchi-Bergman T., 2000, ApJ, 533, 682
- Canalizo & Stockton (2000a) Canalizo G., Stockton A., 2000a, AJ, 528, 201
- Canalizo & Stockton (2000b) Canalizo G., Stockton A., 2000b, AJ, 120, 1750
- Canalizo & Stockton (2001) Canalizo G., Stockton A., 2001, ApJ, 555, 719
- Cole et al. (1999) Cole G., Pedlar A., Holloway A., Mundell C., 1999, MNRAS, 310, 1033
- Condon et al. (1991) Condon J., Huang Z.-P., Yin Q., Thuan T., 1991, ApJ, 378, 65
- Dasyra et al. (2006a) Dasyra K., Tacconi L., Davies R., Naab T., Genzel R., Lutz D., Sturm E., Baker A., Veilleux S., Sanders D., Burkert A., 2006a, ApJ, 638, 745
- Dasyra et al. (2006b) Dasyra K., Tacconi L., Davies R., Naab T., Genzel R., Lutz D., Sturm E., Baker A., Veilleux S., Sanders D., Burkert A., 2006b, ApJ, 651, 835
- Davies et al. (2004) Davies R., Tacconi L., Genzel R., 2004, ApJ, 613, 781
- Dickson et al. (1995) Dickson R., Tadhunter C. N., Shaw M., Clark N., Morganti R., 1995, MNRAS, 273, L29
- Downes & Solomon (1998) Downes D., Solomon P., 1998, ApJ, 507, 615
- Evans et al. (1999) Evans A., Kim D., Mazzarella J., Scoville N., Sanders D., 1999, ApJ, 521, L107
- Evans et al. (2002) Evans A., Mazzarella J., Surace J., Sanders D., 2002, AJ, 580, 749
- Farrah et al. (2003) Farrah D., Afonso J., Efstathiou A., Rowan-Robinson M., Fox, M. Clements D., 2003, MNRAS, 343, 585
- Farrah et al. (2007) Farrah D., Bernard-Salas J., Spoon H. W. W., Soifer B. T., Armus L., Brandl B., Charmandaris V., Desai V., Higdon S., Devost D., Houck J., 2007, ApJ, 667, 149
- Farrah et al. (2005) Farrah D., Surace J. A., Veilleux S., Sanders D. B., Vacca W. D., 2005, ApJ, 626, 70
- Franceschini et al. (2001) Franceschini A., Aussel H., Cesarsky C. J., Elbaz D., Fadda D., 2001, A&A, 378, 1
- Franceschini et al. (2003) Franceschini A., Braito V., Persic M., Della Ceca R., Bassani L., Cappi M., Malaguti P., Palumbo G., Risaliti G., Salvati M., Severgnini P., 2003, MNRAS, 343, 1181
- Genzel et al. (1998) Genzel R. Lutz D., Sturm E., Egami E., Kunze D., Moorwood A., Rigopoulou D., Spoon H., Sternberg A., Tacconi-Garman L., Tacconi L., Thatte N., 1998, ApJ, 498, 579
- González Delgado et al. (2001) González Delgado R., Heckman T., Leitherer 2001, ApJ, 546, 845
- González Delgado et al. (2005) González Delgado R. M., Cerviño M., Martins L. P., Leitherer C., Hauschildt P. H., 2005, MNRAS, 357, 945
- Hamilton & Keel (1987) Hamilton D., Keel W., 1987, ApJ, 321, 211
- Houck et al. (1985) Houck J., Sneider D., Danielson G., Beichman C., Lonsdale C., Neugebauer C., B.T. S., 1985, ApJ., 290, L5
- Houck et al. (1984) Houck J., Soifer B. T., Neugebauer G., Beichman C. A., Aumann H. H., Clegg P. E., Gillett F. C., Habing H. J., Hauser M. G., Low F. J., Miley G., Rowan-Robinson M., Walker R. G., 1984, ApJ., 278, L63
- Imanishi & Dudley (2002) Imanishi M., Dudley C., 2002, ApJ, 545, 701
- Imanishi et al. (2007) Imanishi M., Dudley C., Maiolino R., Maloney P., Nakagawa T., Risaliti G., 2007, ApJ, 171, 72
- Imanishi et al. (2006) Imanishi M., Dudley C., Maloney P., 2006, AJ, 637, 114
- Kim & Sanders (1998) Kim D. C., Sanders D. B., 1998, ApJ, 119, 41
- Kim et al. (2002) Kim D. C., Veilluex S., Sanders D. B., 2002, ApJ, 143, 277
- Knapen et al. (1997) Knapen J., Laine S., Yates J.A. Robinson A., Richards A., Doyon R., Nadeau D., 1997, ApJ, 490, L29
- Leitherer et al. (1999) Leitherer C., Schaerer D., Goldader J., González Delgado R., Robert C., Foo Kune D., de Mello D., Devost D., Heckman T., 1999, ApJ, 123, 3
- Lutz et al. (1999) Lutz D., Veilluex S., Genzel R., 1999, ApJ, 517, L13
- Majewski et al. (1993) Majewski S., Hereld M., Koo D., Illingworth G., Heckman T., 1993, ApJ, 403, 125
- Murphy et al. (2001) Murphy T., Soifer B., Matthews K., Armus L., 2001, ApJ, 559, 201
- Nagar et al. (2003) Nagar N., Wilson A., Falcke H., Veilleux S., Maiolino R., 2003, A&A, 409, 115
- Osterbrock et al. (1996) Osterbrock D., Fulbright J., Keane M., Trager S., 1996, PASP, 108, 277
- Rigopoulou et al. (1999) Rigopoulou D., Spoon H., Genzel R., Lutz D., Moorwood A., Tran Q., 1999, ApJ, 118, 2625
- Risaliti et al. (2006) Risaliti G., Maiolino R., Marconi A., Sani E., Berta S., Braito V., Ceca R., Franceschini A., Salvati M., 2006, MNRAS, 365, 303
- Robinson et al. (2000) Robinson T., Tadhunter C., Axon D., Robinson A., 2000, MNRAS, 317, 922
- Rodríguez Zaurín et al. (2007) Rodríguez Zaurín J., Holt J., Tadhunter C., González Delgado R., 2007, MNRAS, 375, 1133
- Rodríguez Zaurín et al. (2008) Rodríguez Zaurín J., Tadhunter C. N., González Delgado R. M., 2008, MNRAS, 384, 875
- Rupke et al. (2002) Rupke D., Veilleux S., Sanders D., 2002, ApJ, 570, 588
- Salpeter (1955) Salpeter E., 1955, ApJ, 121, 161
- Schlegel et al. (1998) Schlegel J., Finkbeiner D., Davis M., 1998, ApJ, 500, 525
- Scoville et al. (2000) Scoville N. Z., Evans A. S., Thompson R., Rieke M., Hines D. C., Low F. J., Dinshaw N., Surace J. A., Armus L., 2000, ApJ, 119, 991
- Seaton (1979) Seaton M., 1979, MNRAS, 187, 73
- Soifer et al. (2000) Soifer B., Neugebauer G., Matthews K., Egami E., Becklin E., Weinberger A., Ressler M., Werner M., Evans A., Scoville N., Surace J., Condon J., 2000, AJ, 119, 509
- Soifer et al. (1987) Soifer B., Sanders D., Madore B., Neugebauer C., Danielson G., Elias E., Lonsdale C., Rice W., 1987, ApJ., 320, 74
- Soifer et al. (1986) Soifer B., Sanders D., Neugebauer C., Danielson G., Lonsdale C., Madore B., Persson S., 1986, ApJ., 303, L41
- Soifer (1984a) Soifer B. e. a., 1984a, ApJ., 278, L71
- Soifer (1984b) Soifer B. e. a., 1984b, ApJ., 283, L1
- Surace et al. (2000) Surace J., Sanders D., Evans A., 2000, ApJ, 529, 170
- Surace & Sanders (2000) Surace J. A., Sanders D., 2000, ApJ, 120, 604
- Surace et al. (1998) Surace J. A., Sanders D. B., Vacca W. D. Veilleux S., Mazzarella J. M., 1998, ApJ, 492, 116
- Surace & Sanders (1999) Surace J. A., Sanders D. C., 1999, ApJ, 512, 162
- Tadhunter et al. (2002) Tadhunter C., Dickson R., Morganti R., Robinson T., Wills K., Villar-Martin M., Hughes M., 2002, MNRAS, 330, 977
- Tadhunter et al. (2005) Tadhunter C. N., Robinson T. G., González Delgado R. M., Wills K., Morganti R., 2005, MNRAS, 356, 480
- Ulvestad (1984) Ulvestad J.S. Wilson A., 1984, ApJ, 278, 544
- Valdés et al. (2005) Valdés J., Berta S., Bressan A., Franceschini A., Rigopoulou D., Rodighiero G., 2005, A&A, 434, 149
- Veilleux et al. (1995) Veilleux S., Kim D. C., Mazzarella J. M., Soifer B. T., 1995, ApJ, 98, 171
- Veilleux et al. (1999) Veilleux S., Kim D.-C., Sanders D. B., 1999, ApJ, 522, 113
- Veilleux et al. (2002) Veilleux S., Kim D. C., Sanders D. B., 2002, ApJ, 143, 315
- Veilleux et al. (1997) Veilleux S., Sanders D., Kim D.-C., 1997, ApJ, 484, 92
- Veilleux et al. (999b) Veilleux S., Sanders D. B., Kim D.-C., 1999b, ApJ, 522, 139
- Veilluex et al. (2006) Veilluex S., Kim D.-C., Peng C., Ho L., Tacconi L., Dasyra K., Genzel R., Lutz D., Sanders D., 2006, ApJ, 643, 707
- Wilson et al. (2006) Wilson C., Harris W., Longden R., Scoville N., 2006, ApJ, 641, 763
 |
 |
 |
 |
 |
 |
 |
 |
 |
 |
 |
 |
 |
 |
 |
 |
 |
 |
 |
 |
 |
 |
 |
 |
 |
 |
 |
 |
 |
 |
 |
 |
 |
 |
 |
 |
 |
 |
 |
 |
 |
 |
 |
 |
 |
 |
 |
 |
 |
 |
 |
 |
 |
 |
 |
 |
 |
 |
 |
 |
 |
 |
 |
 |
 |
 |
 |
 |
 |
 |
 |
 |
 |
 |
 |
 |
 |
 |
 |
 |
 |
 |
 |
 |
 |
 |
 |
 |
 |
 |
 |
 |
 |
 |
 |
 |
 |
 |
 |
 |
 |
 |
 |
 |
 |
 |
 |
 |
| Object | Apertures | Detailed | Age of | E(B-V) | YSP |
|---|---|---|---|---|---|
| Name | features | YSP | |||
| IRAS | fitted? | (Gyr) | |||
| (1) | (2) | (3) | (4) | (5) | (6) |
| 00091-0738 | 5kpc | N | 0.05 - 0.1 | 0.6 | 75 - 100 |
| Ap A | Y | 0.2 - 1.0 | 0.0 -0.1 | 45 - 50 | |
| Ap B | Y | 0.08 - 0.2 | 0.0 - 0.3 | 60 - 90 | |
| 00188-0856 | 5kpc | Y | 0.3 - 0.5 | 0.4 | 80 - 100 |
| 01004-2237 | 5kpc | Y | 0.006 - 0.03 | 0.2 - 0.3 | 73 - 90 |
| 12072-0444 | 5kpc | N | 0.04 - 0.05 | 0.4 - 0.5 | 75 - 100 |
| Ap A | Y | 0.1 - 0.3 | 0.0 - 0.1 | 50 - 65 | |
| Ap B | N | 0.06 - 0.1 | 0.0 - 0.2 | 60 - 95 | |
| 12112+0305 | 5kpc-I | N | 0.04 - 0.06 | 0.6 | 100 |
| 5kpc-II | Y | 0.06 - 0.1 | 0.0 - 0.1 | 65 - 70 | |
| Ap A | N | 0.05 - 0.06 | 0.6 - 0.7 | 80 - 85 | |
| 12540+5708 | 5kpc | - | - | - | |
| Ap A | Y | 0.005 - 0.007 | 0.1 | 40 | |
| Ap B | Y | 0.04 - 0.1 | 0.0 - 0.5 | 45 - 75 | |
| Ap C | Y | 0.07 - 0.08 | 0.1 | 95 | |
| Ap D | - | - | - | ||
| Ap E | Y | 0.06 - 0.1 | 0.2 - 0.5 | 50 - 70 | |
| 13428+5608 | 5kpc | N | 0.05 - 0.06 | 0.5 | 75 |
| Ap A | Y | 0.2 - 0.3 | 0.0 | 45 - 55 | |
| Ap B | Y | 0.08 - 0.2 | 0.0 - 0.1 | 35 - 40 | |
| Ap C | N | 0.09 - 0.2 | 0.0 - 0.3 | 45 - 60 | |
| Ap D | N | 0.07 - 0.1 | 0.1 - 0.3 | 50 - 75 | |
| Ap E | N | 0.05 - 0.06 | 0.5 | 75 | |
| Ap F | N | 0.05 - 0.1 | 0.0 - 0.4 | 40 - 55 | |
| 13451+1232(PA160) | 5kpc | Y | 0.06 | 0.8 - 1.3 | 20 - 35 |
| Ap A | Y | 0.1 - 0.2 | 0.0 | 25 | |
| 1.0 - 2.0 | 0.0 | 50 - 100 | |||
| Ap A neb | Y | 0.2 - 1.2 | 0.0 | 20 - 80 | |
| Ap B | Y | 0.001 - 0.1 | 0.0 - 1.0 | 5 - 30 | |
| Ap B neb | Y | 0.004 - 0.4 | 0.0 - 1.0 | 10 - 20 | |
| Ap C | Y | 0.004 - 0.005 | 0.5 - 0.8 | 40 - 50 | |
| 0.04 - 0.1 | 0.0 - 0.3 | 30 - 50 | |||
| Ap D | Y | 0.2 - 0.6 | 0.0 - 0.1 | 30 - 50 | |
| 13451+1232(PA230) | Ap A | Y | 0.4 - 2.0 | 0.0 - 0.2 | 30 - 90 |
| Ap B | Y | 2.0 | 0.0 - 1.0 | 10 - 90 | |
| 13539+2920 | 5kpc-I | N | 0.07 - 0.2 | 0.0 - 0.3 | 65 - 100 |
| 5kpc-II | N | 0.05 - 0.06 | 0.8 | 95 | |
| 14060+2919 | 5kpc | N | 0.007 | 0.4 | 85 |
| 0.03 | 0.3 | 85 | |||
| Ap A | Y | 0.4 - 0.6 | 0.0 | 85 - 100 | |
| Ap B | Y | 0.03 - 0.04 | 0.3 | 88 - 100 | |
| Ap C | Y | 0.04 - 0.06 | 0.0 - 0.2 | 88- 97 | |
| 14348-1447 | 5kpc-I | N | 0-04 - 0.06 | 0.5 | 95 |
| 5kpc-II | Y | 0.06 - 0.08 | 0.2 - 0.3 | 73 - 83 | |
| Ap A | N | 0.04 - 0.07 | 0.0 - 0.3 | 75 - 100 | |
| Ap B | N | 0.04 - 0.07 | 0.5 - 0.6 | 70 - 100 | |
| Ap C | Y | 0.06 - 0.2 | 0.0 - 0.3 | 70 - 75 | |
| Ap D | Y | 0.04 - 0.1 | 0.0 - 0.4 | 50 - 70 | |
| 14394+5332 | 5kpc-I | N | 0.05 - 0.07 | 0.5 | 80 - 90 |
| 5kpc-II | Y | 0.004 - 0.007 | 0.6 - 0.8 | 44 - 55 | |
| 0.04 - 0.06 | 0.4 - 0.5 | 50 - 55 | |||
| Ap A | Y | 0.07 - 0.1 | 0.0 - 0.1 | 50 - 55 | |
| Ap B | N | 0.04 - 0.1 | 0.0 - 0.4 | 45 - 55 | |
| 15130+1958 | 5kpc | N | 0.07 - 100 | 0.4 - 0.5 | 75 - 90 |
| 15206+3342 | 5kpc | Y | 0.01 | 0.3 | 91 |
| Object | Apertures | Detailed | Age of | E(B-V) | YSP |
|---|---|---|---|---|---|
| Name | features | YSP | |||
| IRAS | fitted? | (Gyr) | |||
| (1) | (2) | (3) | (4) | (5) | (6) |
| 15327+2340(PA160) | 5kpc | N | 0.07 - 0.1 | 0.8 | 70 |
| Ap A | Y | 0.4 - 0.6 | 0.0 - 0.1 | 60 - 85 | |
| Ap B | Y | 0.4 - 0.6 | 0.0 | 50 - 70 | |
| Ap C | Y | 0.4 - 0.6 | 0.4 - 0.5 | 50 - 90 | |
| Ap D | N | 0.05 - 0.1 | 0.9 | 90 | |
| Ap E | N | 0.08 - 0.1 | 0.9 | 75 | |
| Ap F | Y | 0.1 - 0.2 | 0.4 - 0.5 | 60 | |
| Ap G | Y | 0.2 - 0.6 | 0.0 - 0.1 | 50 - 70 | |
| ApTOTAL | N | 0.09 - 0.2 | 0.6 | 70 | |
| 15327+2340(PA75) | Ap A | Y | 0.2 - 0.6 | 0.1 - 0.4 | 50 - 95 |
| Ap B | Y | 0.09 - 0.2 | 0.5 | 55 - 70 | |
| Ap C | Y | 0.2 - 0.3 | 0.5 - 0.6 | 65 | |
| Ap D | Y | 0.2 - 0.4 | 0.3 - 0.4 | 55 - 75 | |
| Ap E | Y | 0.2 - 0.3 | 0.2 - 0.3 | 60 | |
| Ap F | Y | 0.08 - 0.6 | 0.1 - 0.5 | 45 - 70 | |
| Ap G | Y | 0.05 - 0.6 | 0.1 - 0.5 | 45 - 80 | |
| ApTOTAL | Y | 0.2 - 0.3 | 0.3 - 0.4 | 50 - 60 | |
| 15327+2340(PA75*) | Ap A | Y | 0.2 - 0.6 | 0.0 - 0.1 | 50 - 95 |
| Ap B | Y | 0.4 - 0.6 | 0.0 - 0.1 | 60 - 90 | |
| Ap C | Y | 0.4 - 0.6 | 0.0 - 0.1 | 70 - 100 | |
| Ap D | Y | 0.4 - 0.6 | 0.0 - 0.1 | 60 - 90 | |
| Ap E | Y | 0.4 - 0.8 | 0.0 - 0.1 | 50 - 100 | |
| Ap F | Y | 0.4 - 1.6 | 0.0 - 0.1 | 50 - 100 | |
| ApTOTAL | Y | 0.2 - 0.6 | 0.0 - 0.1 | 45 - 85 | |
| 16474+3430 | 5kpc-I | N | 0.007 | 0.4 | 85 |
| 5kpc-II | Y | 0.07 - 0.08 | 0.1 | 70 | |
| Ap A | Y | 0.04 | 0.3 | 82 | |
| 16487+5447NE | 5kpc | Y | 0.004 - 0.006 | 0.5 - 0.7 | 25 - 45 |
| Ap A | Y | 0.004 - 0.007 | 0.3 - 0.5 | 55 - 70 | |
| 16487+5447NW | 5kpc | Y | 0.005 - 0.007 | 0.2 | 75 |
| Ap A | N | 0.05 - 0.09 | 0.0 - 0.2 | 55 - 75 | |
| Ap B | Y | 0.004 - 0.006 | 0.2 - 0.3 | 70 - 74 | |
| 17028+5817NE | 5kpc | N | 0.04 - 0.08 | 0.0 - 0.3 | 70 - 90 |
| 17028+5817NW | 5kpc | N | 0.05 - 0.07 | 0.7 | 80 - 95 |
| Ap A | Y | 0.2 - 0.6 | 0.0 | 70 - 100 | |
| 20414-1651 | 5kpc | N | 0.07 - 0.1 | 0.1 - 0.4 | 65 - 90 |
| 21208-0519 | 5kpc-I | N | 0.004 - 0.005 | 0.6 | 80 - 90 |
| 0.04 - 0.05 | 0.3 | 90 - 100 | |||
| 5kpc-II | Y | 0.09 - 0.1 | 0.2 - 0.3 | 30 - 35 | |
| Ap A | Y | 0.1 - 0.2 | 0.0 - 0.2 | 50 | |
| Ap B | Y | 0.1 | 0.0 | 65 | |
| 22491-1808 | 5kpc | N | 0.04 | 0.3 | 100 |
| Ap A | N | 0.05 - 0.1 | 0.0 - 0.3 | 65 - 100 | |
| Ap B | N | 0.04 | 0.2 | 87 | |
| Ap C | N | 0.05 - 0.07 | 0.1 - 0.2 | 80 - 90 | |
| 23233+2817 | 5kpc | Y | 0.04 - 0.05 | 0.3 - 0.4 | 50 - 65 |
| Ap A | - | - | - | - | |
| Ap B | Y | 0.06 - 0.1 | 0.1 - 0.3 | 50 - 60 | |
| 23234+0946 | 5kpc-I | N | 0.006 | 0.6 | 88 |
| 0.04 | 0.4 | 80 | |||
| 5kpc-II | Y | 0.07 - 0.3 | 0.2 - 0.4 | 40 - 50 | |
| Ap A | N | 0.08 - 0.2 | 0.0 - 0.3 | 60 - 75 | |
| 23327+2913 | 5kpc-I | Y | 0.009 | 0.3 - 0.4 | 51 - 66 |
| 5kpc-II | Y | 2 | 2.0 | 50 | |
| Ap A | Y | 0.009 | 0.3 - 0.4 | 51 - 66 | |
| Ap B | Y | 2 | 2.0 | 50 |
| Object | Apertures | Detailed | Age of | E(B-V) | YSP |
|---|---|---|---|---|---|
| Name | features | YSP | |||
| IRAS | fitted? | (Gyr) | |||
| (1) | (2) | (3) | (4) | (5) | (6) |
| 08572+3915 | 5kpc | N | 0.06 - 0.1 | 0.0 - 0.3 | 65 - 90 |
| Ap A | Y | 0.1 - 0.3 | 0.0 - 0.1 | 45 - 55 | |
| Ap B | N | 0.07 - 0.1 | 0.0 - 0.2 | 60 - 85 | |
| Ap C | Y | 0.07 - 0.1 | 0.2 - 0.3 | 90 - 100 | |
| 10190+1322 | 5kpc-I | N | 0.05 - 0.08 | 0.3 - 0.5 | 65 - 90 |
| 5kpc-II | N | 0.2 | 0.5 | 85 | |
| Ap A | Y | 0.4 - 0.7 | 0.0 - 0.2 | 60 - 95 | |
| Ap B | N | 0.04 - 0.06 | 0.5 - 0.6 | 80 - 95 | |
| 10494+4424 | 5kpc | N | 0.07 - 0.1 | 0.7 | 95 - 100 |
| Ap A | Y | 0.4 | 0.0 - 0.1 | 72 - 87 | |
| Ap B | N | 0.04 - 0.1 | 0.0 - 0.4 | 75 - 100 | |
| 13305-1739 | 5kpc | N | 0.05 - 0.1 | 0.0 - 0.4 | 65 - 90 |
| 14252-1550 | 5kpc | N | 0.05 - 0.1 | 0.5 - 0.6 | 80 - 85 |
| Ap A | Y | 0.2 - 0.7 | 0.0 - 0.2 | 50 - 100 | |
| 16156+0146 | 5kpc-I | Y | 0.01 | 0.5 | 75 |
| 5kpc-II | N | 0.08 - 0.1 | 0.1 - 0.3 | 75 - 98 | |
| Ap A | Y | 0.004 - 0.007 | 0.3 - 0.5 | 40 - 80 | |
| 0.03 - 0.04 | 0.1 - 0.3 | 50 - 75 | |||
| 17044+6720 | 5kpc | Y | 0.05 - 0.08 | 0.4 | 80 - 85 |
| Ap A | Y | 0.05 - 0.1 | 0.0 - 0.3 | 70 - 90 | |
| Ap B | N | 0.05 - 0.1 | 0.0 - 0.2 | 77 - 95 | |
| 17179+5444 | 5kpc | N | 0.07 - 0.1 | 0.4 - 0.6 | 50 - 85 |
| 23060+0505 | 5kpc | N | - | - | - |
| Ap A | Y | 0.05 - 0.1 | 0.1 - 0.4 | 43 - 65 | |
| Ap B | Y | 0.04 - 0.06 | 0.2 - 0.3 | 65 | |
| 23389+0303 | 5kpc I | N | 0.004 | 0.9 | 100 |
| 0.04 | 0.6 | 90 | |||
| 5kpc II | N | 0.07 - 0.1 | 0.2 - 0.4 | 70 - 85 | |
| Ap A | N | 0.06 | 0.5 | 85 | |
| Ap B | N | 0.005 - 0.006 | 0.8 - 0.9 | 85 | |
| Ap C | N | 0.05 - 0.08 | 0.4 | 63 -76 | |
| Ap D | N | 0.1 | 0.2 | 72 |
| Object Name | Aperture | Age of YSP | E(B - V) | YSP | p.l | OSP |
| IRAS | (Gyr) | |||||
| (1) | (2) | (3) | (4) | (5) | (6) | (7) |
| 00091-0738 | 5kpc | 0.3 - 0.6 | 0.0 - 0.2 | 48 - 60 | 20 - 35 | 5 - 30 |
| Ap A | 0.4 - 1.0 | 0.0 - 0.3 | 50 - 100 | 6 - 12 | 25 | |
| Ap B | 0.2 - 0.6 | 0.0 - 0.2 | 66 - 75 | 10 - 25 | 24 | |
| 00188-0856 | 5kpc | 0.3 - 0.6 | 0.3 - 0.4 | 75 - 90 | 8 - 10 | 16 |
| 01004-2237 | 5kpc | 0.03 - 0.1 | 0.0 - 0.5 | 30 - 50 | 40 | 10 - 30 |
| 12072-0444 | 5kpc1 | - | - | - | - | - |
| Ap A | 0.2 - 0.6 | 0.0 - 0.2 | 40 - 65 | 7 - 30 | 50 | |
| Ap B | 0.5 - 0.6 | 0.0 | 50 - 60 | 40 | 10 | |
| 12112+0305 | 5kpc I | 0.4 - 0.5 | 0.0 - 0.1 | 50 - 60 | 40 | 10 |
| 5kpc II | 0.2 - 0.5 | 0.0 - 0.2 | 50 - 60 | 30 - 40 | 15 | |
| Ap A | 0.2 - 0.8 | 0.0 - 0.1 | 40 - 70 | 20 - 40 | 45 | |
| 12540+5708 | 5kpc | - | - | - | - | - |
| Ap A | 0.4 - 1.4 | 0.1 - 0.5 | 40 -75 | 25 - 40 | 35 | |
| Ap B | 0.2 | 0.0 | 40 | 30 | 30 | |
| Ap C | 0.09 - 0.2 | 0.0 - 0.1 | 70 -88 | 10 - 30 | 0 | |
| Ap D | - | - | - | - | - | |
| Ap E | 0.1 - 0.2 | 0.0 - 0.1 | 30 | 40 | 30 | |
| 13428+5608 | 5kpc | 0.5 - 0.8 | 0.0 - 0.1 | 45 - 60 | 40 | 15 |
| Ap A | 0.4 - 0.8 | 0.0 - 0.3 | 50 - 85 | 10 - 15 | 35 | |
| Ap B | 0.2 - 0.7 | 0.0 - 0.2 | 33 - 64 | 6 - 15 | 30 - 65 | |
| Ap C | 0.4 - 0.7 | 0.0 - 0.2 | 50 - 90 | 6 - 9 | 45 | |
| Ap D | 0.5 - 0.8 | 0.0 - 0.3 | 50 - 80 | 18 - 23 | 30 | |
| Ap E | 0.5 - 0.8 | 0.0 - 0.1 | 40- 60 | 40 | 20 | |
| Ap F | 0.5 - 0.7 | 0.0 - 0.4 | 45 - 80 | 15 - 30 | 30 | |
| 13451+1232(PA160) | 5kpc3 | - | - | - | - | - |
| Ap A | 0.2 - 0.8 | 0.0 - 0.2 | 20 - 35 | 5 | 60 - 75 | |
| Ap B3 | - | - | - | - | - | |
| Ap C | 0.4 - 0.8 | 0.0 - 0.3 | 35 - 75 | 15- 25 | 5 - 45 | |
| Ap D | 0.4 - 1.2 | 0.0 - 0.5 | 30 - 85 | 10 - 16 | 45 | |
| 13451+1232(PA230) | Ap A | 0.5 - 1.4 | 0.0 - 0.5 | 40 - 90 | 3 - 10 | 50 |
| Ap B | 0.4 - 1.0 | 0.0 - 0.2 | 25 - 50 | 5 -10 | 45 - 65 | |
| 13539+2920 | 5kpc-I | 0.5 - 0.6 | 0.0 - 0.2 | 65 - 80 | 20 - 30 | 0 |
| 5kpc-II | 0.5 - 0.8 | 0.2 - 0.5 | 50 - 70 | 35 - 40 | 15 | |
| 14060+2919 | 5kpc | 0.004 | 0.5 | 93 | 6 | 0 |
| Ap A | 0.3 - 0.8 | 0.0 - 0.4 | 60 - 90 | 10 - 15 | 25 | |
| Ap B | 0.04- 0.06 | 0.0 - 0.4 | 60 - 85 | 10 - 25 | 10 | |
| Ap C | 0.2 - 0.3 | 0.0 | 50 | 40 | 11 | |
| 14348-1447 | 5kpc-I1 | - | - | - | - | - |
| 5kpc-II | 0.5 | 0.0 | 62 | 38 | 0 | |
| Ap A | 0.1 - 0.3 | 0.0 - 0.1 | 40 - 50 | 40 | 10 - 20 | |
| Ap B | 0.2 - 0.6 | 0.0 - 0.1 | 30 - 40 | 30 - 40 | 12 - 40 | |
| Ap C | 0.09 - 0.4 | 0.0 - 0.4 | 45 - 80 | 5- 35 | 35 | |
| Ap D | 0.05 - 0.4 | 0.0 - 0.5 | 40 - 75 | 5 - 30 | 50 | |
| 14394+5332 | 5kpc-I1 | - | - | - | - | - |
| 5kpc-II | 0.7 - 2.0 | 0.0 - 0.2 | 40 - 70 | 30 - 35 | 30 | |
| Ap A | 0.3 - 0.8 | 0.0 - 0.2 | 42 - 60 | 30 - 35 | 25 | |
| Ap B | 0.4 - 1.0 | 0.0 - 0.3 | 40 - 60 | 23 - 35 | 30 | |
| 15130+1958 | 5kpc | 0.2 - 0.5 | 0.0 - 0.2 | 55 - 70 | 30 | 15 |
| 15206+3342 | 5kpc2 | - | - | - | - | - |
1 No adequate fits (fitting both the continuum and the detailed absorption features) are found using Comb II.
2 No adequate fits are found with a non negligible contribution of the p.l. component (i.e., different than those of Comb I) and therefore, no results are presented in the table.
3 When a p.l. is included, adequate fits are found for the entire range of YSP combinations used and, therefore, no results are presented in the table.
| Object Name | Aperture | Age of YSP | E(B - V) | YSP | p.l | OSP |
| IRAS | (Gyr) | |||||
| (1) | (2) | (3) | (4) | (5) | (6) | (7) |
| 15327+2340(PA160) | 5kpc | 0.4 - 0.7 | 0.4 - 0.5 | 64 - 85 | 15 - 18 | 20 |
| Ap A | 0.5 - 0.7 | 0.0 - 0.1 | 75 - 98 | 2 | 20 | |
| Ap B | 0.5 - 0.7 | 0.1 - 0.2 | 85 - 95 | 3 - 5 | 20 | |
| Ap C | 0.4 - 0.7 | 0.3 - 0.5 | 70 - 98 | 4 - 5 | 20 | |
| Ap D | 0.4 - 0.6 | 0.5 - 0.8 | 62 - 75 | 27 - 35 | 8 | |
| Ap E | 0.4 - 0.6 | 0.6 - 0.8 | 75 - 85 | 10 - 16 | 15 | |
| Ap F | 0.1 - 0.7 | 0.2 - 0.4 | 53 - 85 | 4 - 17 | 43 | |
| Ap G | 0.4 - 0.7 | 0.0 - 0.2 | 55 - 90 | 4 - 8 | 40 | |
| ApTOTAL | 0.3 - 0.7 | 0.2 - 0.4 | 48 - 87 | 5 - 15 | 45 | |
| 15327+2340(PA75) | Ap A | 0.3 - 0.7 | 0.1 - 0.3 | 60 - 93 | 3 - 7 | 37 |
| Ap B | 0.2 - 0.6 | 0.2 - 0.5 | 50 - 75 | 6 - 18 | 10 - 44 | |
| Ap C | 0.3 - 0.6 | 0.4 - 0.5 | 65 - 85 | 6 - 12 | 8 - 27 | |
| Ap D | 0.3 - 0.7 | 0.2 - 0.4 | 61 - 95 | 3 - 9 | 37 | |
| Ap E | 0.3 - 0.7 | 0.1 - 0.4 | 52 - 85 | 4 - 10 | 9 - 45 | |
| Ap F | 0.3 - 0.9 | 0.1 - 0.5 | 30 - 85 | 2 - 13 | 10 - 70 | |
| Ap G | 0.2 - 1.0 | 0.0 - 0.3 | 38 - 90 | 7 - 16 | 60 | |
| ApTOTAL | 0.2 - 0.6 | 0.2 - 0.4 | 57 - 75 | 4 - 12 | 12 - 40 | |
| 15327+2340(PA75*) | Ap A | 0.3 - 0.6 | 0.0 - 0.2 | 55 - 90 | 3 - 10 | 40 |
| Ap B | 0.4 - 0.7 | 0.0 - 0.2 | 59 - 95 | 2 - 5 | 41 | |
| Ap C | 0.4 - 0.6 | 0.0 - 0.2 | 63 - 90 | 4 - 8 | 33 | |
| Ap D | 0.4 - 0.7 | 0.0 - 0.2 | 55 - 90 | 7 - 10 | 40 | |
| Ap E | 0.4 - 1.2 | 0.0 - 0.3 | 40 - 90 | 9 - 11 | 52 | |
| Ap F | 0.5 - 1.6 | 0.0 - 0.3 | 45 - 95 | 2 - 10 | 48 | |
| ApTOTAL | 0.4 - 0.7 | 0.0 - 0.3 | 51 - 93 | 7 - 9 | 45 | |
| 16474+3430 | 5kpc-I1 | - | - | - | - | - |
| 5kpc-II | 0.2 - 0.4 | 00 - 0.2 | 50 - 65 | 20 - 30 | 25 | |
| Ap A2 | - | - | - | - | - | |
| 16487+5447NE | 5kpc | 0.5 - 1.0 | 0.1 - 0.3 | 30 - 50 | 10 - 15 | 40 - 60 |
| Ap A | 0.04 - 0.1 | 0.0 - 0.3 | 25 - 45 | 15 - 33 | 33 - 40 | |
| 16487+5447NW | 5kpc1 | 0.04 | 0.2 | 60 | 30 | 10 |
| Ap A | 0.2 - 0.4 | 0.0 - 0.1 | 48 - 55 | 16 - 20 | 25 - 30 | |
| Ap B | 0.04 - 0.3 | 0.0 - 0.2 | 50 - 66 | 10 - 35 | 20 - 40 | |
| 17028+5817NE | 5kpc2 | - | - | - | - | - |
| 17028+5817NW | 5kpc | 0.3 - 0.6 | 0.1 - 0.4 | 50 - 60 | 25 - 35 | 10 - 25 |
| Ap A | 0.3 - 0.6 | 0.0 | 64 - 75 | 16 - 20 | 15 | |
| 20414-1651 | 5kpc | 0.3 - 0.6 | 0.0 - 0.2 | 50 - 65 | 20 - 40 | 15 |
| 21208-0519 | 5kpc-I | 0.1 - 0.2 | 0.0 - 0.2 | 45 - 50 | 30 - 40 | 10 - 25 |
| 5kpc-II | 0.2 - 1.2 | 0.0 - 0.5 | 25 - 85 | 10 - 22 | 65 | |
| Ap A | 0.2 - 0.6 | 0.0 - 0.2 | 46 - 70 | 5 - 20 | 10 - 50 | |
| Ap B | 0.2 - 0.6 | 0.0 - 0.1 | 47 - 55 | 25 - 35 | 10 - 22 | |
| 22491-1808 | 5kpc1 | - | - | - | - | |
| Ap A | 0.4 - 0.6 | 0.0 - 0.2 | 67 - 85 | 15 - 30 | 0 | |
| Ap B1 | - | - | - | - | - | |
| Ap C1 | - | - | - | - | - | |
| 23233+2817 | 5kpc | 0.05 - 0.5 | 0.0 - 0.3 | 25 - 45 | 15 - 40 | 20 - 40 |
| Ap A | - | - | - | - | - | |
| Ap B | 0.07 - 0.4 | 0.0 - 0.3 | 35 - 44 | 6 - 20 | 40 - 50 | |
| 23234+0946 | 5kpc-I | 0.04 - 0.2 | 0.0 - 0.4 | 20 - 63 | 17 - 40 | 20 - 40 |
| 5kpc-II | 0.1 - 1.0 | 0.0 - 0.4 | 35 - 80 | 5 - 20 | 60 | |
| Ap A | 0.5 - 0.8 | 0.0 | 65 - 85 | 10 - 20 | 15 | |
| 23327+2913 | 5kpc-I | 0.001 - 0.003 | 0.5 | 40 - 45 | 25 - 35 | 25 |
| 0.01 | 0.1 | 30 | 40 | 30 | ||
| 5kpc-II3 | - | - | - | - | - | |
| Ap A | 0.001 - 0.003 | 0.5 | 40 - 45 | 25 - 35 | 25 | |
| 0.01 | 0.1 | 30 | 40 | 30 | ||
| Ap B3 | - | - | - | - | - |
| Object Name | Aperture | Age of YSP | E(B - V) | YSP | p.l | OSP |
| IRAS | (Gyr) | |||||
| (1) | (2) | (3) | (4) | (5) | (6) | (7) |
| 08572+3915 | 5kpc | 0.2 - 0.6 | 0.0 - 0.2 | 60 - 70 | 30 - 36 | 25 |
| Ap A | 0.2 - 0.6 | 0.0 - 0.3 | 50 - 85 | 5 - 20 | 45 | |
| Ap B | 0.4 | 0.0 - 0.1 | 65 - 75 | 25 - 30 | 0 | |
| Ap C | 0.09 - 0.4 | 0.0 - 0.3 | 73 - 95 | 6 - 35 | 12 | |
| 10190+1322 | 5kpc-I1 | - | - | - | - | - |
| 5kpc-II1 | - | - | - | - | - | |
| Ap A | 0.4 - 0.7 | 0.0 - 0.2 | 70 - 95 | 5 | 25 | |
| Ap B1 | - | - | - | - | - | |
| 10494+4424 | 5kpc1 | - | - | - | - | - |
| Ap A2 | - | - | - | - | - | |
| Ap B | 0.07 - 0.2 | 0.0 - 0.2 | 65 - 85 | 10 - 40 | 10 | |
| 13305-1739 | 5kpc | 0.3 - 0.5 | 0.0 - 0.2 | 50 - 60 | 40 | 10 |
| 14252-1550 | 5kpc | 0.2 - 0.6 | 0.0 - 0.2 | 40 - 66 | 15 - 35 | 35 |
| Ap A | 0.2 - 0.8 | 0.0 - 0.2 | 60 - 85 | 10 - 20 | 45 | |
| 16156+0146 | 5kpc-I | 0.03 | .2 - 0.7 | 25 - 55 | 30 - 40 | 14 - 40 |
| 5kpc-II | 0.4 - 0.5 | 0.0 - 0.1 | 70 - 80 | 20 - 26 | 0 | |
| Ap A | 0.05 - 1.0 | 0.2 - 0.5 | 15 - 66 | 30 - 40 | 30 | |
| 17044+6720 | 5kpc | 0.2 - 0.4 | 0.0 - 0.1 | 50 | 36 - 40 | 10 - 15 |
| Ap A | 0.2 - 0.7 | 0.0 - 0.2 | 50 - 62 | 35 - 40 | 15 | |
| Ap B | 0.4 - 0.5 | 0.0 | 55 | 40 | 5 | |
| 17179+5444 | 5kpc | 0.2 - 0.6 | 0.1 - 0.3 | 40 - 62 | 22 - 35 | 6 - 50 |
| 23060+0505 | 5kpc | 0.01 | 0.4 | 72 | 6 | 22 |
| Ap A | 0.07 - 0.6 | 0.0 - 0.3 | 35 - 50 | 6 - 30 | 20 - 35 | |
| Ap B | 0.05 - 0.6 | 0.0 - 0.4 | 40 - 60 | 8 - 35 | 5 - 30 | |
| 23389+0303 | 5kpc-I1 | - | - | - | - | - |
| 5kpc-II | 0.2 - 0.7 | 0.0 | 53 - 70 | 12 - 30 | 35 | |
| Ap A | 0.4 - 0.6 | 0.0 - 0.1 | 60 | 40 | 0 | |
| Ap B1 | - | - | - | - | - | |
| Ap C | 0.5 - 0.8 | 0.0 - 0.1 | 50 - 70 | 30 | 20 | |
| Ap D | 0.2 - 0.5 | 0.0 - 0.1 | 55 - 65 | 10 - 30 | 2 - 30 |
| Object | Aperture | Age of | E(B - V) | Age of | E(B -V) | %VYSP |
| Name | IYSP | of | VYSP | of | ||
| IRAS | (Gyr) | IYSP | (Myr) | VYSP | ||
| (1) | (2) | (3) | (4) | (5) | (6) | (7) |
| 00091-0738 | 5kpc | 0.5 - 1.0 | 0.0 - 0.4 | 6 - 50 | 0.5 - 1.0 | 30 - 65 |
| Ap A | 0.7 - 2.0 | 0.0 - 0.2 | 100 | 0.0 - 1.5 | 50 | |
| Ap B | 0.3 - 2.0 | 0.0 - 0.4 | 100 | 0.2 - 1.0 | 10 - 90 | |
| 00188-0856 | 5kpc | 0.5 - 0.7 | 0.0 - 0.4 | 100 | 0.2 - 1.6 | 40 |
| 01004-2237 | 5kpc | 0.5 - 0.7 | 0.2 - 0.4 | 9 - 20 | 0.1 - 0.3 | 60 - 75 |
| 12072-0444 | 5kpc | 0.7 - 2.0 | 0.0 - 0.4 | 7 - 20 | 0.4 - 0.6 | 45 - 65 |
| Ap A | 0.5 - 2.0 | 0.0 - 0.4 | 100 | 0.0 - 1.2 | 20 - 65 | |
| Ap B | 1.0 - 2.0 | 0.0 | 40 - 100 | 0.0 - 0.3 | 40 - 60 | |
| 12112+0305 | 5kpc-I | 0.5 - 1.0 | 0.0 - 0.4 | 7 - 40 | 0.5 - 0.8 | 50 - 90 |
| 5kpc-II | 0.3 - 2.0 | 0.0 - 0.4 | 4 - 60 | 0.0 - 0.5 | 35 - 90 | |
| Ap A | 0.5 - 2.0 | 0.0 - 0.4 | 50 | 0.6 - 1.0 | 35 - 80 | |
| 12540+5708 | 5kpc | - | - | - | - | - |
| Ap A | 2 | 0.0 | 5 - 10 | 0.0 - 0.1 | 30 - 35 | |
| Ap B | 0.5 - 2.0 | 0.0 - 0.4 | 10 - 100 | 0.1 - 0.5 | 30 - 65 | |
| Ap C | 0.3 - 2.0 | 0.0 - 0.4 | 50 - 80 | 0.0 - 0.1 | 70 - 96 | |
| Ap D | - | - | - | - | - | |
| Ap E | 0.7 - 2.0 | 0.0 - 0.4 | 6 - 70 | 0.5 - 1.0 | 40 - 75 | |
| 13428+5608 | 5kpc | 0.7 - 2.0 | 0.0 - 0.4 | 6 - 50 | 0.4 - 0.8 | 20 - 50 |
| Ap A | 0.7 - 2.0 | 0.0 - 0.2 | 100 | 0.0 - 0.6 | 5 - 50 | |
| Ap B | 2.0 | 0.0 | 50 - 100 | 0.4 - 0.5 | 25 - 33 | |
| Ap C | 0.7 - 2.0 | 0.0 - 0.2 | 100 | 0.0 - 0.8 | 10 - 50 | |
| Ap D | 0.7 - 2.0 | 0.0 - 0.4 | 5 - 60 | 0.3 - 0.8 | 25 - 60 | |
| Ap E | 0.7 - 2.0 | 0.0 - 0.4 | 6 - 50 | 0.4 - 0.8 | 20 - 50 | |
| Ap F | 0.7 - 2.0 | 0.0 - 0.4 | 5 - 60 | 0.3 - 0.6 | 25 - 55 | |
| 13451+1232(PA160) | 5kpc | 2.0 | 0.0 - 0.2 | 100 | 0.0 - 2.0 | 10 |
| Ap A | 2.0 | 0.0 - 0.1 | 100 | 0.0 - 2.0 | 10 | |
| Ap B | 2.0 | 0.1 - 0.2 | 100 | 0.0 - 1.4 | 5 - 20 | |
| Ap C | 1.0 - 2.0 | 0.1 - 0.2 | 100 | 0.1 - 0.8 | 20 - 35 | |
| Ap D | 1.0 - 2.0 | 0.0 - 0.2 | 100 | 0.0 - 0.9 | 5 - 15 | |
| 13451+1232(PA230) | Ap A | 2.0 | 0.0 - 0.1 | 100 | 0.0 - 2.0 | 12 |
| Ap B | 2.0 | 0.1 | 100 | 0.0 - 2.0 | 11 | |
| 13539+2920 | 5kpc-I | 0.5 - 2.0 | 0.0 - 0.2 | 10 - 100 | 0.2 - 0.5 | 15 - 60 |
| 5kpc-II | 0.7 - 1.0 | 0.0 - 0.4 | 50 | 0.8 - 1.5 | 40 - 70 | |
| 14060+2919 | 5kpc | 0.5 - 0.7 | 0.4 | 7 | 0.4 - 0.5 | 60 - 100 |
| Ap A | 0.5 - 2.0 | 0.0 - 0.2 | 100 | 0.0 - 0.9 | 25 - 55 | |
| Ap B | 0.3 - 0.7 | 0.0 - 0.4 | 7 - 30 | 0.1 - 0.4 | 45 - 90 | |
| Ap C | 0.3 - 0.7 | 0.0 - 0.4 | 4 - 7 | 0.2 - 0.4 | 45 - 82 | |
| 14348-1447 | 5kpc-I | 0.3 - 0.7 | 0.0 - 0.6 | 5 - 20 | 0.4 - 0.7 | 50 - 80 |
| 5kpc-II | 0.3 - 2.0 | 0.0 - 0.4 | 7 - 8 | 0.4 - 0.6 | 40 | |
| 50 - 80 | 0.0 - 0.3 | 50 - 80 | ||||
| Ap A | 0.3 - 2.0 | 0.0 - 0.4 | 5 - 60 | 0.0 - 0.5 | 45 - 100 | |
| Ap B | 0.5 - 1.0 | 0.0 - 0.4 | 30 | 0.5 - 1.2 | 35 - 60 | |
| Ap C | 0.3 - 2.0 | 0.0 - 0.4 | 100 | 0.0 - 0.9 | 14 - 80 | |
| Ap D | 0.5 - 0.7 | 0.2 - 0.4 | 4 - 50 | 0.0 - 0.6 | 20 - 80 | |
| 14394+5332 | 5kpc-I | 0.5 - 0.7 | 0.2 | 6 - 7 | 0.7 | 75 |
| 5kpc-II | 2.0 | 0.0 - 0.2 | 6 - 100 | 0.0 - 0.8 | 25 -40 | |
| A | 0.5 - 2.0 | 0.0 - 0.4 | 4 - 100 | 0.0 - 0.5 | 30 - 75 | |
| B | 0.7 - 2.0 | 0.0 - 0.2 | 7 - 40 | 0.3 - 0.5 | 30 - 55 | |
| 15130+1958 | 5kpc | 0.3 - 1.0 | 0.0 - 0.4 | 100 | 0.0 - 1.3 | 20 - 70 |
| 15206+3342 | 5kpc | 0.5 - 0.7 | 0.5 - 0.6 | 1 - 3 | 0.4 - 0.5 | 70 - 80 |
| 0.3 - 2.0 | 0.0 - 0.4 | 10 | 0.3 | 91 |
| Object | Aperture | Age of | E(B - V) | Age of | E(B -V) | %VYSP |
|---|---|---|---|---|---|---|
| Name | IYSP | of | VYSP | of | ||
| IRAS | (Gyr) | IYSP | (Myr) | VYSP | ||
| (1) | (2) | (3) | (4) | (5) | (6) | (7) |
| 15327+2340(PA160) | 5kpc | 0.5 - 0.7 | 0.4 | 60 | 0.8 - 1.3 | 16 - 45 |
| Ap A | 0.6 - 0.7 | 0.0 - 0.2 | 100 | 0.0 - 0.2 | 5 | |
| Ap B | 0.5 - 0.7 | 0.0 - 0.2 | 100 | 0.0 - 0.3 | 20 | |
| Ap C | 0.5 - 0.7 | 0.3 - 0.5 | 100 | 0.0 - 1.0 | 5 - 15 | |
| Ap D | 0.5 - 0.9 | 0.0 - 1.0 | 80 | 0.9 - 1.8 | 30 - 63 | |
| Ap E | 0.5 - 0.9 | 0.2 - 0.6 | 60 | 0.9 - 1.6 | 22 - 47 | |
| Ap F | 0.5 - 0.7 | 0.2 - 0.6 | 80 | 0.0 - 1.5 | 5 - 36 | |
| Ap G | 0.5 - 0.7 | 0.0 - 0.3 | 70 | 0.0 - 0.7 | 5 - 20 | |
| ApTOTAL | 0.5 - 0.7 | 0.2 - 0.6 | 100 | 0.0 - 1.5 | 5 - 35 | |
| 15327+2340(PA75) | Ap A | 0.5 - 0.7 | 0.2 - 0.5 | 100 | 0.0 - 2.0 | 20 |
| Ap B | 0.5 - 0.7 | 0.2 - 0.6 | 100 | 0.0 - 1.0 | 5 - 25 | |
| Ap C | 0.5 - 0.7 | 0.2 - 0.6 | 50 | 0.0 - 1.2 | 5 - 30 | |
| Ap D | 0.5 - 0.7 | 0.2 - 0.6 | 60 | 0.0 - 1.5 | 5 - 25 | |
| Ap E | 0.5 - 0.7 | 0.2 - 0.5 | 50 | 0.0 - 2.0 | 30 | |
| Ap F | 0.6 - 0.9 | 0.1 - 0.4 | 100 | 0.0 - 1.2 | 25 | |
| Ap G | 0.7 - 0.9 | 0.0 - 0.3 | 100 | 0.0 - 0.8 | 25 | |
| ApTOTAL | 0.5 - 0.7 | 0.2 - 0.5 | 100 | 0.0 - 1.2 | 5 - 25 | |
| 15327+2340(PA75*) | Ap A | 0.5 - 0.7 | 0.0 - 0.3 | 60 | 0.0 - 0.6 | 10 - 35 |
| Ap B | 0.5 - 0.7 | 0.0 - 0.3 | 100 | 0.0 - 1.5 | 5 - 25 | |
| Ap C | 0.5 - 0.7 | 0.0 - 0.3 | 100 | 0.0 - 1.5 | 40 | |
| Ap D | 0.5 - 0.8 | 0.0 - 0.3 | 60 | 0.0 - 1.5 | 40 | |
| Ap E | 0.6 - 0.9 | 0.0 - 0.3 | 60 | 0.0 - 1.0 | 25 | |
| Ap F | 0.6 - 0.9 | 0.0 - 0.3 | 100 | 0.0 - 2.0 | 15 | |
| ApTOTAL | 0.5 - 0.8 | 0.0 - 0.3 | 60 | 0.0 - 1.5 | 5 - 30 | |
| 16474+3430 | 5kpc-I | 0.5 - 0.7 | 0.0 - 0.4 | 7 - 8 | 0.3 - 0.4 | 65 - 80 |
| 5kpc-II | 0.5 - 2.0 | 0.0 - 0.2 | 6 - 8 | 0.2 - 0.4 | 30 - 50 | |
| 50 - 90 | 0.0 - 0.2 | 50 | ||||
| Ap A | 0.5 - 2.0 | 0.0 - 0.4 | 6 - 8 | 0.3 - 0.5 | 40 - 75 | |
| 30 - 40 | 0.3 - 0.5 | 40 - 75 | ||||
| 16487+5447NE | 5kpc | 2.0 | 0.1 | 80 | 0.0 - 0.8 | 10 - 20 |
| Ap A | 2.0 | 0.0 - 0.2 | 5 - 8 | 0.2 - 0.3 | 45 - 55 | |
| 30 - 40 | 0.0 - 0.2 | 50 - 60 | ||||
| 16487+5447NW | 5kpc | 0.5 - 0.7 | 0.0 - 0.4 | 4 - 20 | 0.1 - 0.3 | 55 - 85 |
| Ap A | 0.5 - 2.0 | 0.0 - 0.4 | 4 - 60 | 0.0 - 0.4 | 15 - 65 | |
| Ap B | 0.7 - 2.0 | 0.0 - 0.4 | 4 - 8 | 0.2 - 0.3 | 65 - 80 | |
| 17028+5817NE | 5kpc | 0.5 - 1.0 | 0.0 - 0.4 | 4 - 8 | 0.3 - 0.5 | 50 - 65 |
| 17028+5817NW | 5kpc | 0.5 - 1.0 | 0.0 - 0.2 | 60 | 0.8 - 1.5 | 40 - 70 |
| Ap A | 0.5 - 2.0 | 0.0 - 0.4 | 100 | 0.0 - 0.9 | 30 - 85 | |
| 20414-1651 | 5kpc | 0.5 - 2.0 | 0.0 - 0.4 | 4 - 100 | 0.4 - 0.8 | 30 - 65 |
| 21208-0519 | 5kpc I | 0.5 - 2.0 | 0.0 - 0.4 | 5 - 50 | 0.3 - 0.5 | 50 - 82 |
| 5kpc II | - | - | - | - | - | |
| Ap A | 2.0 | 0.0 | 70 - 100 | 0.3 - 0.4 | 40 - 50 | |
| Ap B | 0.5 - 2.0 | 0.0 - 0.4 | 4 - 8 | 0.0 - 0.6 | 35 - 70 | |
| 30 - 100 | 0.0 - 0.6 | 35 - 70 | ||||
| 22491-1808 | 5kpc | 0.3 - 0.5 | 0.0 - 0.4 | 4 - 8 | 0.2 - 0.4 | 45 - 75 |
| Ap A | 0.5 - 2.0 | 0.0 - 0.4 | 100 | 0.0 - 0.8 | 25 - 57 | |
| Ap B | 0.3 - 0.7 | 0.0 - 0.4 | 4 - 7 | 0.3 - 0.4 | 60 - 90 | |
| Ap C | 0.3 | 0.2 - 0.4 | 5 - 6 | 0.2 - 0.4 | 44 - 60 | |
| 23233+2817 | 5kpc | - | - | - | - | - |
| Ap A | - | - | - | - | - | |
| Ap B | - | - | - | - | - | |
| 23234+0946 | 5kpc I | 0.5 - 2.0 | 0.0 - 0.4 | 6 - 30 | 0.4 - 0.6 | 60 - 82 |
| 5kpc II | 1.0 - 2.0 | 0.0 - 0.2 | 100 | 0.5 - 1.5 | 17 - 37 | |
| Ap A | 0.7 | 0.0 | 20 | 0.5 - 0.8 | 15 - 25 | |
| 23327+2913 | 5kpc I | - | - | - | - | - |
| 5kpc II | - | - | - | - | - | |
| Ap A | - | - | - | - | - | |
| Ap B | - | - | - | - | - |
| Object | Aperture | Age of | E(B - V) | Age of | E(B -V) of | %VYSP |
| Name | IYSP | of | VYSP | of | ||
| IRAS | (Gyr) | IYSP | (Myr) | VYSP | ||
| (1) | (2) | (3) | (4) | (5) | (6) | (7) |
| 08572+3915 | 5kpc | 0.5 - 2.0 | 0.0 - 0.4 | 6 - 70 | 0.1 - 0.6 | 30 - 90 |
| Ap A | 0.5 - 2.0 | 0.0 - 0.4 | 100 | 0.0 - 1.0 | 10 - 50 | |
| Ap B | 0.3 - 2.0 | 0.0 - 0.2 | 100 | 0.0 - 0.5 | 10 - 60 | |
| Ap C | 0.3 - 2.0 | 0.0 - 0.4 | 100 | 0.0 - 0.7 | 25 - 100 | |
| 10190+1322 | 5kpc I | 0.7 - 2.0 | 0.0 - 0.4 | 60 | 0.7 - 1.1 | 30 - 65 |
| 5kpc II | 0.7 | 0.2 - 0.4 | 50 - 100 | 0.8 - 1.1 | 30 - 55 | |
| Ap A | 0.5 - 0.7 | 0.0 - 0.2 | 100 | 0.0 - 2.0 | 25 | |
| Ap B | 0.5 - 1.0 | 0.0 - 0.4 | 8 - 30 | 0.8 - 0.9 | 52 - 66 | |
| 10494+4424 | 5kpc | 0.5 | 0.0 - 0.2 | 5 - 10 | 1.1 - 1.3 | 30 - 45 |
| 40 - 60 | 0.8 - 0.9 | 50 - 70 | ||||
| Ap A | - | - | - | - | - | |
| Ap B | 0.3 - 0.7 | 0.0 - 0.4 | 6 - 60 | 0.0 - 0.6 | 45 - 75 | |
| 13305-1739 | 5kpc | 0.5 - 2.0 | 0.0 - 0.4 | 4 - 7 | 0.4 - 0.7 | 50 - 80 |
| 14252-1550 | 5kpc | 0.5 - 2.0 | 0.0 - 0.4 | 90 | 0.5 - 1.3 | 35 - 80 |
| Ap A | 0.5 - 1.0 | 0.0 - 0.4 | 100 | 0.0 - 2.0 | 5 - 80 | |
| 16156+0146 | 5kpc I | 0.7 - 2.0 | 0.0 - 0.4 | 9 - 10 | 0.5 | 60 - 80 |
| 5kpc II | 0.3 - 2.0 | 0.0 - 0.4 | 100 | 0.0 - 0.6 | 20 - 70 | |
| Ap A | 0.5 - 2.0 | 0.0 - 0.4 | 30 | 0.0 - 0.7 | 15 - 81 | |
| 17044+6720 | 5kpc | 0.3 - 1.0 | 0.0 - 0.4 | 7 - 40 | 0.4 - 0.6 | 40 - 87 |
| Ap A | 0.3 - 2.0 | 0.0 - 0.4 | 100 | 0.0 - 0.8 | 30 - 85 | |
| Ap B | 0.3 - 2.0 | 0.0 - 0.4 | 4 - 100 | 0.1 - 0.4 | 40 - 85 | |
| 17179+5444 | 5kpc | 0.7 - 2.0 | 0.0 - 0.4 | 4 - 100 | 0.3 - 1.1 | 25 - 60 |
| 23060+0505 | 5kpc | - | - | - | - | - |
| Ap A | 1.0 - 2.0 | 0.0 | 6 - 7 | 0.7 | 50 - 60 | |
| 40 - 60 | 0.4 - 0.5 | 50 - 60 | ||||
| Ap B | 0.7 - 2.0 | 0.0 - 0.4 | 10 - 50 | 0.0 - 0.5 | 30 - 75 | |
| 23389+0303 | 5kpc I | 0.7 - 1.0 | 0.0 - 0.4 | 6 - 8 | 0-6 0.8 | 50 - 72 |
| 5kpc II | 0.7 - 2.0 | 0.0 - 0.2 | 100 | 0.2 - 0.9 | 25 - 60 | |
| Ap A | 0.5 | 0.0 | 10 - 20 | 0.7 | 40 | |
| Ap B | 0.7 - 2.0 | 0.0 - 0.4 | 7 | 0.8 | 75 | |
| Ap C | 0.7 - 1.0 | 0.0 - 0.4 | 5 - 60 | 0.2 - 0.8 | 35 - 60 | |
| Ap D | 0.7 - 2.0 | 0.0 - 0.2 | 4 - 6 | 0.6 - 0.7 | 40 - 50 | |
| 40 - 100 | 0.2 - 0.4 | 45 - 70 |
APPENDIX
NOTES ON INDIVIDUAL SOURCES
IRAS 00091-0738: optical and near-IR images reveal the presence of several bright knots showing the location of young ( 7 Myr) stellar populations (Surace et al., 2000) in this double nucleus system (NS = 2.2 kpc). The double nucleus structure is not resolved in our spectra and a single 5 kpc aperture was used during the analysis. Our modelling results reveal the presence of a significant contribution from VYSPs in the nuclear region, which is consistent with the results obtained for the extended apertures. IRAS 00091-0738 is classified as an HII-galaxy at optical wavelengths. Therefore, it is possible to use the nebular emission lines in order to provide a further constraint on the ages of the VYSP component. The VYSP age obtained using the Hα equivalent width and the Leitherer et al. (1999) models (EW(H) = 28 Å, tVYSP 7 Myr) is consistent with the lower end of the range of ages found from the modelling.
IRAS 00188-0856: this compact, single nucleus system is classified as a LINER at optical wavelengths. On the other hand, Imanishi et al. (2007) and Valdés et al. (2005) reported evidence of the presence of an AGN in the nucleus of the galaxy based on their near- and mid-IR studies of the object. However, the AGN does not dominate the IR emission, which is likely to be dominated by starburst activity (Lutz et al., 1999; Valdés et al., 2005). The modelling results suggest the presence of a dominant IYSP with a relatively small percentage contribution of any VYSP. Note that, due to the small contribution of the VYSP to the optical light from the galaxy, both the age and reddening of that component are relatively unconstrained.
IRAS 01004-2237: the optical spectrum of this single nucleus system shows a mixture of HII and Seyfert 2 features (Veilleux et al., 1999a), with clear evidence of a buried AGN at IR wavelegths (Imanishi et al., 2007). The modelling results clearly suggest the presence of a dominant VYSP with relatively low reddening. The VYSP ages obtained from the modelling (tVYSP = 9 – 20 Myr) differs than those obtained from the H equivalent width (EW(H) = 58 Å, t 6.5 Myr ). However, given the uncertainties attached to the synthetic templates for very young ages ( 10 Myr), we consider that 3 Myr is not a major disagreement between the two results.
IRAS 08572+3915: this is double nucleus system consisting of two spirals galaxies in the process of merging, rotating in different planes (Arribas et al., 2000). The nuclear, 5 kpc aperture was centred in the northern nucleus (the secondary nucleus was not covered by the slit), thought to be responsible for the far-IR emission from the source (Condon et al., 1991; Soifer et al., 2000; Evans et al., 2002; Nagar et al., 2003). The HST-WFPC2 image taken by Surace et al. (1998) reveals the presence of several young (tknots = 5 – 10 Myr), massive knots located in both the tails and the nuclear regions. The optical spectrum of IRAS 08572+3915 is a composite of HII and LINER-like features. Although no evidence for the presence of an AGN is found in the optical and near-IR (\al@Veilleux99a,Veilleux99b; \al@Veilleux99a,Veilleux99b), IRAS 08572+3915 shows signs of AGN activity at mid-IR wavelengths (Imanishi & Dudley, 2002; Imanishi et al., 2006; Armus et al., 2007). Moderately reddened VYSPs are found in the norhern nucleus, which contribute significantly to the optical light. The reddenings and ages of the stellar components in the extended apertures are consistent with those of the nuclear aperture.
IRAS 10190+1322: The north-east galaxy of this double nuleus system is brighter at near-IR and radio wavelengths (Murphy et al., 2001; Dasyra et al., 2006b; Nagar et al., 2003), while the south-western nucleus appears the brightest in the optical. Recently, Rupke et al. (2002) classified the north-east nucleus as a LINER and the south-western source as an HII galaxy in their high-resolution spectroscopic study of ULIRGs. No evidence for AGN activity is found at near- and mid-IR wavelengths (Veilleux et al., 1999b, Imanishi et al., 2007), which is consistent with the idea of starburst activity powering the IR luminosity of the source (Farrah et al., 2003). The results obtained from the modelling suggest that the VYSPs are concentrated in the two nuclei of the galaxy, and in the region in between, coinciding with large concentrations of gas and dust. In this case, only the extracted spectrum from aperture 5kpc-I shows clear HII-like region features. The VYSP age derived using the H equivalent width (EW(H) = 47 Å, t 6.5 Myr) for that region of the galaxy is consistent with the lower end of the range of ages found for the VYSPs from modelling the optical continuum.
IRAS 10494+4424: the modelling results obtained using near-IR and optical photometric points clearly suggest a starburst as an ionizing source for this single nucleus system (Farrah et al., 2003), which is classified as a LINER in the optical (Kim & Sanders, 1998). Modelling the optical spectra, we find that the VYSPs located in the nuclear and the northern region of the galaxy make a significant contribution to the optical light. However, adequate fits for Ap A (sampling a region towards the south of the galaxy) are only obtained using Comb I, with the optical light dominated by a 400 Myr IYSP with little or no reddening, plus a small contribution from a 12.5 Gyr OSP. In terms of reddening, our modelling results clearly provide evidence for higher reddenings towards the nuclear regions of the galaxy.
IRAS 12072-0444: this ULIRG appears as a single nucleus system in the optical and near-IR images of Kim et al. (2002). However a second nucleus becomes apparent in the HST-NICMOS H-band images (Veilluex et al., 2006). This second nucleus was first detected in the WFPC2 images of Surace et al. (1998), but was classified as a super star cluster. More recently, Dasyra et al. (2006a) confirmed spectroscopically the presence of a second genuine nucleus, with a NS = 2.8 kpc. The double nucleus structure is unresolved in our spectroscopic data. The detection of strong [Si IV] emission is evidence for the presence of a buried AGN in this source, classified as a Sy2 galaxy in the optical (Veilleux et al., 1995; Kim & Sanders, 1998). Moderately reddened VYSPs which contribute significantly to the optical light from the galaxy are located in the nuclear region. Comparing the nuclear with the extended apertures, the modelling results suggest the presence of younger, more highly reddened VYSPs in the nuclear regions of the galaxy than in the extended apertures.
IRAS 12112+0305: this double nucleus system is classifies as a LINER in the optical, shows no evidence for powerful AGN activity (Genzel et al. 1998; Veilleux et al., 1999b), and is classified as a starburst at all other wavelengths studied (Lutz et al., 1999; Franceschini et al., 2003; Risaliti et al., 2006; Armus et al., 2007). The modelling results show the presence of dominant, relatively high reddened VYSPs located in the north-eastern nucleus (5 kpc-I), which is the brightest at optical wavelengths. For this object, the ages and percentage contributions to the flux for both nuclei and the region in between are consistent. On the other hand, our results suggest increasing concentrations of obscuring dust towards the northern source.
IRAS 12540+5708: also known as Mrk231, IRAS 12540+5708 is the most luminous ULIRG in our sample (log(LIR) = 12.54). This object is classified as a Sy1 galaxy in the optical, and considered an AGN-powered ULIRG based on mid- and near-IR spectroscopy (Lutz et al., 1999; Rigopoulou et al., 1999). However, the fraction of the bolometric luminosity produced by the AGN remains controversial. Despite its warm mid- to far-IR colours, Davies et al. (2004) found that star formation within the inner 300pc is responsible for 25% – 40% of the entire luminosity of the galaxy, and that starburst activity seems to power most of the far-IR luminosity (Downes & Solomon, 1998; Farrah et al., 2003). On the other hand, ages from a few Myr in the inner parts of the galaxy, up to ages of order of Gyr in the extended regions, have been found for the stellar populations in the galaxy (Surace et al., 1998; Canalizo & Stockton, 2000a; Davies et al., 2004)
Due to ghost images affecting many of the apertures in the red arm, it was only possible to model the extracted spectra from the blue arm, with the exception of Ap C. In addition, the powerful AGN emission prevents any attempt at modelling the stellar populations for those apertures sampling the nuclear regions (5 kpc and Ap D). Therefore, only the extracted spectra from apertures A, B, C and E were used for the analysis of the stellar populations presented here. Note that Ap C samples the bright condensation (the “horseshoe”, Hamilton & Keel, 1987) 3 kpc to the south of the galaxy, as seen in the HST-WFPC2 images taken by Surace et al. (1998). Figure 7 shows the position of the slit and the extent of Ap C, superimposed on the Surace et al. (1998) HST-WFPC2 F439W image. In order to minimize the potential AGN contamination (including the seeing disk of the bright AGN and any dust-scattered AGN light), the spatial axes of the blue and red 2-D frame were reversed. The reversed and the original frames were registered and then subtracted. A spatial cut of the subtracted 2-D frame is shown in Figure 8, as well as the spatial cut of the original frame and the extent of Ap C. It is clear from the figure that any AGN contamination has been removed, and therefore, we were able to model the full spectral range for this aperture.
The modelling results for Ap C reveal the presence of a VYSP with a low reddening ( = 0.0 – 0.1) and ages in the range 50 80 Myr, that accounts for almost the entire optical light within the aperture (PVYSP = 70 – 96%). It is worth noting that Comb I, Comb II and Comb III provide consistent results for this aperture. In addition, the extracted spectrum shows the clear presence of He I absorption features at various wavelengths, which are indicated in Figure 9. In the models, the He I lines are strongest for single stellar populations (SSP) with ages in the range 20 – 50 Myr, when the stellar population is dominated by B stars (González Delgado et al., 2005), and are not observed in stellar populations older than 100 Myr (the lifetime of B stars). Therefore, the presence of such features helps to provide a further constraints on the age of the VYSP component within the aperture. The detection of the He I absorption lines is consistent with the lower end of the range of ages of the VYSP component deduced from modelling the continuum.
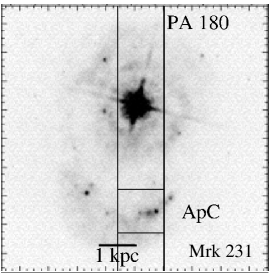
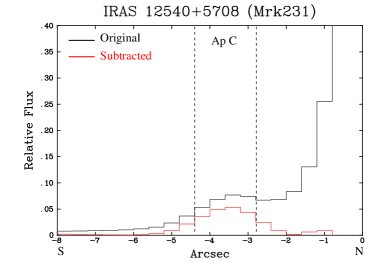

Previous spectroscopic studies already revealed the presence of YSPs in the host galaxy of Mrk 231 (Hamilton & Keel, 1987; Canalizo & Stockton, 2000b). Canalizo & Stockton (2000b) carried out a similar study to that presented here, modelling the optical spectra extracted from a series of apertures sampling various regions of the galaxy. In order to fit the extracted spectra, they used a combination of a 10 Gyr OSP plus unreddened YSPs with varying ages. This is similar to the Comb I used here, although reddening effects are only fully considered in this study. Their “regions” a, b, c and k are similar to our Ap C, Ap B, Ap A and Ap E, respectively, shown in Figure 2. They found YSPs with ages of 5 Myr, 140 Myr and 42 Myr for region c, b and a, respectively, which is consistent with the modelling results found here using Comb I. On the other hand, they found no evidence for significant YSPs in region k, similar to the Ap E used here. However, we find important YSPs (YSP% = 50 – 70%) within that aperture, with ages and reddening in the range of tYSP = 60 – 100 Myr and = 0.2 – 0.5. This difference is likely to be due to the fact that the rest wavelength range of the spectra used in their study is 3800 – 7000 Å. Therefore, they do not sample the near-UV, which is a crucial region of the spectrum for constraining the properties of the YSPs. In addition, it is notable that only unreddened synthetic templates are used in the Canalizo & Stockton (2000b) study, whilst reddened YSPs are required to fit the data in the case of Ap E.
IRAS 13305-1739: the optical spectrum of this very compact ULIRG is that of a Sy2 galaxy. In addition, Veilleux et al., 1999b found broad Pa and [Si IV] emission at near-IR wavelengths – clear evidence of the presence of a quasar/AGN – in the nucleus of the galaxy. A single nuclear aperture was used for the analysis of the stellar populations in this object. We find a moderately reddened, dominant VYSP component with a remarkably narrow range of ages (4 7 Myr).
IRAS 13428+5608: also known as Mrk 273, this galaxy shows an impressive tidal tail extended over 30 kpc towards the south of the galaxy. Seen as a single-nucleus object in UV/optical images (Surace et al., 2000; Kim et al., 2002), a double nucleus structure emerges at near-IR (Armus et al., 1990; Majewski et al., 1993; Knapen et al., 1997; Scoville et al., 2000) and radio (Ulvestad, 1984; Condon et al., 1991; Cole et al., 1999) wavelengths, with a nuclear separation of 700 pc. The double nucleus structure is unresolved in our spectroscopic data. Classified as a Sy2 at optical wavelengths, IRAS 13428+5608 is a composite object powered by both starburst and AGN activity (Armus et al., 2007). However, the dominant power source remains controversial.
In order to perform a detailed study of the stellar populations detected at optical wavelengths, a total of 7 apertures were extracted, sampling the nuclear region and the large tidal tail. In the case of the nuclear 5 kpc aperture, we find an “old” IYSPs (tIYSP = 0.7 – 2.0 Gyr) with low reddening which dominates the optical emission, with a smaller contribution from a VYSP component with higher reddening. Previous optical spectroscopy already revealed the presence of a mix of stellar populations in the nuclear region of Mrk273 (González Delgado et al., 2001). In a broad-brush sense, the results presented here are consistent with those of González Delgado et al. (2001). The extended apertures sample the prodigious tidal tail to the south of the galaxy and the north of the nuclear region. Overall, the results show a remarkable uniformity, with a dominant “old” IYSP present at all locations in the galaxy, out to a radius of 30 kpc. It is also notable that a VYSP component is required in order to fit the data for all the apertures, even for those sampling the extended tail. No evidence suggesting the presence of important age or reddening variations across the body of the galaxy is found in the case of Mrk 273.
IRAS 13451+1232: also known as PKS1345+12, this is the only ULIRG in our sample also classified as a radio galaxy. The activity is concentrated in the western nucleus, which is the only nucleus covered by the two slit positions used for this object. This nucleus is classified as a Sy2 in the optical (Veilleux et al., 1999a), and a compact source at radio wavelengths (Evans et al., 1999). Significant young stellar populations have already been detected in PKS1345+12 at optical and near-IR wavelengths (Surace et al., 1998; Tadhunter et al., 2005), which may have been formed as a consequence of the merger.
A detailed analysis of the stellar populations within the galaxy, using the so-called Comb I, was already presented for this object in Rodríguez Zaurín et al. (2007). We emphasize that prior to modelling the data for both the Rodríguez Zaurín et al. (2007) study and this work, we subtracted the best model for the nebular continuum emission from the detailed emission line modelling work of Holt et al. (2003), in the case of the 5 kpc aperture (i.e. the “NUC” aperture in Rodríguez Zaurín et al., 2007). Such emission is also likely to be important in the cases of Ap A and Ap B in PKS 1345+12. For these two apertures, both the results from the modelling using the nebular corrected and uncorrected spectra are presented in Table 5
In this study, we use an updated version of the code that allows a more detailed analysis of the different, important regions of the optical spectra and, therefore, it is possible to refine the results presented in Rodríguez Zaurín et al. (2007). In addition, the extracted spectra are also modelled using Comb II and III. In general terms, the results found here are consistents with those of Rodríguez Zaurín et al. (2007), suggesting that a VYSP may not be as important in the case of PKS 1345+12 as for other ULIRGs. In addition, we find that adequate fits are also obtained for all the apertures with an “old” IYSPs (tIYSP = 1.0 – 2.0 Gyr) that dominate the flux at all locations sampled by the apertures. Due to the small percentage contribution of the VYSP component, the age and reddening of this component are relatively unconstrained, which explains the wide range of ages and reddening presented in Table 9. Finally, note that this is the most massive galaxy in our sample, in terms of its stellar population.
IRAS 13539+2920: two 5kpc apertures, sampling the two nuclei of this double nucleus system, were extracted for this object. For the western nucleus (5kpc-II), which is the brightest at optical wavelengths, we find highly reddened VYSPs that contribute significantly or dominate the optical emission. For the eastern nucleus (5kpc-I), we find ages consistent with those of the western source, but with lower reddening values. On the other hand, IRAS 13539+2920 is spectroscopically classifed as an HII-galaxy in the optical. However, modelling the emission lines of the extracted spectra for aperture 5kpc-II, sampling the nucleus to the west of the galaxy, we find [OIII]5007/H and [NII]6583/H emission-line ratios consistent with a combination of an HII-galaxy and a LINER. Moreover, the 1D-spectrum of that nucleus shows clear signs of line splitting, indicating the presence of ionized gas outflows. On the other hand, no evidence of HII-like region features is found in the case of the eastern source, sampled by aperture 5kpc-I (it has a LINER spectrum). Therefore, no attempt to estimate the age of the VYSP using the H equivalent width was made for this galaxy.
IRAS 14060+2919: we find a moderately reddened, 7 Myr VYSP component that dominates the optical emission in the nuclear region of this single nucleus system. In general terms, the results for the extended apertures are consistent with those in the nuclear region, except for perhaps a slightly smaller VYSP contribution in Ap A (although Ap A is not so well constrained because it is noisier). In addition, IRAS 14060+2919 is classifed as an HII galaxy at optical wavelengths. The H equivalent widths measured for Ap B, Ap C and 5kpc ( 77 Å 177 Å) reveal the presence of VYSPs younger than 6 Myr, which is consistent with the continuum modelling results.
IRAS 14252-1550: classified as a LINER in the optical, no signatures of buried quasar activity are found in the 5-35 m mid-IR spectrum of this double nucleus system (Imanishi et al., 2007). The modelling results are consistent with a wide range of VYSPs ages, reddenings and percentage contributions. No clear evidence suggesting the presence of important age or reddening variations is found.
IRAS 14348-1447: This is a double nucleus system, in which the ULIRG activity is likely associated with the southern nucleus, which dominates the near-IR luminosity. Several bright knots are seen in the in the U’-, B- and I-band images (Surace et al., 2000; Surace & Sanders, 2000), some of the knots with estimated ages younger than 5-7 Myr (Surace et al., 2000). The optical spectrum of IRAS 14348-1447 is that of a LINER (Veilleux et al., 1995; Kim & Sanders, 1998), and is classified as as starburst-powered ULIRG at near-IR, mid-IR, and X-ray wavelengths (Veilleux et al., 1997; Genzel et al., 1998; Lutz et al., 1999; Franceschini et al., 2003; Farrah et al., 2003; Risaliti et al., 2006). We find significant, or even dominant VYSPs, with a wide range of reddening values, located in the nuclei of the system. Note that in the case of the north-eastern nucleus (5kpc-II) the model solutions for the VYSPs divide into two groups: a younger group of 7 – 8 Myr, and a second, older, group with ages of 50 – 80 Myr. In this case, we cannot distinguish between the two groups using the detailed fits. However, modelling the emission lines of the extracted spectra for aperture 5kpc-II we find [OIII]5007/H and [NII]6583/H emission-line ratios consistent with an HII-galaxy. The VYSP age obtained using the Hα equivalent width (EW(H) = 51 Å, tVYSP 6.5 Myr) is consistent with the first group of adequate fits, including the younger YSP component. Finally, no evidence is found for significant variations in the YSP age and reddening across the body of the galaxy.
IRAS 14394-1447: this IRAS source is a multiple ( 2 nucleus) system, with the two main components separated by 54 kpc – the widest nuclear separation in the ES. The eastern nucleus is classified as a Sy2 and identified with the source responsible for the far-IR luminosity (Veilleux et al., 1999a, Rupke et al., 2005). Dominant, highly reddened VYSPs are found for that nucleus (5kpc-I). On the other hand, the modelling results are consistent with a wide ranges of age and reddening for the VYSP component in the case of the 5 kpc aperture extracted for the western source (5kpc-II). Moreover, adequate fits are only obtained for that aperture using a 2 Gyr IYSP which, in fact, dominates the flux contribution in the normalising bin. These results clearly demonstrate large differences between the stellar populations in the two nuclei, perhaps indicating the presence of a more powerful starburst activity in the eastern component. In addition, two further apertures were extracted to the east and west of the western source. We find no clear evidence for the presence of large age and/or reddening variations across the body of that source.
IRAS 15130-1958: the modelling results are consistent with VYSPs with a wide range of ages, reddenings and percentage contributions for the single 5kpc aperture extracted for this single nucleus system, classified as a Sy2 in the optical. In addition, Wolf-Rayet (WR) features are detected for this galaxy. The detection of such features indicates ongoing star formation activity. Figure 10 shows the wavelength range 4450 – 4750 Å for the spectrum of the galaxy and a mid-type WN5-6 star spectrum in the Milky Way (Paul Crowther, private communication). The aim of this figure is to compare the morphology of the two spectra in the relevant wavelength range. The figure shows the detection of the NIII4634 and the HeII4686 features in our spectrum, consistent with the presence of WR stars. The detection of such features indicates ongoing star formation activity in the case of IRAS 15130-1958. Among all the galaxies in our sample, this is the only case with a clear detection of WR features. Assuming that the VYSP component is associated with the WR features, the detection of these features provides a further constraint on the VYSP ages, i.e. the VYSP ages must be 10 Myr. This is consistent with the lower end of the range of VYSP ages obtained from modelling the continuum.

IRAS 15206-3342: bright knots are observed in the innermost region of this single nucleus system, and also spread over even larger scales, spanning a wide range of ages (from a few Myr up to 2 Gyr, Surace et al., 1998). This object is spectroscopically classified as an HII-like galaxy in the optical (Kim et al., 1998; Veilleux et al., 1999a). Moreover, no evidence for the presence of a buried AGN/quasar is found at IR and radio wavelengths (Veilleux et al., 1997; Nagar et al., 2003; Imanishi et al., 2007). The large nuclear H equivalent width and luminosity are also consistent with a starburst-dominated ionizing source (Arribas & Colina, 2002). We find adequate fits for two groups of combinations of stellar populations. The VYSPs in the first group are younger than 3 Myr, while such component has a age of 10 Myr in the case of the second group. However, the large equivalent width of the H emission line (EW(H) = 315Å), suggest VYSP ages of t 5 Myr. This result favours the first group of adequate fits, including the younger VYSP component, which is also consistent with the upper limit of 20 Myr found by Farrah et al. (2005) on the basis of their UV/optical spectroscopic study of the stellar populations in the galaxy.
IRAS 15327+2340: also known as Arp 220, this double nucleus system is the closest ULIRG in our sample (z = 0.018). The double nucleus structure is unresoved in our spectroscopic data. A biography and a detailed analysis of modelling results are presented for this object in Rodríguez Zaurín et al. (2008). For completeness, the modelling results of Comb I, Comb II and Comb III are shown in Table 5, Table 7 and Table 9, respectively. The extraction apertures and the extracted spectra are also shown in Figures 2 and 6.
IRAS 15462-0450: due to the powerful AGN emission, it was not possible to model the stellar populations in this compact ULIRG, which is classified as a Sy1 galaxy at optical wavelengths. The extraction aperture and the extracted 1D-spectrum are shown in Figures 2 and 6.
IRAS 16156+0146: three apertures were extracted for this double nucleus system, sampling the two nuclei and the region in between. The optical spectrum is that of a Sy2 galaxy, with the AGN activity associated with the north-western source. Moderately reddened, dominant VYSPs of age 9 – 10 Myr are found for that source (5 kpc-I). On the other hand, in the case of the south-eastern nucleus (5 kpc-II), the modelling results are consistent with wide ranges of age, reddening and percentage contribution for both the VYSPs and the IYSPs. It is notable that the minimum percentage contribution of the VYSPs found for the aperture 5kpc-I (60%), is significantly higher than in the case of Ap A and 5kpc-II (20% and 15%, respectively). These results suggest higher concentrations of VYSPs towards the north-west of the system, although we cannot rule out the idea of significant VYSPs at all locations.
IRAS 16474+3430: three apertures were used for the analysis of the stellar populations in this double nucleus system, centered on the nuclei and the region in between. The modelling results found for the southern nucleus (5kpc-I), the brightest at optical wavelengths, reveal the presence of moderately reddened VYSPs (tVYSP = 7 – 8 Myr) that dominate the flux contribution at optical wavelengths. For the other two apertures, the VYSPs are divided into two groups: a younger group with ages in the range 6 - 8 Myr, and a second, older, group with ages in the range 50 – 90 Myr. However, IRAS 16474+3430 is classified as an HII-galaxy, exhibiting HII-like region features at all locations covered by the slit. The values of the H equivalent widths ( 101 Å, 49 Å and 69 Å for 5kpc-I, 5kpc-II and Ap A, respectively) are only attained for stellar populations of 6.5 Myr. This is consistent with modelling results found for the southern nucleus (5kpc-I), and the younger group of VYSPs in the cases of 5kpc-II and Ap A.
IRAS 16487+5447: this galaxy is classified as a LINER galaxy (Kim & Sanders, 1998) in the optical, and shows no evidence for a buried AGN at mid-IR wavelengths (Imanishi et al., 2007), consistent with a starburst as the power source (Lutz et al., 1999). Two slit positions were used during the obervations of this double nucleus system. For the eastern nucleus, the modelling results are consistent with the combination of a dominant “old” IYSP plus a VYSP with a wide range of ages and reddenings. It is notable that adequate fits are also obtained for this nucleus using Comb I, with a dominant 12.5 Gyr OSP. On the other hand, for the western source, we find VYSPs with relatively low reddening, which represent a large fraction of the optical emission from the galaxy. In addition, modelling the emission lines of the 5 kpc aperture for this source we find [OIII]5007/H and [NII]6583/H emission-line ratios consistent with an HII-galaxy. The VYSP age obtained using the Hα equivalent width (EW(H) = 28 Å, tVYSP 7 Myr) is consistent with the lower end of the range of ages found from the modelling. These results clearly demonstrate large differences between the stellar populations in the two nuclei. Finally, no clear evidence is found for the presence of age or reddening trends in the case of the western source.
IRAS 17028+5817: again, two slit PAs were used during the observations of this system, sampling the two, widely separated (25 kpc) galaxies. We find that VYSPs make a large contribution, or even dominate, the flux at optical wavelengths in the two nuclei. However, in the case of the eastern galaxy, classified as an HII-galaxy, we find moderately reddened VYSPs that span a narrow range of ages. On the other hand, the modelling results are consistent with a wider range of ages and significantly higher reddening values for the VYSPs located in the western galaxy, which is classifed as a LINER in the optical. The modelling results obtained for the eastern source are consistent with the age of 6 Myr estimated using the H equivalent width (EW(H) = 102 Å). In addition, we extracted a third, extended aperture (labelled as Ap A in Figure 2), sampling the region towards the south of that source. We do not find clear evidence suggesting the presence of large age or reddening variations.
IRAS 17044+6720: classified as a LINER in the optical, this single nucleus system shows strong evidence for the presence of obscured AGN activity at mid-IR wavelengths (Imanishi et al., 2007). The modelling results found in the nuclear region of the galaxy are consistent with VYSPs of relatively low reddening, that make a large contribution to the flux at optical wavelengths. Comparing these results with those found for the extended apertures, we do not find clear evidence for the presence of significant age and/or reddening variations across the body of the galaxy. Note that Ap B (see Figure 6) has line ratios typical of an HII region ([NII]6583/H = 0.24 and [OIII]5007/H = 3.0). The estimated H equivalent width is EW(H) = 113 Å. Such high equivalent width is only attained for stellar populations younger than 6 Myr, which is consistent with the lower end of the age range obtained for Ap B from the continuum modelling.
IRAS 17179+5444: a single 5 kpc aperture was extracted for the analysis of the stellar populations in this single nucleus object. The optical spectrum of the nucleus is that of a Sy2 galaxy. The modelling results are consistent with a wide range of VYSPs ages, reddenings and percentage contributions.
IRAS 20414-1651: this galaxy is classified as a single nucleus system in the new HST H-band imaging survey carried out by Veilluex et al. (2006). Optically classified as an HII galaxy (Kim & Sanders, 1998), IRAS 20414-1651 shows no evidence for a buried AGN at near- and mid-IR wavelengths (Imanishi et al., 2007). Farrah et al. (2003) modelled optical and IR photometric data and found that almost the entire IR emission in this source is powered by the starburst. Our modelling results reveal the presence of an important contribution to the flux from relatively highly reddened VYSPs. The age of 6 Myr estimated using the H equivalent width (EW(H) = 43 Å) is consistent with the lower end of the age range obtained from the modelling.
IRAS 21208-0519: this double nucleus system is classified as an HII-galaxy in the optical. However, the northern nucleus, the brightest at optical and near-IR wavelengths, is the only region of the galaxy clearly showing HII-like features in our spectra. The modelling results found for that nucleus (5kpc-I) are consistent the presence of moderately reddened, dominant VYSPs. The H equivalent width found for that region of the galaxy (EW(H) = 45 Å) indicates VYSPs of age 6.6 Myr. This is consistent with the lower range of ages found from the modelling for this component. However the modelling results found for southern nucleus (5kpc-II), reveal the presence of a dominant 12.5 Gyr OSP plus an “old” VYSP (90 – 100 Myr) with low reddening, that makes a small contribution to the flux in the optical. Intriguingly, an important contribution from a VYSP component is again required in order to model the extracted spectrum from Ap B, centred in the bright blob to the south of the galaxy (see Kim et al., 2002, their Figure 1). Finally, the modelling results for Ap A, sampling the region between the nuclei, are consistent with a mix of stellar populations from the two nuclei.
IRAS 21219-1757: this object is classified as a Sy1 galaxy at optical wavelengths. Therefore, due to the powerful AGN emission, it was not possible to model the stellar populations of this compact ULIRG. The extraction aperture and the extracted 1D-spectrum are shown in Figures 2 and 6.
IRAS 22491-1808: several knots and condensations located in both the tidal features and the nuclear region are visible in the high-resolution BIHK′-band images presented in Surace et al. (2000). The estimated ages cover a wide range from 5 – 7 Myr up to a few hundred Myr. With the optical spectrum of an HII galaxy (Veilleux et al., 1995), IRAS 22491-1808 shows no signs of obscured nuclear activity at IR wavelengths (Genzel et al., 1998; Veilleux et al., 1999b; Imanishi et al., 2007) and it is therefore classified as a starburst-powered ULIRG (Lutz et al., 1999; Armus et al., 2007). Due to the small nuclear separation, and the fact that the slit is not perfectly aligned with the double nucleus structure, the 5 kpc aperture includes emission from both nuclei. Therefore, we decided to use another two apertures to sample the eastern (Ap B) and western (Ap C) nuclei individually.
The modelling results found for both nuclei are consistent with the presence of moderatelly reddened VYSPs that make an important contribution, or even dominate, the flux at optical wavelengths. Unsurprisingly, the modelling results for the 5 kpc aperture are consistent with the mix of stellar population in the two nuclei. The VYSP age determined from the H equivalent widths ( 64 Å and 46 Å for Ap B and C, respectively, corresponding to VYSPs of age 6.5 Myr), is consistent with the results obtained from the modelling. Furthermore, the extracted spectra for Ap B and C (and also 5kpc) show the clear presence of He I absorption features at various wavelengths, which are indicated in Figure 11. These lines are not observed in stellar populations older than 100 Myr and, therefore, provide further evidence for the presence of significant VYSPs in the two nuclei of the galaxy. Finally, Ap A was extracted to sample the tidal tail towards the north-west of the galaxy. Overall we do not find clear evidence for the presence of significant age/reddening gradients across the body of the galaxy.


IRAS 23060+0505: this single nucleus system is classified as a Sy2 in the optical, and shows clear signatures of AGN activity at mid-IR wavelengths (Genzel et al., 1998; Lutz et al., 1999). For the nuclear region adequate fits are only obtained using Comb II, including a 10 Myr VYSP, a “red” power law component (p.l. index = 6.1) and a 12.5 Gyr OSP making contributions to the optical light of 72%, 6% and 22% respectively. It is worth remembering that these are percentage contributions in the normalising bin, which in the case of IRAS 23060+0505 is located at a wavelength range of 4450 - 4550 Å. The contribution of the power-law component becomes more important with increasing wavelength, and is as high as 43% at 6800 Å. This is consistent with the results of Veilleux et al. (1997) who found a strong broad Paα line at near-IR wavelength, providing evidence for a significant contribution from a highly obscured AGN. For the other two apertures, Ap A and B, adequate fits are obtained using all combinations (i.e. the YSP properties are relatively unconstrained).
IRAS 23233+2817: Kim et al. (2002) described this object as: “the only object in the 1 Jy sample with no obvious signs of interaction”. Our Ap A samples a region to the south of the nucleus, including the bright knot detected in the Kim et al. (2002) K-band image. These authors described the latter as a bright HII regions on the basis of their luminosities and colours. However we identified this knot as an M star in the galaxy based in our spectroscopic data (see Figure 6). In the case of the 5 kpc aperture, adequate fits were obtained using Comb I and Comb II, but not Comb III. Since the galaxy is classified as a Sy2, we concentrate on the results of Comb II. We find YSPs in combination with a 12.5 Gyr OSP, and power-law that makes a significant contribution to the flux at optical wavelengths. These results suggest that the AGN component is important in the case of IRAS 23233+2817.
IRAS 23234+0946: this double nucleus system is classified as a LINER on the basis of its optical spectrum. The western source is the brightest at optical wavelengths, and shows no sign of AGN activity in the mid-IR (Imanishi et al., 2007). The modelling results found for this nucleus (5 kpc-I) are consistent with the presence of VYSPs that dominate the flux in the optical. Comparing these results with those of the other two apertures, it is notable that the percentage contribution of the VYSP component in the western nucleus (60 – 82%) is significantly higher than in the eastern nucleus and the extended structure to the east of the galaxy (17 – 37%). Intriguingly, while high reddening values are found for the VYSP component ( = 0.5 – 1.5) to the east of the galaxy (5kpc-II and Ap A), lower reddening values ( = 0.4 – 0.6) are found for the western source.
IRAS 23327+2913: initially, two 5 kpc apertures were extracted sampling the two nuclei of this double nucleus system. In order to look for possible variations of the stellar populations within the galaxy when sampling larger regions, two additional, wider apertures were extracted, also centered on each nucleus. The extracted spectra for these apertures are identical to those of the 5 kpc apertures and therefore are not shown in Figure 6. In the case of the southern source (5kpc-I) an OSP is always required in order to model the extracted spectrum. The modelling results of Comb I are consistent with a mix of a 12.5 Gyr OSP plus a moderately reddened VYSP of 9 Myr that dominates the flux at optical wavelengths. On the other hand, this object is classified as a LINER at optical wavelengths and shows no evidence for a buried AGN (Imanishi et al., 2007). Therefore, it is likely that the power-law component used in Comb II accounts for a VYSP in this case, and it is possible that we are detecting the contribution of three different stellar components to the optical light: a 12.5 Gyr OSP plus important contribution from a highly reddened VYSP younger than 5 Myr (represented by a power-law with power-law index = 1.54) and a VYSP of age 10 Myr and lower reddening. In the case of the northern galaxy (5kpc-II), it is possible to model the extracted spectrum using a single OSP of age 12.5 Gyr, with no need for any additional stellar component. Again, an OSP is always required to model the data. This demonstrates large differences between the stellar populations in the two nuclei.
IRAS 23389+0300: the northern source of this double nucleus system is the brightest galaxy in the radio, known to have a milli-arcsecond radio core and extended radio emission (Nagar et al., 2003). Two 5 kpc apertures were extracted for this Sy2 galaxy, centred on the two nuclei. In order to perform a more detailed analysis of the stellar populations, an additional set of four smaller apertures was extracted sampling various regions of the galaxy. The extracted spectra from Ap B and D are identical to those of 5kpc-I and 5kpc-II, and hence, they are not shown in Figure 6. The modelling results suggest the presence of younger VYSPs towards the north of the system, although we cannot rule out the idea of VYSPs of similar age at all locations sampled by the various apertures. In terms of reddening, we find no clear evidence for the presence of significant variations across the body of the galaxy.