On the bar pattern speed determination of NGC 3367
Abstract
An important dynamic parameter of barred galaxies is the bar pattern speed, . Among several methods that are used for the determination of the Tremaine-Weinberg method has the advantage of model independency and accuracy. In this work we apply the method to a simulated bar including gas dynamics and study the effect of 2D spectroscopy data quality on robustness of the method. We added a white noise and a Gaussian random field to the data and measured the corresponding errors in . We found that a signal to noise ratio in surface density introduces errors of for the Gaussian noise, while for the white noise the corresponding errors reach . At the same time the velocity field is less sensitive to contamination. On the basis of the performed study we applied the method to the NGC 3367 spiral galaxy using H Fabry-Perot interferometry data. We found km s-1 kpc-1 for this galaxy.
1 Introduction
The evolution of disk galaxies is strongly influenced by the main structures within their disks, notably spirals and bars. Bars are a fundamental component of mass distribution in spiral galaxies because they may contain a large fraction of the disk. Bar kinematics is different from the one of the axisymmetric disk, which makes the study of bar parameters important, especially the bar pattern speed (). Bar properties are tightly related to the mass distribution of the host galaxy. The shape and structure of the bar, such as vertical bending (buckling), is believed to depend on the stage of evolution (Athanassoula, 2003). Moreover, is one of the fundamental parameters in driving the evolution of bars. Noguchi (1987) finds from numerical simulations that tidally-induced bars rotate slowly in comparison with spontaneous bars. Thus, bar pattern speed may help to discriminate between spontaneous bars and tidal bars.
One of the first methods applied to bar pattern speed determination is based on the identification of theoretically predicted resonances (Lindblad resonances, corotation), using the rotation curve to extract the periodic motion of stars and gas (Tully, 1974). Contopoulos (1980) demonstrated with orbit calculations that the corotation radius should be located at the end of a self-consistent bar. However, it was shown from a survey of early-type galaxies, that indeed the bar ends rather between the inner resonance and the corotation (Elmegreen et al., 1996).
An alternative method consists of matching numerical models to the observed data (Rautiainen et al., 2005). Two other methods are based on the analysis of spiral density waves. Elmegreen et al. (1992) apply a computer algorithm to extract various types of symmetries from galaxy images, while Canzian (1993) points out the difference in the global appearance of the residual velocity field of a spiral galaxy inside and outside the corotation radius. Tremaine & Weinberg (1984) formulated a method to measure the bar pattern speed that is independent from any spiral density wave theory. The principal assumption of the method is that the surface density of the tracer of the gravitational potential (e.g., old stars) satisfies the continuity equation, i.e., there is no significant destruction or creation of the tracer over a dynamical time. This method allows the measurement of the bar pattern speed with two observational quantities: the surface brightness of the tracer and the velocity of the tracer along the line of sight. So far the method was successfully applied to some twenty galaxies. Kent (1987) and Merrifield & Kuijken (1995) apply this method to the stellar bar component of the SB0 galaxy NGC 936. Gerssen et al. (1999) apply the Tremaine-Weinberg (TW) method to the stellar component of the galaxy NGC 4596. The same authors use the method for the galaxies NGC 271, NGC1358, ESO 281-31 and NGC 3992 (Gerssen et al., 1999). Aguerri et al. (2003) applied the method for the galaxies ESO 139-G009, IC 874, NGC 1308, NGC 1440 and NGC 3412. Debattista & Williams (2001) use the TW method for NGC 7079 and for NGC 1023 (Debattista et al., 2002).
Other authors derived the bar pattern speed applying the TW method to a gaseous tracer. Westpfahl (1998) finds the bar pattern speed for M81 employing HI as a tracer. Using CO observations, Zimmer et al. (2004) employ the method for the galaxies M51, M83 and NGC 6946. Rand & Wallin (2004) consider the galaxies NGC 1068, NGC 3627, NGC 4321 (M100), NGC 4414, NGC 4736 and NGC 4826, and measure the bar pattern speed with CO as a tracer. The application of this method to the gaseous phase is more delicate because of the assumptions of the method itself. In general, the ionized gas, the CO and HI, do not satisfy the continuity equation over an orbital period and do not trace the gravitational potential. However, assuming that the gas is continuously distributed along the pattern, and that the luminosity-weighted mean is a valuable indicator of the mean mass distribution and, neglecting the internal kinematics of H II regions, some authors successfully applied the TW method to the ionized gaseous phase. Hernandez et al. (2004) employ ionized hydrogen 2D velocity fields of four barred galaxies NGC 4321, NGC 3359, NGC 6946, NGC 2903 and also of M51 to measure the pattern speed. The same authors build numerical simulations to investigate the possibility of using the gaseous component and present an application for NGC 4321 galaxy (Hernandez et al., 2005). Emsellem et al. (2006) have successfully applied TW method for bar pattern speed determination of NGC 1068 using Fabry-Perot H map, and also reproduce with Nbody+SPH models a number of its observed properties. Fathi et al. (2007) also with two dimensional ionized hydrogen kinematics determine the bar pattern speed of NGC 6946. Beckman et al. (2007) apply the method to a sample of nine galaxies (NGC 3049, NGC 4294, NGC4519, NGC 5371, NGC 5921, NGC 5964, NGC 6946, NGC 7479, NGC 7741) using ionized hydrogen 2D kinematic data.
In this article we employ the TW method to study the errors in the parameters that may affect the pattern speed determination. We test to which parameters the method is sensitive with numerical simulations and apply this method to the barred galaxy NGC 3367.
2 Numerical test of the TW method
The Tremaine Weinberg method uses two observable quantities: the luminosity weighted velocity and luminosity weighted density determined along a thin strip (aperture) parallel to the major axis of the disk (Tremaine & Weinberg, 1984). If a galaxy is centered at the cartesian coordinates such that the major and minor axes are aligned parallel to the and axes, respectively, then the ratio of intensity-weighted velocity and intensity-weighted position gives the angular velocity:
| (1) |
Here - is the systemic velocity, and is the position of the kinematic center of the disk along axis. The is also corrected due to inclination ( corresponds to face-on disk). This formulation of Merrifield & Kuijken (1995) allows a more accurate evaluation of because the errors in the dynamical center and systemic velocity determination are reduced. Thus, estimating the above expression for several apertures, one may plot vs. and obtain the averaged value of .
One of the conditions required by the TW method is that the tracer should satisfy the continuity equation. The old stars in SB0 galaxies, for example, survive long enough to trace the spiral pattern potential. The main concern regarding the validity of application of the TW method to gaseous tracer is that the ISM, composed mostly of molecular and atomic hydrogen, is not able to trace the potential for a long period of time due to short timescale processes such as phase transitions, cooling, etc. Nevertheless, it was successfully applied to CO emission lines (Rand & Wallin, 2004; Zimmer et al., 2004) and to the H emission line (Hernandez et al., 2005; Emsellem et al., 2006; Fathi et al., 2007). As was shown by Westpfahl (1998) addition or substraction of the tracer material has no effect on calculation of the instantaneous pattern speed, and thus, it is expected that processes of star formation and feedback may be neglected. Hernandez et al. (2005) have demonstrated by hydrodynamical simulations that the application of the method to ionized gaseous phase is reliable under some assumptions. The problem arises rather in the quality of the image and the velocity field as affected by regions of star formations, dust obscuration, and local gas motions. An argument in favor of applicability of the method is that the H image also contains the stellar continuum emission. This should alleviate the problem of a patchy monochromatic image, making it smoother. All these arguments are still have to be carefully verified, and here we assume as a working hypothesis that application of the TW method to the H kinematic data is valid.
As it was shown by Debattista (2003) the method is very sensitive to errors in the determination of the position angle (PA) of the major axis. On the other hand, as shown by Rand & Wallin (2004), the molecular gaseous component may produce a non-zero pattern speed even in the absence of any clear wave pattern due to clumpiness. The latter point requires that the determination of should be done with much caution. In particular, Hernandez et al. (2005) have shown by means of hydrodynamical simulations that the regions of shocks and the zones outside the bar should be avoided. The effects of the inclination, bar orientation, angular resolution, and the uncertainty were already investigated in numerical models by Rand & Wallin (2004).
2.1 Numerical models
In order to test the influence of errors in intensity and 2D velocity fields on the determination of the pattern speed with the TW method we performed numerical simulations of a bar formed in a hydrodynamic (Nbody+SPH) and collisionless (Nbody) disk galaxy.
| Parameter | Gas | Disk | Halo |
|---|---|---|---|
| () | |||
| r0 (kpc) | |||
| () | |||
| (pc) |
For this purpose we prepared a bar unstable disk galaxy consisting of total particles sampling an exponential stellar and gas disks, and a Hernquist halo (Hernquist, 1990). The vertical structure of the disk is described by isothermal sheets with a constant scale height of pc for stars and pc for gas. Gas dynamics obeys the isothermal equation of state with a temperature T K. The processes of star formation and feedback were not included. The model was constructed using a technique similar to that described by Hernquist (1993) and the numerical parameters were chosen according to Gabbasov et al. (2006). The galaxy model parameters are summarized in the Table 1. The simulation was performed with GADGET 2 code on HP CP 4000 cluster (KanBalam) at DGSCA-UNAM.
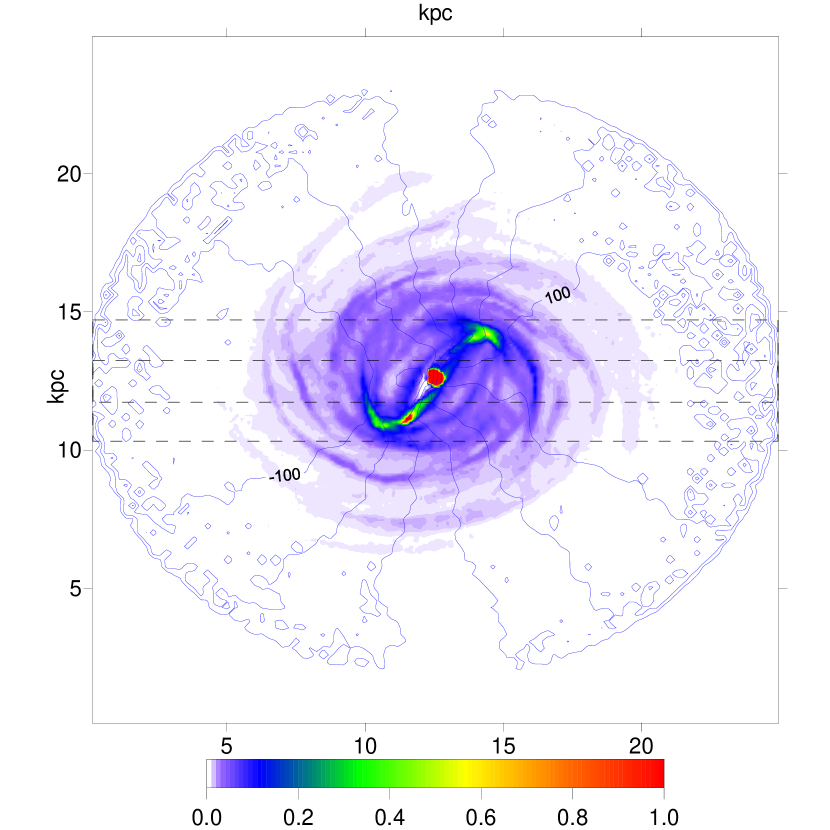
We estimate the bar pattern speed as follows. At each snapshot we determine the orientation of the principal axes of the inertia tensor of the bar. Then, we draw the bar position angle as a function of time, and the is obtained by numerical differentiation, . The bar appears at a time Gyrs and at Gyrs reaches its maximum length of kpc. For Gyrs most of the gas is transferred to the center of the disk. During this period, the angular velocity of the bar remains roughly constant, km s-1. Further evolution leads to the depletion of the gas particles along the bar, and after about Gyrs, the gas is rather located in the center and in the spiral arms. For our analysis we took the snapshot at Gyrs when the bar is oriented from the vertical axis. We added some systemic velocity to the velocity field and inclined the disk by , such that the disk major axis is aligned with the axis. We compute the projected on the sky plane 2D surface density and the velocity fields on uniform cartesian grids of , see Fig. 1. We apply the TW method to simulated stellar and gas bars and compared with the pattern speed obtained from the simulation. A difference of less than km s-1 was found for the stellar bar. The gas pattern speed was overestimated by km s-1, because of the surface density weighting errors. We also applied the method to the galaxy at Gyrs (early stage of evolution without a bar) and obtained a zero slope as expected.
2.2 PA variation
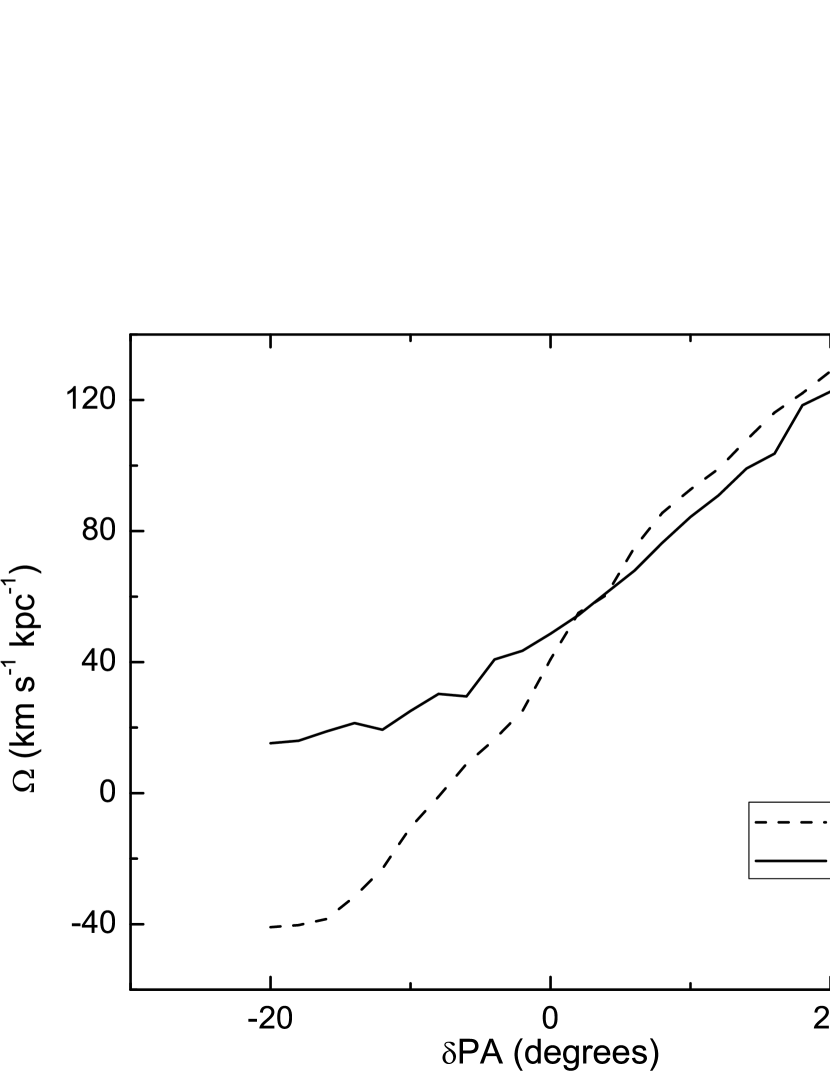
First, we tested the sensitivity of the bar pattern speed to variations of the position of the major axis of the simulated disk galaxy, which could be interpreted as errors in the determination of PA. Here, the variation in the position angle PA, is the angle between the disk major axis and the axis of the fixed reference frame. The resulting is presented in Fig. 2. For the considered range of PA and bar orientation the changes almost linearly. As the bar tends to become aligned with the axis the pattern speed reduces. From this plot one may observe that an uncertainty of PA gives rise to an error in of km s-1kpc-1 for gas bar.
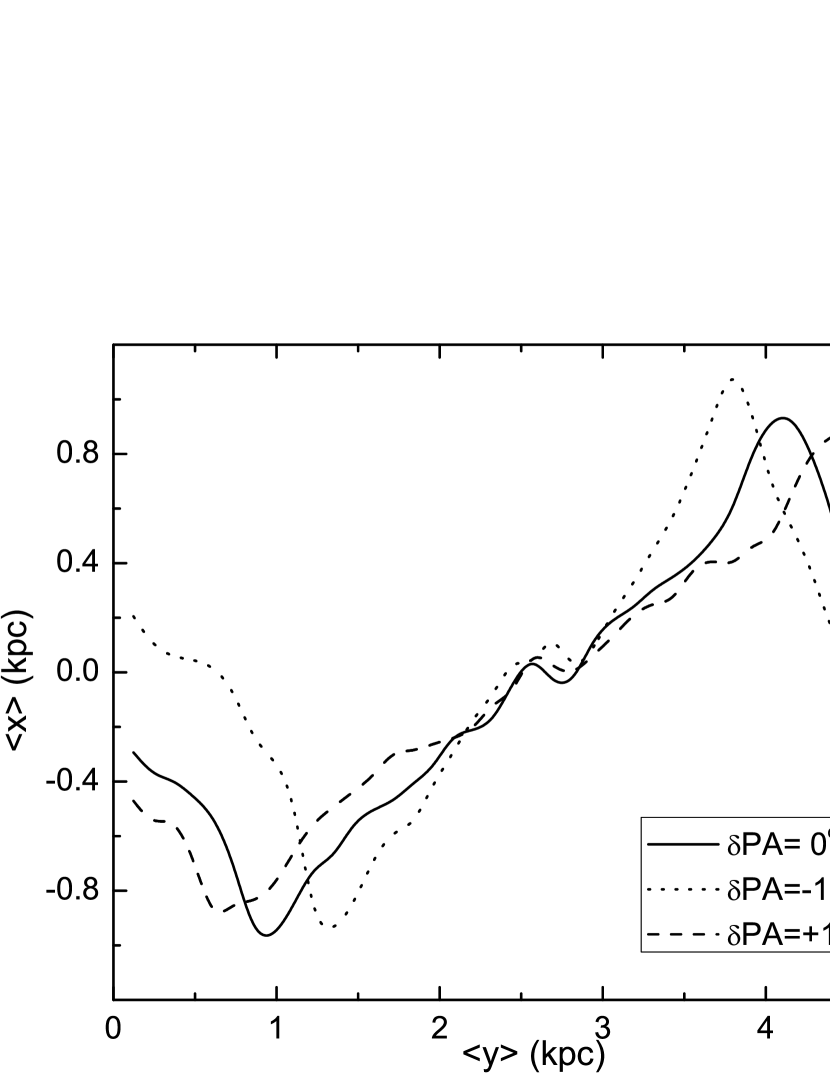
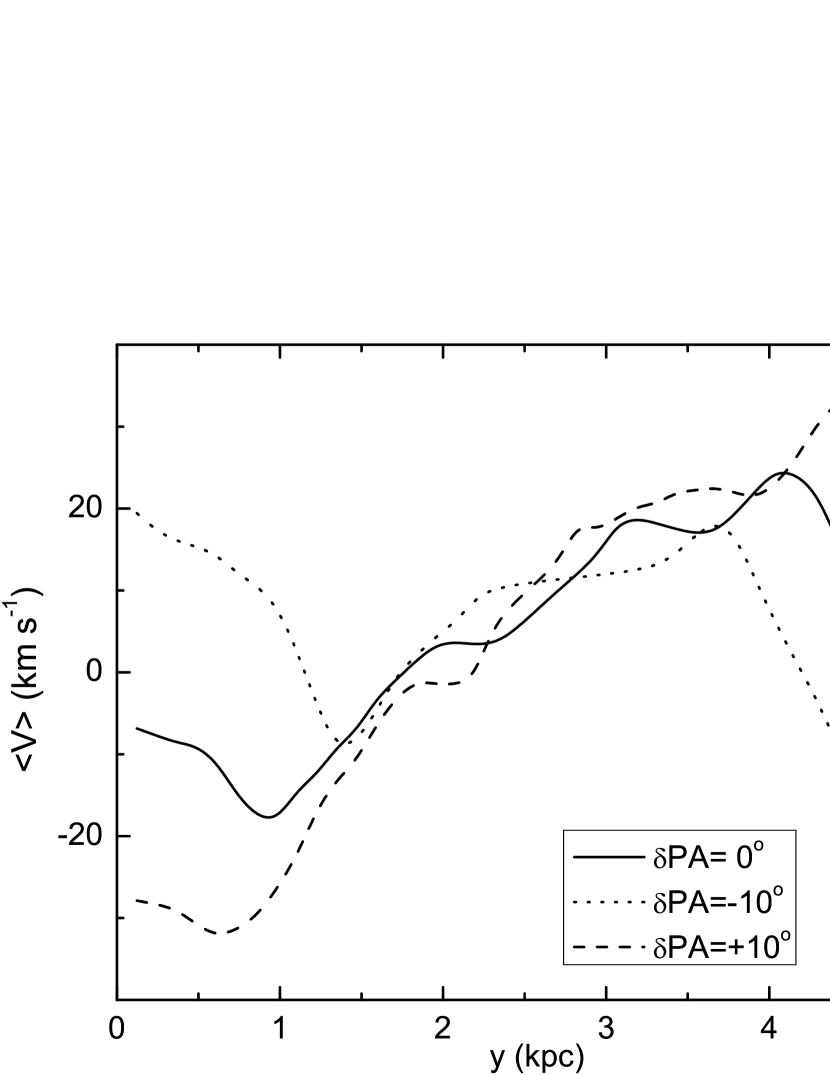
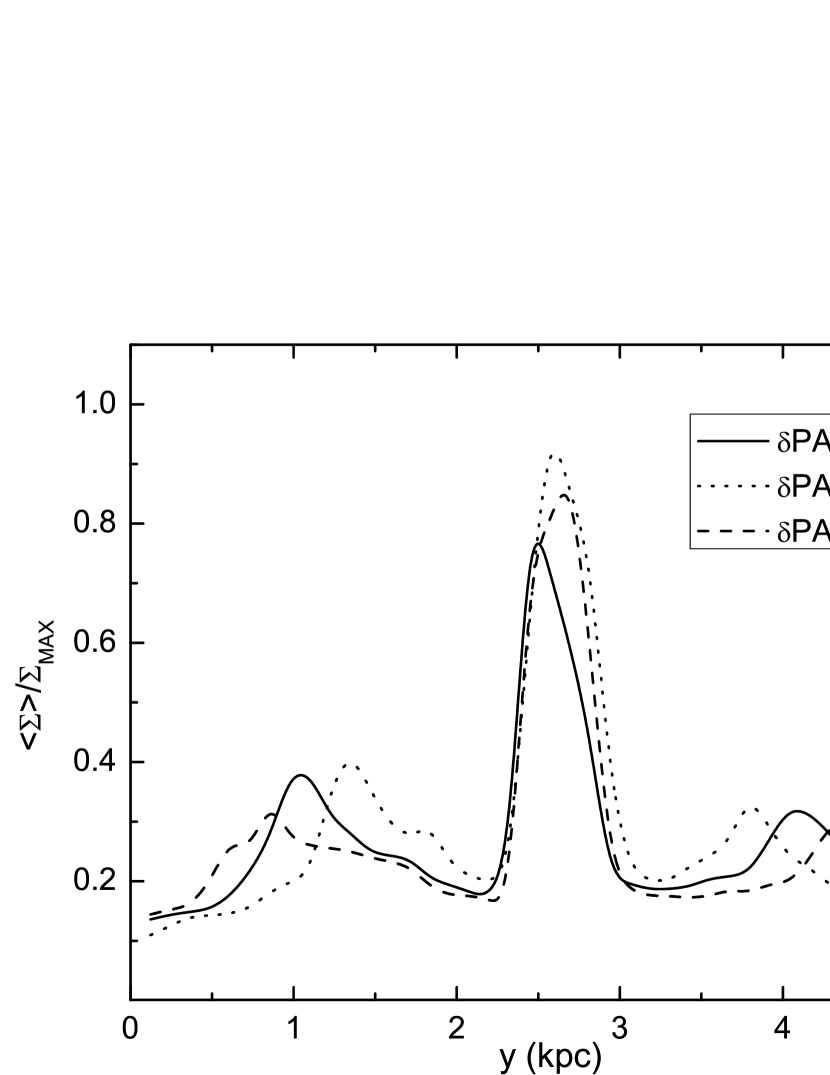
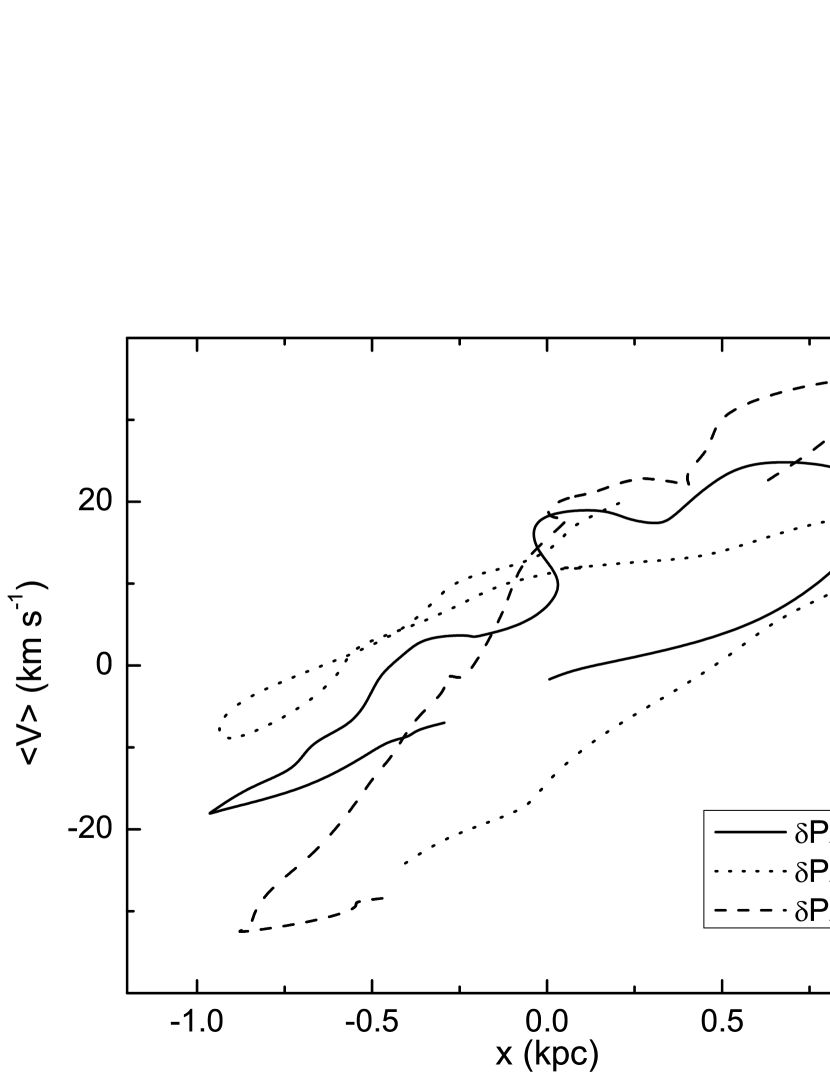
As an example, in Fig. 3 we plot the , , and in Fig. 4 the normalized mean surface density vs. for apertures of width kpc about the kinematic center located at kpc. Also in Fig. 4 shown is the resulting to ratio. In order to avoid a discontinuity in center of these plots we have excluded from the analysis the central four pixels with very high gas density. The plots are shown for PA (solid, dotted, and dashed line, respectively).
As seen from Fig. 3, the weighted average velocity is the most sensitive quantity in the plot, and the difference comes mainly from the ends of the bar, while at the center the slope varies slowly for all three cases. At the same time the slope of changes in opposite direction than , affecting strongly the determined. The decaying intensity and velocity profiles in the first and the last kiloparsec are due to inclusion of the apertures containing spiral arms at the ends of the bar. This is observed as a characteristic -shape, or a loop-shape, in the vs. plot in Fig. 4, instead of a straight line. The weighted averaged intensity also changes the position and the maximum of its shoulders, being nearer to the center and higher for closer alignment of the bar with the axis. Unfortunately, the restriction in does not reduce significantly the errors produced by variation of PA.
2.3 Disk thickness
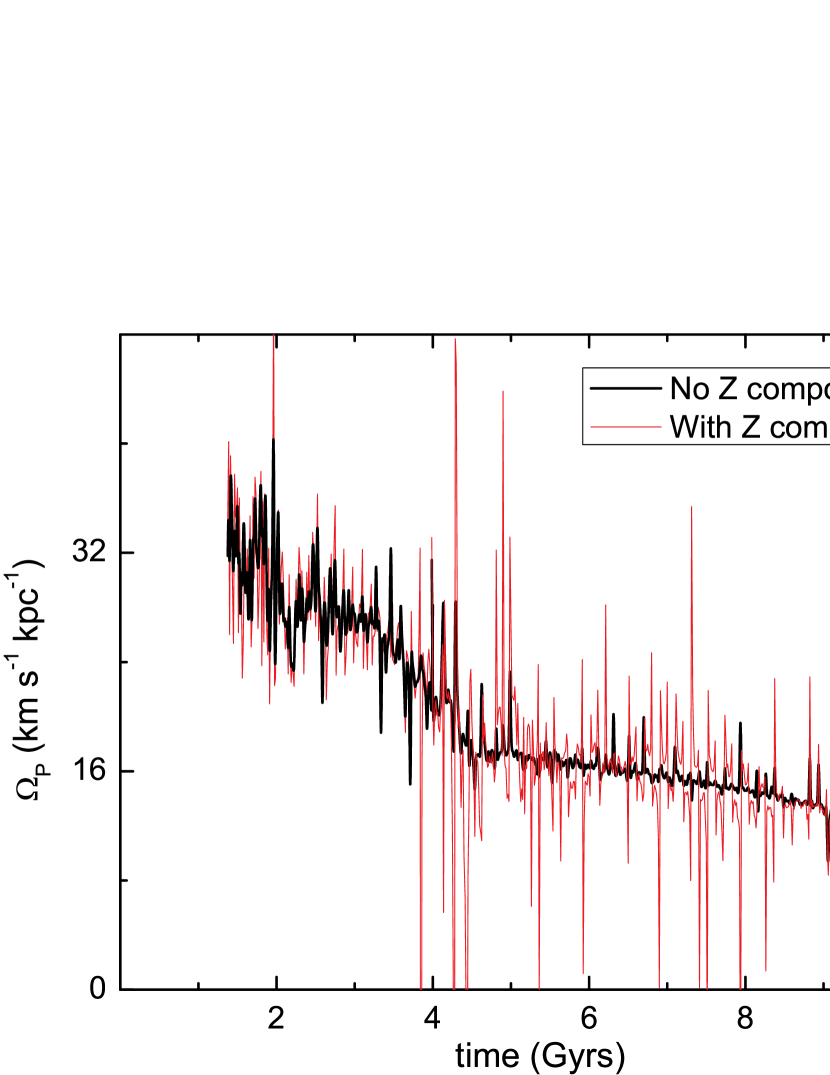
According to the original formulation of the method, it is valid only for an infinitely thin disk. However, galactic disks generally have a certain thickness and line of sight velocities also contain the projected component of velocity normal to the disk ( component, ). This component becomes important as the inclination approaches degrees, i.e., the galaxy becomes face on. For a disk symmetric in the direction the vertical motions cancel out each other, and the net contribution is zero. However,the presence of an asymmetry in vertical structure (such as bar buckling) will also introduce asymmetry in the velocity field. We have verified this argument by including the projected component of velocity in a simulated bar velocity field. For our Nbody+SPH model, evolved for Gyrs, we found no significant difference in for both gas and stellar bars. We also prepared and ran a pure collisionless model, incrementing the stellar disk mass by the mass of removed gas disk. We traced the evolution of the bar up to Gyrs, and quantify the bar buckling as a change of r.m.s. of the vertical velocity dispersion of disk particles, . Due to heating of the stellar disk the vertical dispersions grow linearly until the bar begins to buckle at Gyrs. After the buckling, the r.m.s. dispersions are rapidly increased by and this is reflected in a reduction of the pattern speed slowdown rate, as shown in Fig. 5. The determination of the pattern speed becomes more robust as the spiral arms cease, and the curve that does not include the Z component is much smoother, except for some spikes. In contrast, inclusion of the Z component clearly affects the instantaneous determination due to buckling, but the errors are quite small (a few km s-1). Thus, for old stellar bars, where buckling is strong and the velocity dispersions are high, the vertical motions could make an important contribution to the observed velocity field introducing errors in the determination by the TW method.
2.4 Data quality
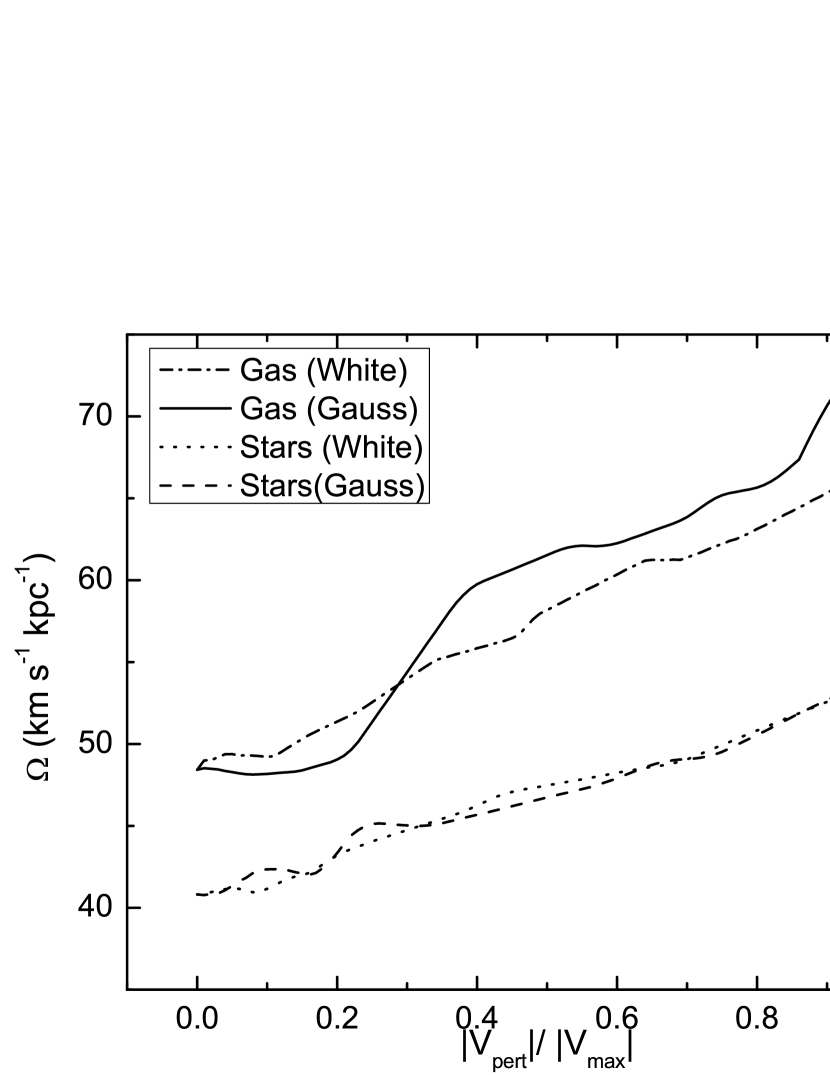
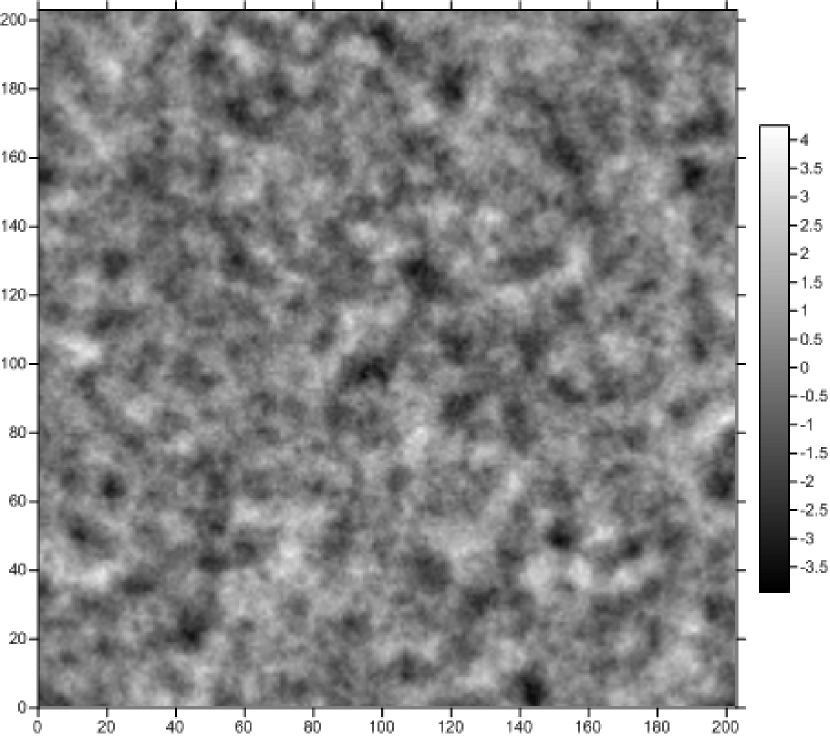
Next, we checked the robustness of the TW method to the introduction of an artificial noise to the surface density and velocity fields. Such noise is naturally present in the observed data. First, we add a white noise background to our simulated surface density field to represent the emission inhomogeneities. The white noise background was created by assigning to each pixel a random value within () in case of intensity field and ) in case of velocity field. Here, and are the maximum values of perturbation of the surface density and velocity field, respectively. The results are shown in Fig. 6. As we increment the amplitude of the perturbation relative to the corresponding maximum value of the surface density () or the velocity field (), the errors become dominant. Indeed, for the ratio (signal to noise ratio ) for white noise, the determination of the pattern speed is not possible anymore because a clear slope cannot be established. As a next step, we test the sensitivity of the method to the Gaussian noise. Besides the observational noise it simulates local gas inhomogeneities in the disk. We create a random Gaussian field with spherical () correlation function and also change its amplitude relative to the maximum value of the signal (see Fig. 7). For this purpose, we used the software developed by Kozintsev & Kedem (2000). When added to the intensity field, the signal is also underestimated, although not so strongly as in the case of white noise. Concerning the velocity field contamination, one can note that the determination of the is possible, even reaching the ratio . However, in the case of the Gaussian random field the errors influence stronger the resulting vs. slope for the gas bar. Note, that the pattern speed is either underestimated or overestimated for different bar positions and, in case of the Gaussian noise, for different realizations of the field.
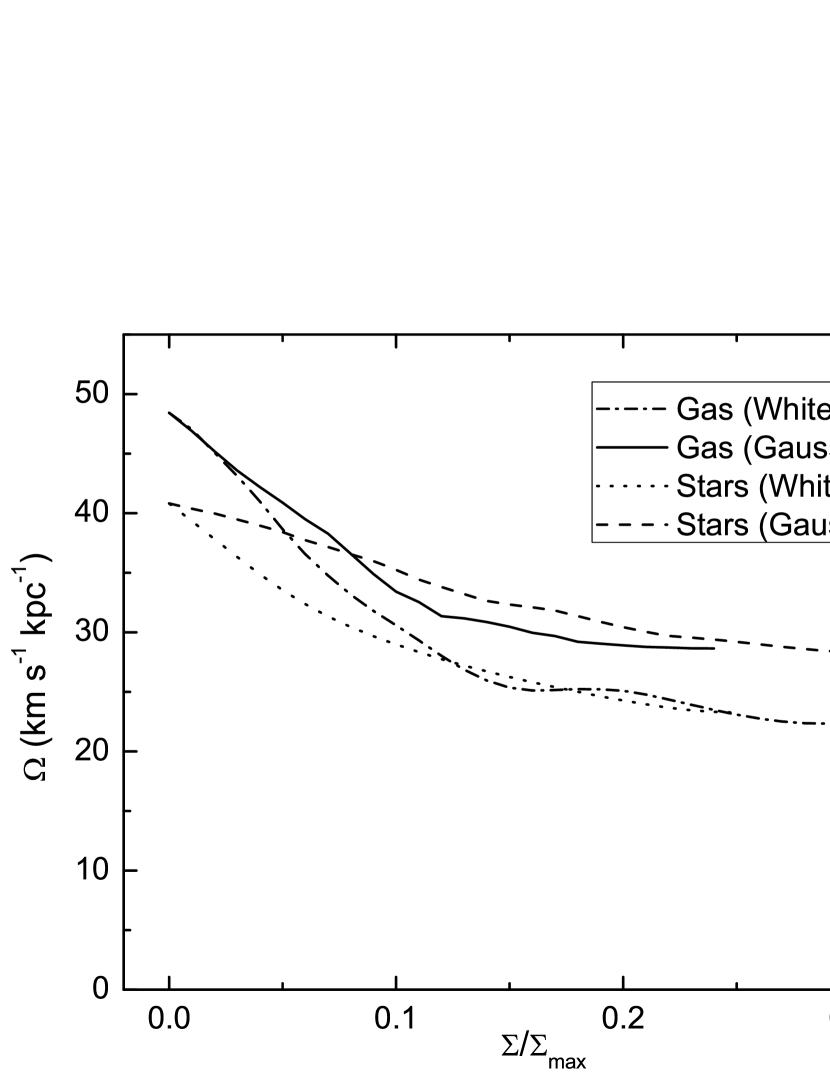
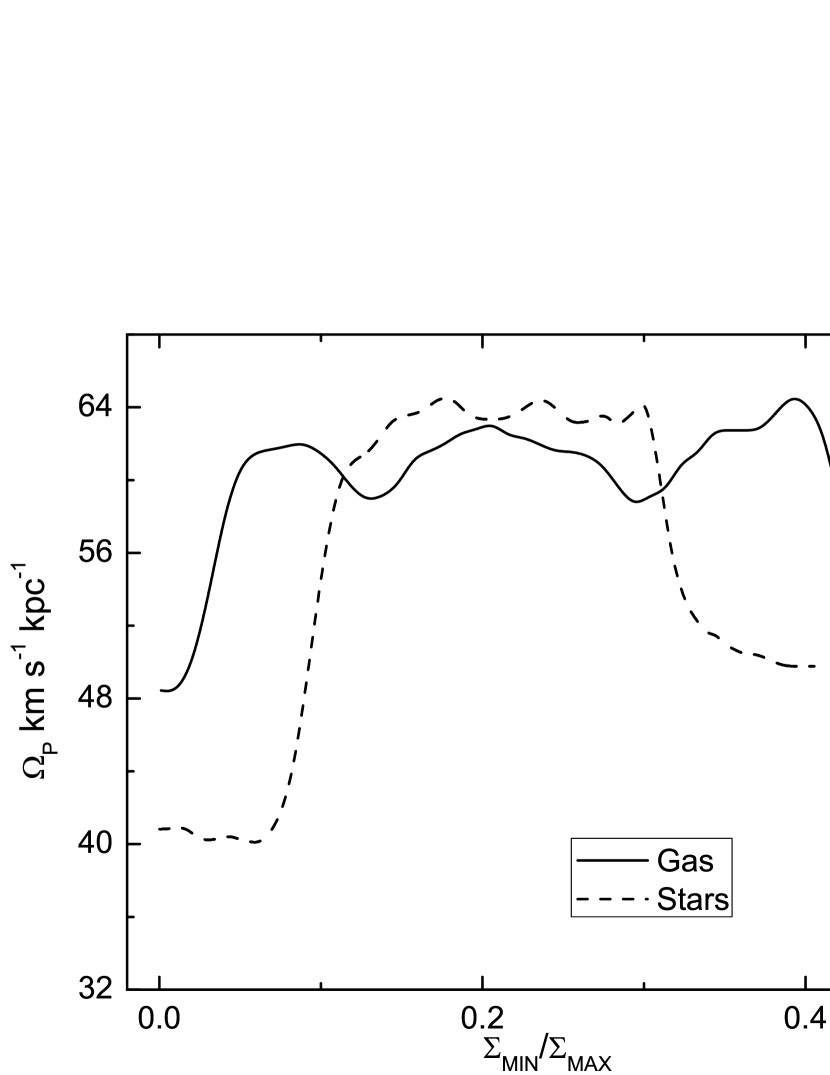
In addition, we investigate the effect of a clipping procedure (i.e., imposing the inferior limit on the surface density) and finding that the effect on the resulting pattern speed has rather non-linear trend as can be seen in Fig. 8. The surface densities of both stellar and gas components were normalized by their respective maximum values. The most sensitive part of the curve is due to clipping of up to a few percent of the maximum surface density, which corresponds to the density of the faint spiral arms and the disk that leads to an overestimation by more than in the pattern speed (cf. surface density distribution in Fig. 1 and Fig. 4). A roughly flat region of the curves where the bar size due to successive clipping diminishes and becomes thinner, the of both gas and stellar bar is reaching km s-1 kpc-1. A rapid drop in the curves corresponds to the clipping when the bar is not continuous anymore, but rather looks like two bright patches, after which the determination of the pattern speed is barely possible. This behavior holds for several snapshots we have analyzed between and Gyrs of evolution. The same mechanism should be responsible for a rapid change in for small values added to the intensity field. Perturbations of the surface density of the the same amplitude as of the faint disk and spiral arms lead to underestimation as shown in Fig. 6. Thus, we may conclude that the role of the spiral arms in the application of the TW method is very important. A similar conclusion was reached by Rand & Wallin (2004) who found that too much clipping could violate the principal assumption of the TW method and lead to incorrect pattern speed determinations. On the other hand, we found that the restriction of the maximum surface density (clipping “from above”) produces the bifurcation in the center of vs. plot (not shown here), creating an effect of presence of two different pattern speeds. The size of the bifurcated area increases with the diminishing of the upper limit of the surface density. If these points are omitted from the linear fit, the resulting pattern speed is not affected.
The observations measure the intensity of H emission line rather than the gas surface density. The results above were analyzed only for the surface density field of gas and stars derived directly from the simulation, but not for the intensity field produced by ionized gas. The original TW method is formulated for the stellar component, where it is assumed that the disk surface density is directly proportional to the number of stars per unit area. However, in the case of the gas, the tracer is sensitive to the square of the density because the regions of ionized hydrogen will produce recombination lines whose rough emissivity is given by
| (2) |
If we assume that the gas is isothermal everywhere in the disk, then the emission map will be a function of gas density squared only. In this case, our simulations show that is overestimated by roughly %. Nonetheless, when the emission map is clipped at the bar level (i.e., masking the spiral arms and disk) the value of is not changed. The same result was found for the the observed H emission map, presented in the next section, if transformed into the surface density of the gas. The clipping is important in this case because the transformation given by equation 2 mainly affects the regions with high density gradients, i.e., transitions between bar and disk.
These results establish the validity margins of the TW method for our models. Although they were determined for a simple galaxy model, they give us the general clues on parameter dependencies. Complete hydrodynamical simulations, including star formation, supernovae feedback and radiative cooling will be presented elsewhere.
3 Application to NGC 3367
NGC 3367 is classified as a SBc type barred galaxy and it is considered as an isolated galaxy at a distance of Mpc ( km s-1 Mpc-1), located behind the Leo Spur group of galaxies. This galaxy has a remote neighbor, NGC 3419, at a distance of kpc (García-Barreto & Rosado, 2001). At a radius of kpc from the nucleus there is an optical structure consisting of several H knots that resembles a bow-shock (García-Barreto et al., 1996a, b). García-Barreto et al. (1998) report Very Large Array (VLA) observations with an angular resolution of at GHz and find radio continuum emission from two lobes that extend up to 6 kpc outside the plane of the disk, and a weaker emission from the same disk. Gioia et al. (1990) also reported soft X-ray emission from this galaxy.
3.1 Ionized hydrogen kinematics data analysis
We use the ionized hydrogen data cube from Fabry-Perot interferometry observations published in García-Barreto & Rosado (2001). The data cube has dimensions , a final image scale of pixel-1, and spectral sampling of 19 km s-1. García-Barreto & Rosado (2001) used an interference filter with a central wavelength of Å, and a narrow band (Å) in order to isolate the redshifted H emission of this galaxy. The authors made the calibration with a neon lamp centered at Å. The exposition time for each channel was of s. No attempt was made by the authors for absolute calibration of the H emission.
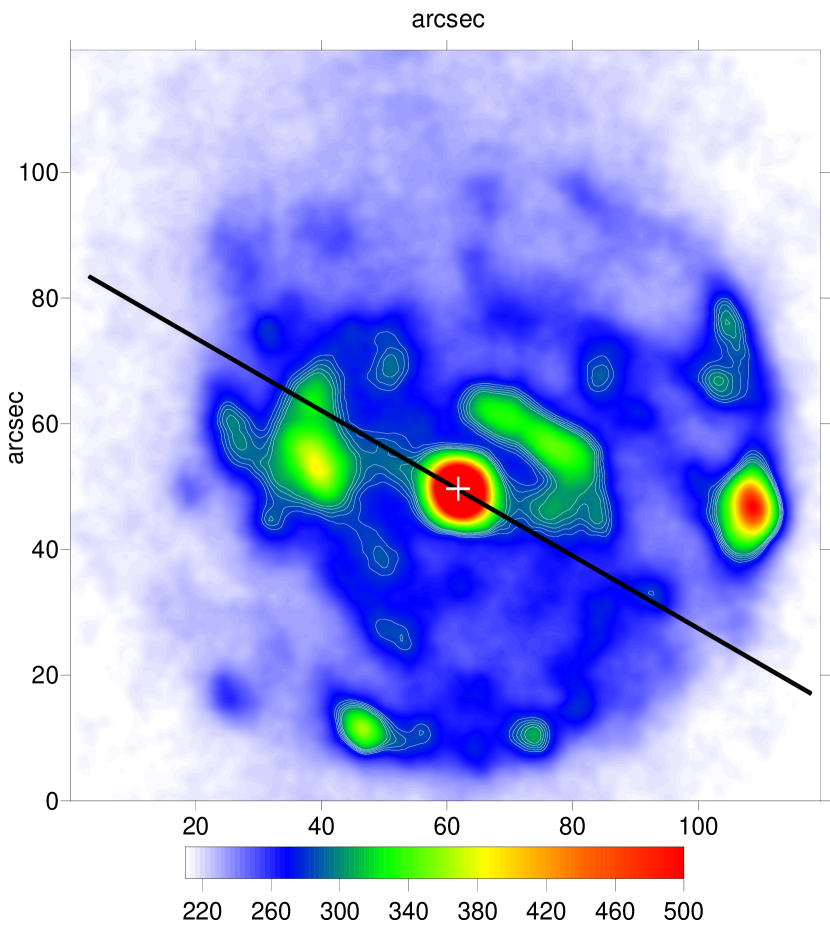
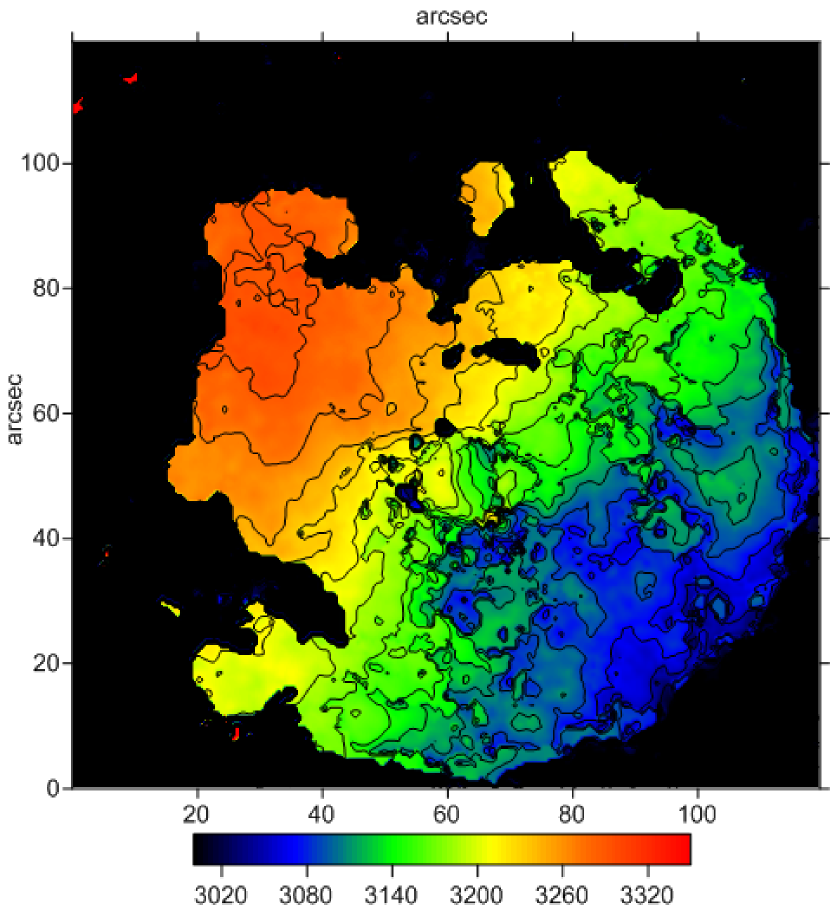
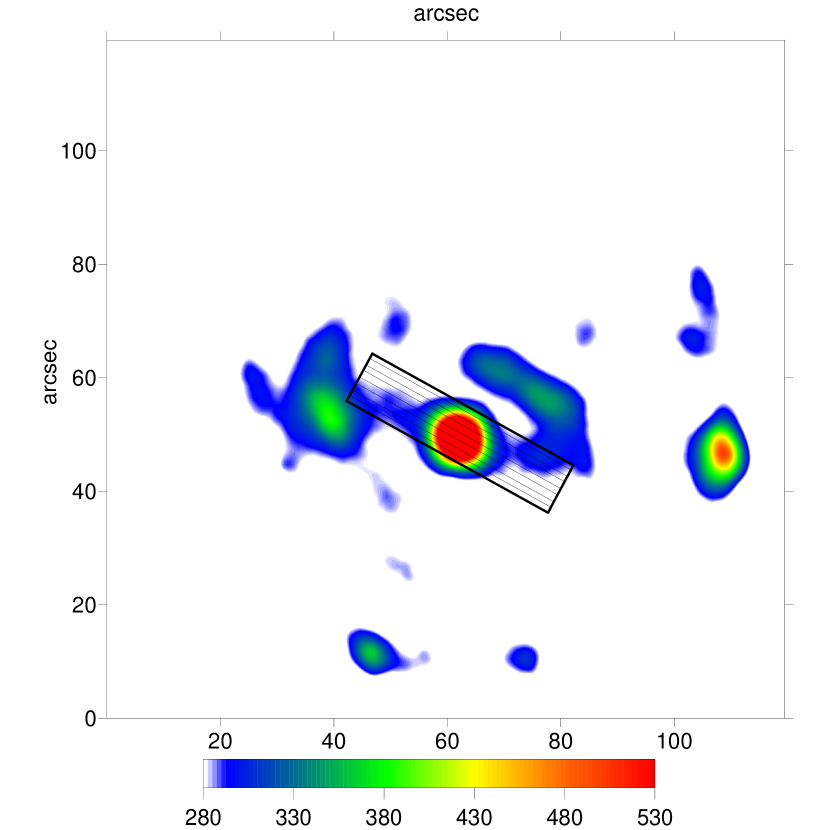
The data were already reduced with the ADHOCw111http://www.oamp.fr/adhoc/adhocw.html developed by J. Boulesteix. software, and we use it to obtain the intensity H monochromatic map, the radial velocity field, and the continuum map. The H image we use for our further analysis was obtained by sum of channels, without substraction of the continuum. The velocity field was obtained by finding the barycenter of the H profile peaks for each pixel. The photometric center was determined from the continuum map by looking for the brightest pixel, which in this case coincides with the kinematic center (Fuentes-Carrera et al., 2004, 2007). We trimmed these maps to to exclude external sources and employ a spectral and spatial smoothing with a Lorentzian function with a FWHM of pixels ( compared with the seeing ), more adapted to the instrumental function of a Fabry-Perot. The final H image and the radial velocity field are shown in (Fig. 9).
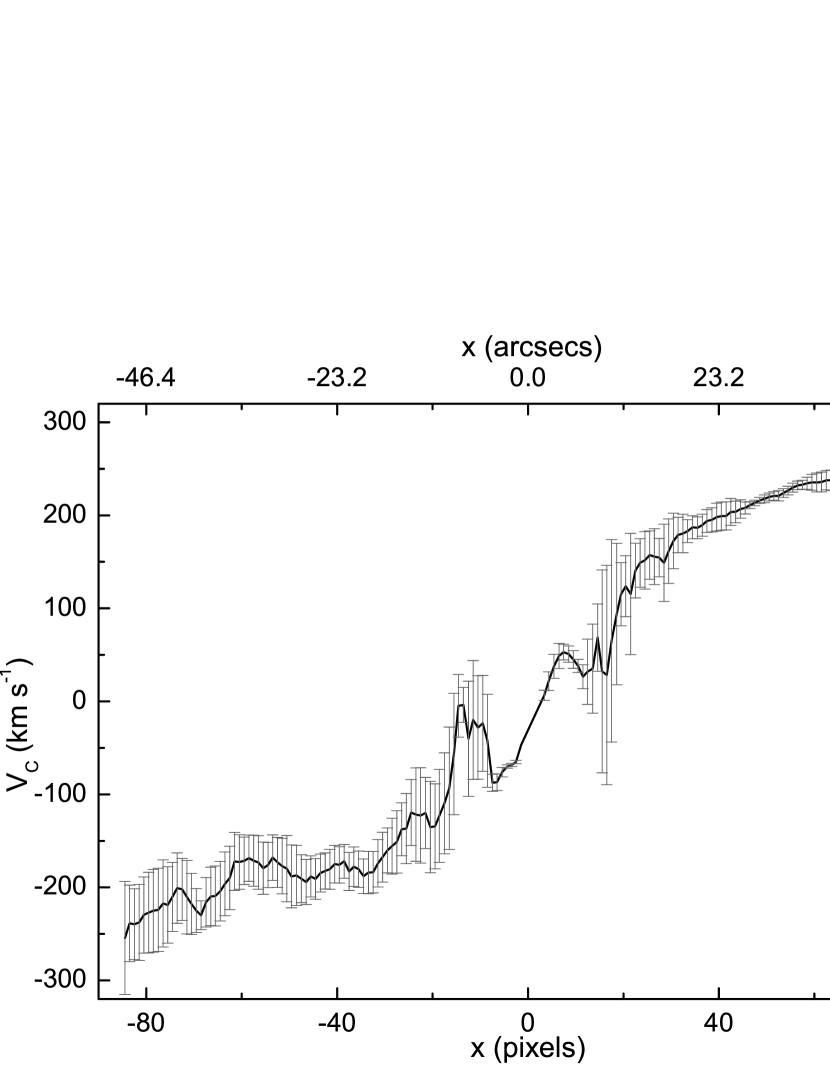
We use the two dimensional radial velocity field to obtain a rotation curve for NGC 3367. García-Barreto & Rosado (2001) already obtained a rotation curve for this galaxy using the AIPS package. For this work we wish to explore the variation of the parameters of the rotation curve in order to optimize them because they are of fundamental importance for determining the bar pattern velocity. For this purpose we use the ADHOCw software. These parameters are: inclination , position angle PA of the major kinematic axis, systemic velocity and kinematic center. We obtain values similar to those published in García-Barreto & Rosado (2001) with the difference that our systemic velocity and position angle are slightly higher: km s-1 instead of km s-1, instead of . Our kinematic center is located at R.A. and Dec. (J), which are the same values reported by García-Barreto & Rosado (2001). The inclination with respect to the plane of the sky is as in García-Barreto & Rosado (2001). As reported by García-Barreto et al. (2007) the stellar bar length is ( kpc) and is oriented from the kinematic major axis.
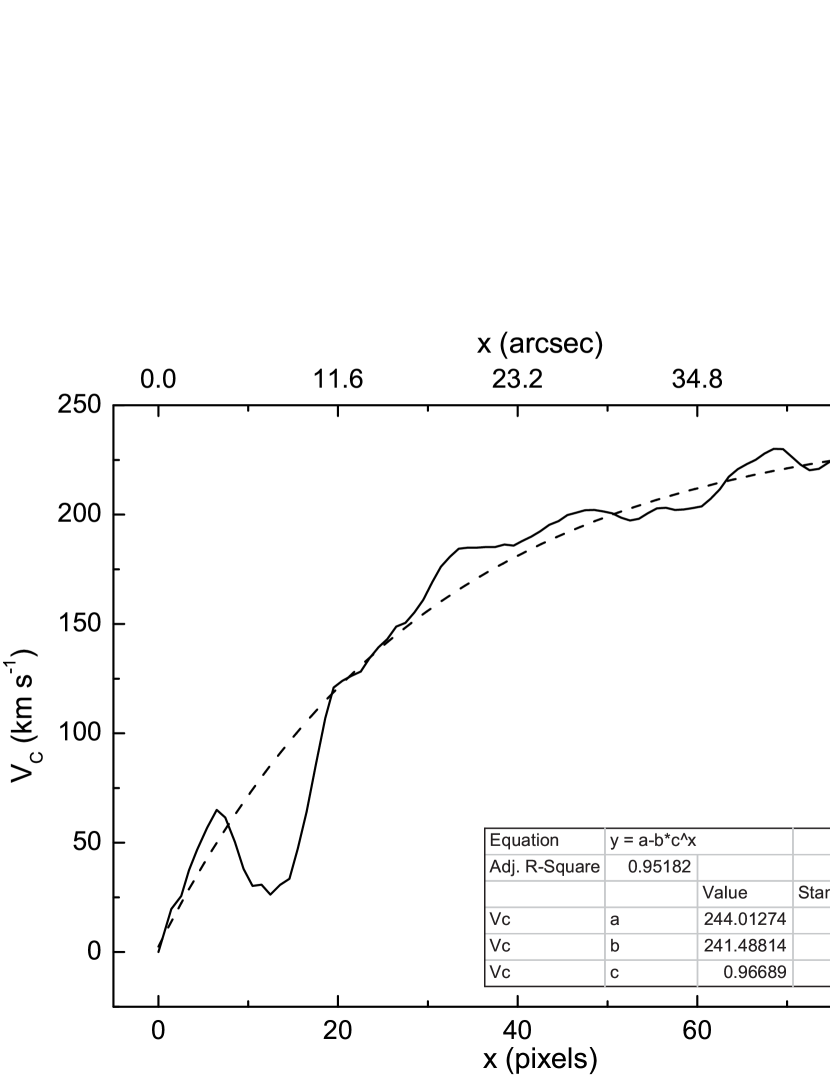
The rotation curve was determined by averaging velocities in two sectors along the kinematic line of nodes. Once obtaining the full rotation curve of NGC 3367, we average the rotation curve over both sectors. We fit the mean rotation curve using a weighted asymptotic regression model. The rotation curve of NGC 3367, the averaged rotation curve and the fit are shown in Fig. 10.
4 Application of the TW method to NGC 3367
We apply the Tremaine-Weinberg method to NGC 3367 in order to measure the bar pattern speed. We built an IDL program that calculates the intensity-weighted velocity and the intensity-weighted position for each strip along the kinematic minor axis of the galaxy. Here the H intensity serves as a weighting function under the assumption that the surface density of the disk is proportional to the H intensity ().
The TW method involves many parameters among which we consider the position angle of the kinematic major axis (PA), the minimum and maximum of the surface brightness image, position of the kinematic center in pixels, systemic velocity, inclination, the range of integration along the major axis and the location and number of apertures along which we calculate the quantities and . In order to explore the errors in the determination associated with the uncertainties in the parameters we vary each of them to build a range of values. We assume that within each determined interval there is a subset of values where is trustworthy if the plots of the weighted mean velocity and position show little scatter such that the slope in the vs. plot is well fitted and passes though the origin. On the other hand, in our case the curves of intensity-weighted velocity and position should start from negative values and move smoothly towards positive ones. By varying the full set of parameters we found that four of them are actually relevant. These are the PA, the minimum of the Hα image, the length of the slit along the kinematical major axis and the range of variation along the minor axis of the galaxy. The errors in , and kinematic center have smaller effect on , as was already noted by Merrifield & Kuijken (1995).
Thus, we begin with the variation of PA. We establish the origin of the Cartesian coordinate system on the photometric center of the Hα image of NGC 3367, such that the axis is aligned with the disk kinematic major axis. First, we vary the PA within the range of errors determined from the ADHOCw package () in both north-east direction (positive) and in the south-east direction (negative). From Fig. 11 it can be noted that a variation of PA by leads to errors in of km s-1. We extend this range up to in order to compare it with the behavior of observed in the simulation. The result presented in Fig. 11 shows that for PA the curve is almost linear and roughly similar to the Fig. 2. As the bar becomes aligned with the kinematic major axis (PA), the approaches zero faster. A similar conduct is found for the simulated bar oriented in the same way as the observed one ( from the major axis).

In order to select only those emission regions near the bar, we mask the Hα image by changing the minimum of the image. Clipping to a given minimum Hα intensity is necessary because if the entire image is taken the plot of vs. is too noisy and it is difficult to establish a clear fit. As shown in the previous section a sufficiently noisy background could strongly affect the results. The masking procedure helps to hide bright knots within the interarm regions and allows to achieve higher signal to noise ratio. Additionally, as demonstrated by Rand & Wallin (2004), intensity clipping helps to improve the results by removing the scatter produced by clumps, but at the same time it could also remove part of the bar pattern. Fig. 12 shows the variation of with the minimum of the Hα image. The range of varied intensity corresponds to emission that roughly traces disk, spiral arms, and the bar region, except the bright bulge. When compared with the Fig. 8 a similar behavior of the pattern speed due to clipping can be observed. Within the bar region (excluding disk and arms) the errors due to clipping are . The small variation of within the clipping range is probably due to the clumpiness of the Hα image around the bar. We also examined the clipping of the maximum intensity and found that it did not significantly alter the results.

Strong emission along the spiral arms represent a great source of noise in bar pattern speed determination that one needs to isolate in order to correctly perform the weighting procedure. The emission intensity of spiral arms is much stronger than that of the bar, and and will be biased by the arms. For this reason we resort to constraining the integration area uniquely to the bar zone. We restrict the range of integration along the kinematical major axis to avoid the region of the eastern arm. This is an extended and prominent zone that biases significantly the signal to noise ratio of the intensity near the north-east side of the bar (Fig. 9). Since we are interested in the bar pattern speed, avoiding spiral arms that may have a pattern speed distinct from that of the bar would also improve the signal. The fourth important parameter is the range along the minor axis of the galaxy, i.e., the number of apertures. If this range is not limited, the bright spiral arms of the galaxy, in particular the one located at north-west, enter in the computation and the bar pattern speed cannot be determined.
After analyzing the parameter variation we determine the bar pattern speed of NGC 3367. The parameters mentioned above were constrained in the following sequence: limiting the integration area, limiting the intensity, and varying the PA. The final masked Hα image and the region where the was determined is shown in Fig. 13. The averaging of quantities in equation (1) is done along strips of one pixel width, totalling slits parallel to the kinematic major axis within the box.
We find for NGC 3367 a value of km s-1 kpc-1. This value is consistent with the value reported in García-Barreto & Rosado (2001).


In Fig. 14 we show the mean weighted position and the mean weighted velocity as a function of the position along the minor axis of the galaxy. Both curves show an almost linear trend, except that shows flattening after pixels ( kpc). This is probably due to a characteristic shape of the bar, both parts of which are not symmetric and which appears to be “broken”. This asymmetry is also observed in broadband ultraviolet images (García-Barreto et al., 2007). In Fig. 15 we show the mean weighted velocity as a function of the mean weighted position and the mean intensity as a function of the position along the minor axis. The mean intensity has a bell shape similar to what is observed for a simulated bar. The sequencing of points also checks that we really measure the bar pattern speed. It is worth noting that if a linear fit is applied to the plots in Fig. 14 and then the slope is estimated, the pattern speed is km s-1 kpc-1.
4.1 Determination of by resonances analysis.
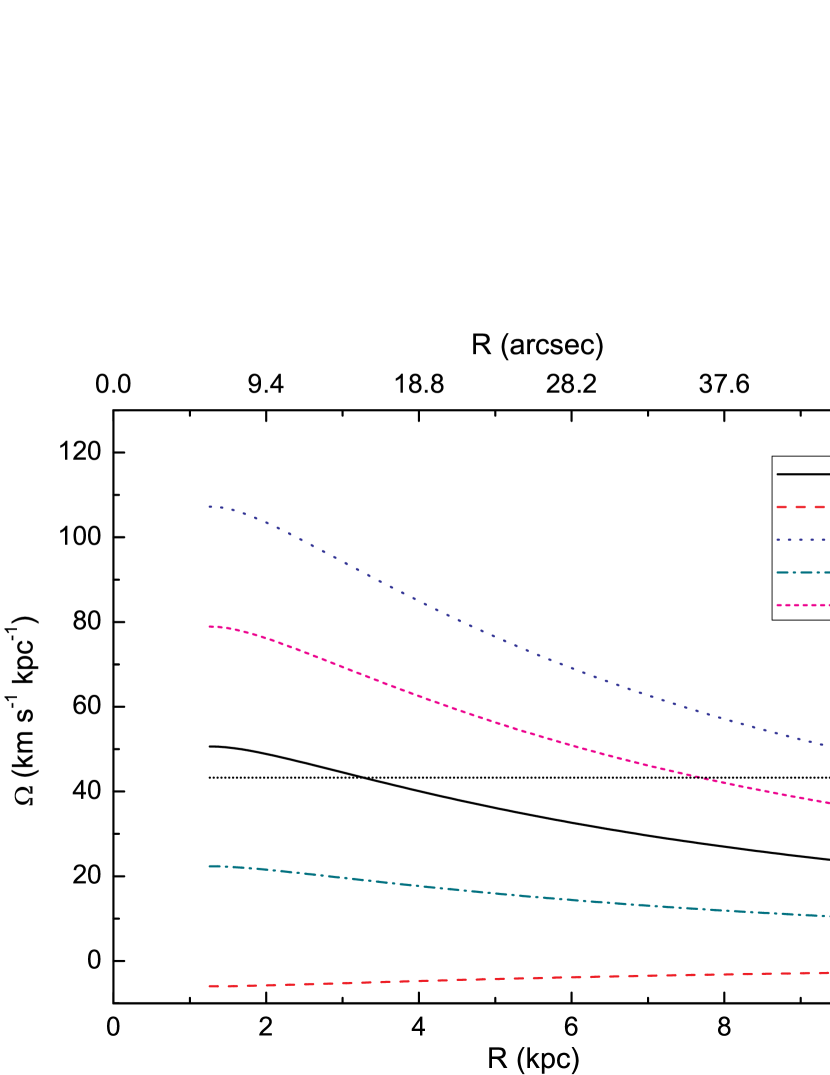
We compared obtained from the TW method with the one obtained from analyzing fundamental resonances of NGC 3367 predicted by the linear theory. According to the linear theory at the resonance radii there are expected rings of matter with enhanced star formation caused by gas shocks. In particular, NGC 3367 has a ring of radius kpc formed by spiral arms wrapped by more than . Using the diameter of the stellar bar kpc given by García-Barreto et al. (2007) and assumption that the bar ends near the corotation, we find that km s-1 kpc-1. Here, the errors in are due to the rotation curve determination and fitting procedure. This value agrees within the error limits with the value we found by the TW method and also accords with the value reported in García-Barreto & Rosado (2001) of km s-1 kpc-1. In Fig. 16 are shown the resonances for NGC 3367 and the bar pattern speed determined by the TW method. The resonances were obtained from the fit to the rotation curve (Fig. 10) given in this work. According to the figure the outer 4:1 resonance is located at kpc (), the OLR is at some kpc (), and there is no ILR. However, it should be noted that the resulting derived in this way should be taken with caution because the ring is not necessarily located at corotation. On the other hand, given the complex structure of the rotation curve in the center and limited resolution, it is difficult to judge whether an ILR is absent or present.
5 Discussion
The main aim of this work is to estimate the bar pattern speed of NGC 3367 galaxy using H kinematic data. For this purpose we first investigate the sensitivity of results to the data quality on numerical galaxy models. We have not intended to create an exact numerical model of NGC 3367, but rather to use the simulations as toy models. For this reason we cannot directly compare the lengths and pattern speeds of simulated and observed bars. We have tested the TW method for a simulated galaxy bar against contamination of surface density and velocity fields by white noise and Gaussian random field perturbations in our simulated data. We found that the surface density is critical to noise and the bar area should have a good signal to noise ratio in order to obtain reliable results, because it is used as a weighting function in equation (1). In contrast, the velocity field appears to be less sensitive to errors, although they also affect the accuracy of the results. This is due to the zero net velocity perturbation introduced in calculus of where the errors are partially cancelled out. However, for gas-poor, old stellar bars, where the buckling is significant, component of the velocity field may be important. We also checked the influence of the position angle on the resulting . In agreement with Debattista (2003) the results are sensitive to PA uncertainties. When the disk major axis and the bar become aligned, the errors in increase faster than in the opposite case.
Based on the results of the robustness test, we apply the TW method to NGC 3367 using published 2D data of Fabry-Perot interferometry. After carefully studying the parameters that could affect the results (minimum intensity, range of integration, number of strips, high intensity knots and arms, position of kinematic major axis), we found km s-1 kpc-1. We also determine the bar pattern speed by means of resonances analysis and found km s-1 kpc-1. These two results are consistent and in agreement with the value reported previously by García-Barreto & Rosado (2001). The trend in variation of with the position angle of the kinematical major axis is consistent with the result encountered in the simulated barred galaxy.
As shown in Sect. 2 the variation of the minimum of the surface density for the simulated barred galaxy could significantly affect determination. As we have demonstrated, for NGC 3367 the adopted minimum of intensity in Hα image is one of the fundamental parameters. Applying a clipping allows us to increase the contrast of emission in the interarm region, thus improving the signal associated with the bar. But, on the other hand, if the trend found for the simulated bar applies for H gaseous bar, the clipping we used for NGC 3367 could lead to an overestimation of the by more than and the bar would lie within a flat region of the curves shown in Fig. 8. Thus, if the clipping is not applied, our value of indeed can be as small as km s-1. Yet, a deeper study using galaxy models with complex gas physics is required to verify whether the pattern speed is underestimated due to clipping. The other two parameters we investigated essentially restrain the range of integration parallel and perpendicular to the kinematic major axis. These are underlying parameters that allow us to significantly improve the signal to noise ratio near the bar zone.
When observing the radial velocity field (Fig. 9), an interesting feature can be noted in the nuclear region. The isovelocity contours in the center of the galaxy that are almost perpendicular to the main ones may imply non-circular motions. Since the sharp turn in isophotes is frequently associated with a secondary bar, the possibility of non-circular motions due to different origins is present. In particular, the inner gas polar ring or disk, or a secondary bar may be responsible for the characteristic shape of the isovelocity contours. Such behavior has been observed previously in several galaxies, see for example Moiseev et al. (2004). However, due to lack of resolution, in this work we were unable to characterize and identify any secondary pattern speed. A study with a better angular resolution and a comparison with the stellar counterpart is necessary in order to analyze the detailed kinematical features in the center of this galaxy.
6 Conclusions
In this work we apply the TW method to a simulated barred galaxy and test the sensitivity of the method to possible sources of error. Then we measure the bar pattern speed of NGC 3367 using the same method. The results obtained from the application of this method to a simulated galaxy in general hold also for the observed one. However, the simulations have shown that a significant error can emerge due to applying the clipping to the surface density. These facts motivated us to assert some important conclusions within the limits of our work. First of all, bearing in mind the principal assumptions of the TW method, we can say that it works well enough for the gas phase whenever it is continuously distributed along the bar. On the other hand, the validity of applying clipping to the intensity map should be further investigated. We also want to note the importance of two dimensional data that allow the exploration of a wider range in parameters variation. Given the errors of the position angle determination the variation of PA do not affect too much the resulting pattern speed for NGC 3367. Finally, determining the bar pattern speed by locating the corotation resonance, we found that the result is similar to that obtained by application of the TW method. This fact supports in part the reliability of the method in the case of ionized gas data. A deeper study of this galaxy would be worth, in particular, the comparison with the pattern speed determined from the stellar long-slit spectral observations, which would verify the validity of the TW method for H kinematic data.
References
- Aguerri et al. (2003) Aguerri, J. A. L., Debattista, V. P., & Corsini, E. M. 2003, MNRAS, 338, 465
- Athanassoula (2003) Athanassoula, E. 2003, MNRAS, 341, 1179
- Beckman et al. (2007) Beckman, J. E., Fathi, K., Piñol, N., Toonen, S., Hernandez, O., & Carignan, C. 2007, ArXiv e-prints, 07120518
- Canzian (1993) Canzian, B. 1993, ApJ, 414, 487
- Contopoulos (1980) Contopoulos, G. 1980, A&A, 81, 198
- Debattista (2003) Debattista, V. P. 2003, MNRAS, 342, 1194
- Debattista et al. (2002) Debattista, V. P., Corsini, E. M., & Aguerri, J. A. L. 2002, MNRAS, 332, 65
- Debattista & Williams (2001) Debattista, V. P. & Williams, T. B. 2001, in Astronomical Society of the Pacific Conference Series, Vol. 230, Galaxy Disks and Disk Galaxies, ed. J. G. Funes & E. M. Corsini, 553–554
- Elmegreen et al. (1996) Elmegreen, B. G., Elmegreen, D. M., Chromey, F. R., Hasselbacher, D. A., & Bissell, B. A. 1996, AJ, 111, 2233
- Elmegreen et al. (1992) Elmegreen, B. G., Elmegreen, D. M., & Montenegro, L. 1992, ApJS, 79, 37
- Emsellem et al. (2006) Emsellem, E., Fathi, K., Wozniak, H., Ferruit, P., Mundell, C. G., & Schinnerer, E. 2006, MNRAS, 365, 367
- Fathi et al. (2007) Fathi, K., Toonen, S., Falcón-Barroso, J., Beckman, J. E., Hernandez, O., Daigle, O., Carignan, C., & de Zeeuw, T. 2007, ApJ, 667, L137
- Fuentes-Carrera et al. (2004) Fuentes-Carrera, I., Rosado, M., Amram, P., Dultzin-Hacyan, D., Cruz-González, I., Salo, H., Laurikainen, E., Bernal, A., Ambrocio-Cruz, P., & Le Coarer, E. 2004, A&A, 415, 451
- Fuentes-Carrera et al. (2007) Fuentes-Carrera, I., Rosado, M., Amram, P., Salo, H., & Laurikainen, E. 2007, A&A, 466, 847
- Gabbasov et al. (2006) Gabbasov, R. F., Rodríguez-Meza, M. A., Klapp, J., & Cervantes-Cota, J. L. 2006, A&A, 449, 1043
- García-Barreto et al. (1996a) García-Barreto, J. A., Franco, J., & Carrillo, R. 1996a, ApJ, 469, 138
- García-Barreto et al. (1996b) García-Barreto, J. A., Franco, J., Carrillo, R., Venegas, S., & Escalante-Ramírez, B. 1996b, Rev. Mexicana Astron. Astrofis., 32, 89
- García-Barreto et al. (2007) García-Barreto, J. A., Hernández-Toledo, H., Moreno-Díaz, E., Bernal-Marín, T., & Villarreal-Castillo, A. L. 2007, AJ, 134, 142
- García-Barreto & Rosado (2001) García-Barreto, J. A. & Rosado, M. 2001, AJ, 121, 2540
- García-Barreto et al. (1998) García-Barreto, J. A., Rudnick, L., Franco, J., & Martos, M. 1998, AJ, 116, 111
- Gerssen et al. (1999) Gerssen, J., Kuijken, K., & Merrifield, M. R. 1999, MNRAS, 306, 926
- Gioia et al. (1990) Gioia, I. M., Maccacaro, T., Schild, R. E., Wolter, A., Stocke, J. T., Morris, S. L., & Henry, J. P. 1990, ApJS, 72, 567
- Hernandez et al. (2004) Hernandez, O., Carignan, C., & Amram, P. 2004, in Astrophysics and Space Science Library, Vol. 319, Penetrating Bars Through Masks of Cosmic Dust, ed. D. L. Block, I. Puerari, K. C. Freeman, R. Groess, & E. K. Block, 781
- Hernandez et al. (2005) Hernandez, O., Wozniak, H., Carignan, C., Amram, P., Chemin, L., & Daigle, O. 2005, ApJ, 632, 253
- Hernquist (1990) Hernquist, L. 1990, ApJ, 356, 359
- Hernquist (1993) —. 1993, ApJS, 86, 389
- Kent (1987) Kent, S. M. 1987, AJ, 93, 1062
- Kozintsev & Kedem (2000) Kozintsev, B. & Kedem, B. 2000, Journal of Computational and Graphical Statistics, 9, 286
- Merrifield & Kuijken (1995) Merrifield, M. R. & Kuijken, K. 1995, MNRAS, 274, 933
- Moiseev et al. (2004) Moiseev, A. V., Valdés, J. R., & Chavushyan, V. H. 2004, A&A, 421, 433
- Noguchi (1987) Noguchi, M. 1987, MNRAS, 228, 635
- Rand & Wallin (2004) Rand, R. J. & Wallin, J. F. 2004, ApJ, 614, 142
- Rautiainen et al. (2005) Rautiainen, P., Salo, H., & Laurikainen, E. 2005, ApJ, 631, L129
- Tremaine & Weinberg (1984) Tremaine, S. & Weinberg, M. D. 1984, ApJ, 282, L5
- Tully (1974) Tully, R. B. 1974, ApJS, 27, 449
- Westpfahl (1998) Westpfahl, D. J. 1998, ApJS, 115, 203
- Zimmer et al. (2004) Zimmer, P., Rand, R. J., & McGraw, J. T. 2004, ApJ, 607, 285