Low-mass members of the young cluster IC 4665 and pre-main-sequence lithium depletion
Abstract
We have used fibre spectroscopy to establish cluster membership and examine pre-main-sequence (PMS) lithium depletion for low-mass stars (spectral types F to M) in the sparse young ( Myr) cluster IC 4665. We present a filtered candidate list of 40 stars that should contain 75 per cent of single cluster members with in the central square degree of the cluster. Whilst F- and G-type stars in IC 4665 have depleted little or no lithium, the K- and early M-type stars have depleted more Li than expected when compared with similar stars in other clusters of known age. An empirical age estimate based on Li-depletion among the late-type stars of IC 4665 would suggest it is older than 100 Myr. This disagrees entirely with ages determined either from the nuclear turn-off, from isochronal matches to low-mass stars or from the re-appearance of lithium previously found in much lower mass stars (the “lithium depletion boundary”). We suggest that other parameters besides age, perhaps composition or rotation, are very influential in determining the degree of PMS Li-depletion in stars with . Further work is required to identify and assess the effects of these additional parameters, particularly to probe conditions at the interface between the sub-photospheric convection zone and developing radiative core. Until then, PMS Li depletion in F- to early M-type stars cannot be confidently used as a precise age indicator in young clusters, kinematic groups or individual field stars.
keywords:
stars: stars: pre-main-sequence – open clusters and associations: individual: IC 4665.1 Introduction
The lithium depletion boundary (LDB) technique determines ages for young clusters of stars by establishing the luminosity at which Li remains unburned in the atmospheres of fully-convective, very low-mass stars. In principle, LDB ages are both precise and accurate; observational and theoretical uncertainties contribute to errors of no more than about 10 per cent in the age estimate for clusters in the range 10–200 Myr (Jeffries & Naylor 2001; Burke et al. 2004) – considerably better than other age estimation methods.
LDB ages have now been estimated for several clusters (Stauffer et al. 1998; Barrado y Navascués, Stauffer & Jayawardhana 2004; Jeffries & Oliveira 2005), but the technique has limited applicability because it entails quantifying the Li i 6708Å feature at a resolving power in groups of faint, very low-mass objects. However, the few LDB ages that are known could be used to calibrate other age estimation methods that are feasible in more distant populations and isolated field stars, but which rely on more uncertain stellar physics.
A prime example is the age-dependent degree of Li depletion seen in more massive (and many magnitudes brighter) F–K stars. Li is burned in pre-main-sequence (PMS) stars as their contracting cores reach temperatures K. In fully-convective stars this leads to rapid and almost total Li destruction on less than a Kelvin-Helmholtz timescale. However, in the standard picture, PMS stars with form radiative cores that push outwards, so that the base of the convection zone dips below the Li ignition temperature, bringing an abrupt halt to surface Li depletion (e.g. Piau & Turck-Chìeze 2002). The exact details and in particular, isochrones of Li depletion versus mass or effective temperature, are extremely sensitive to conditions at the base of the convection zone and any additional mixing into the radiative core. As a result, whilst Li depletion among F–K PMS stars has a long history of use as an empirical age indicator among young clusters, kinematic groups and even individual stars (e.g. Duncan & Jones 1983; Stauffer, Hartmann & Barrado y Navascués 1995; Favata et al. 1998; Song et al. 2000), the absolute ages determined in this way have large theoretical uncertainties.
In this paper we discuss results from a programme to calibrate Li depletion ages among F–K stars by observing such stars in clusters with known LDB ages. We present photometry and spectroscopy of F–K (and M) stars in IC 4665, an open cluster with a distance of pc, a reddening mag (Hogg & Kron 1955; Crawford & Barnes 1972 – corresponding to and , for the intrinsic colours of a low-mass PMS star [Bessell et al. 1998]) and an unambiguous detection of the LDB which yields an age of Myr (Manzi et al. 2008, hereafter M08), where the modest age uncertainty is dominated by the distance uncertainty.
2 Observations and Analysis
Spectroscopic observations of candidate low-mass stars in IC 4665, with and , were conducted on the nights beginning 8 June 2008 and 9 June 2008, using the AF2/WYFFOS multi-fibre spectrograph at a Nasmyth focus of the 4.2-m William Herschel Telescope (WHT). An echelle grating and an order-sorting filter were used to give a spectral coverage of about 420Å centred at 6600Å and a resolving power of 11 000.
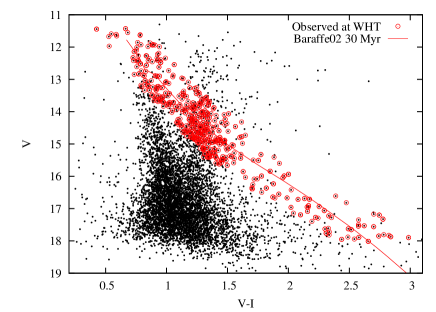
Targets were selected from a square degree photometric survey centred at RA, Dec= (J2000), performed on 15–17 September 2005 using the 1.0-m telescope at the Cerro Tololo Interamerican Observatory. The details of this survey will appear elsewhere (Cargile et al. in prep.), but in brief consisted of nine arcmin2 fields observed for 100, 50 and 25 seconds through filters. The observations were reduced with daophot (Stetson 1987) and placed onto the Johnson-Cousins system using standards from Landolt (1992). The colour-magnitude diagram (CMD) for the survey is shown in Fig. 1, along with targets observed at the WHT. Targets were selected from this diagram assuming the LDB age of 28 Myr, but the criteria were broad enough to encompass all likely cluster members and all previously identified low-mass members in this magnitude range (e.g. Prosser & Giampapa 1994 – hereafter PG94; Martín & Montes 1997 – hereafter MM97). A total of 452 targets were observed in 8 fibre configurations, amounting to 87 per cent of possible candidates with . Four “bright” configurations were observed for s and 4 “faint” configurations were observed for s (one had only two good exposures). The spectra had signal-to-noise ratios (SNR) ranging from 4–110 per 0.22Å pixel. 124 targets were observed twice, 37 targets were observed three times and 6 targets were observed in four configurations.
Spectra were extracted from the CCD images using purpose built software (written by RJJ) which used an optimal extraction procedure to maximize the signal to noise ratio. Science images were corrected for bias by subtracting a median of multiple bias frames and correcting for any time-dependent offset using overscan regions. Bad pixels were flagged using a mask generated from dark frames. Tungsten lamp images recorded before each science run were used to trace the path of the spectrum on the CCD image. The median of these images was used to define flat-field spectra for the optimal extraction process. Copper-neon lamp spectra, recorded before and after science exposures, provided the wavelength calibration.
The method used for optimal extraction is described by Horne (1986). This applies non-uniform weight to pixels in the extracted sum, minimizing statistical noise whist preserving photometric accuracy. In our case the weighting profiles for individual spectra were derived from a boxcar average along the wavelength axis of the flat-field images. A similar boxcar averaging process using data from regions between the spectra was used to model and subtract any scattered light in each exposure. With this procedure the extracted science spectra were normalized to the flat-field spectra, compensating for variations in gain between pixels. To reduce the effect of cosmic rays the measured signal profile was compared with the product of the extracted spectrum and the weighting profile. Pixels showing greater than 5-sigma difference were masked and the extraction process repeated. Profiles with more than 50 per cent of the pixels masked were masked in the final extracted spectrum.
Arc spectra, extracted using the same procedure, were used to identify the position of seven well separated arc lines and a cubic polynomial fit was used to define the calibration of individual spectra. Extracted spectra and their variances were interpolated across masked points and recast onto a common wavelength base comprising 10 000 logarithmically spaced steps between 6350Å, and 6740Å. A median sky spectrum, determined from ten or more fibers pointed at sky positions in each configurations was subtracted from the target spectra within that configuration. Spectra of the “blank” night sky were taken to measure the relative efficiency of individual fibers in each configuration. The results of repeated exposures were averaged to produce the median spectrum of each target from each configuration.
Spectra of late-type stars with known radial velocities (RVs) (from Nidever et al 2002) were taken on each night. Heliocentric RVs were measured by cross-correlation using the iraf fxcor task and HD 171067 (spectral type G8V) as the principal template. The cross-correlation used the wavelength regions 6380–6550Å and 6580–6725Å. Projected equatorial velocities () were estimated from the width of the cross-correlation function. Translation from the cross-correlation function width to a was calibrated by artificially broadening standard star spectra. Variation in the intrinsic resolution of different fibres was accounted for using the cross-correlation function between HD 171067 and the twilight sky spectrum recorded through each fibre. At this resolution the data were capable of resolving rotational broadening corresponding to km s-1. fxcor provides error estimates for the RVs, which concurred with estimates from targets observed in multiple configurations. The average RV uncertainty was 0.8 km s-1, but varied from 0.3 km s-1 to as large as 8 km s-1 in the most rapid rotators. RVs were obtained for 449/452 targets, the remaining 3 targets had low SNR and no discernible cross-correlation peak. errors were estimated by numerical simulation and were of order 10 per cent, where rotational broadening was resolved.
The equivalent widths of the Li i 6707.8Å feature (EW[Li]) were measured with respect to a pseudo-continuum, using a Gaussian fit to the line itself where present. Uncertainties were estimated using the empirical SNR of the continuum fit and the formula , where is the pixel size and the FWHM of the line in wavelength units (Cayrel 1988). Where no significant line was seen we estimated very conservative 3-sigma upper limits using this formula and an assumed (including any rotational broadening). At our resolution, the measured EW[Li] includes a blended contribution from a weak ( to 20 mÅ) Fe i line at 6707.44Å.
A summary of the results is included as Table 1 (available fully in electronic form only). This identifies each target, gives its J2000 celestial coordinates (taken from the 2MASS catalogue – Cutri et al. 2003), its and magnitudes, the heliocentric RV measurements, a weighted mean RV, a RV variability flag, a flag identifying objects that are candidate SB2 binary systems based on the appearance of the cross-correlation functions, the (or upper limit), a SNR for the (summed) spectrum and a EW[Li] (or upper limit) found from the (summed) spectrum of the object. Table 1 also lists alternative star designations from Prosser (1993) and M08. Figure 2 shows a sample of our spectra around the H and Li i 6708Å features.


| (1) | (2) | (3) | (4) | (5) | (6) | (7) | (8) | (9) | (10) | (11) | (12) | (13) | (14) | (15) |
|---|---|---|---|---|---|---|---|---|---|---|---|---|---|---|
| Identifier | RA | Dec | Measurement 1 | Measurement 2 | Measurement 3 | |||||||||
| (J2000) | HJD | RV | RV | HJD | RV | RV | HJD | RV | RV | |||||
| (km/s) | (km/s) | (km/s) | ||||||||||||
| JCO1_025 | 266.89118 | 6.16281 | 15.303 | 1.313 | 1 | 27.557 | 39.8 | 0.5 | ||||||
| JCO1_237 | 266.88043 | 6.03657 | 14.337 | 1.299 | 2 | 26.469 | 12.0 | 0.7 | 27.424 | 10.7 | 0.6 | |||
| JCO3_265 | 266.39267 | 5.97103 | 14.800 | 1.438 | 4 | 26.535 | -47.1 | 0.5 | 27.478 | -47.2 | 0.8 | 27.557 | -46.7 | 0.5 |
| … | ||||||||||||||
| (1) | (16) | (17) | (18) | (19) | (20) | (21) | (22) | (23) | (24) | (25) | (26) | (27) | (28) | (29) |
|---|---|---|---|---|---|---|---|---|---|---|---|---|---|---|
| Identifier | Measurement 4 | Mean RV | RV | SNR | EW[Li] | EW[Li] | Var | CCF | P93 | M08 | ||||
| HJD | RV | RV | ||||||||||||
| (km/s) | (km/s) | (mÅ) | (km/s) | |||||||||||
| JCO1_025 | 39.8 | 0.5 | 18 | 108 | -9999 | 20.0 | -9999 | 0 | 0 | |||||
| JCO1_237 | 11.3 | 0.4 | 29 | 68 | -9999 | 20.0 | -9999 | 0 | 0 | |||||
| JCO3_265 | 27.628 | -46.3 | 0.7 | -46.8 | 0.3 | 46 | 42 | -9999 | 20.0 | -9999 | 0 | 0 | ||
| … | ||||||||||||||
3 Cluster Membership
| (1) | (2) | (3) | (4) | (5) | (6) | (7) | (8) | (9) | (10) | (11) | (12) | |||||
|---|---|---|---|---|---|---|---|---|---|---|---|---|---|---|---|---|
| Identifier | EW[Li] | RV | EW[H] | EW[Ca i] (Å) | PM(RA) | PM(Dec) | Member | |||||||||
| (mÅ) | (km s-1) | (km s-1) | (Å) | 6439 | 6463 | (milli-arcsec year-1) | ||||||||||
| JCO1_427 | 13.07 | 1.00 | 218 | 24 | -11.4 | 2.5 | 57.0 | 2.2 | -0.75 | 0.27 | 0.32 | 0.2 | 5.9 | -12.7 | 5.9 | Y |
| JCO1_530 | 12.52 | 0.79 | 79 | 6 | -14.5 | 0.3 | 20.0 | -9999 | -2.33 | 0.18 | 0.24 | -10.4 | 3.0 | -1.5 | 2.8 | Y |
| JCO2_026 | 14.95 | 1.25 | 66 | -9999 | -14.2 | 0.5 | 20.0 | -9999 | -1.11 | 0.21 | 0.33 | 1.4 | 5.9 | 1.2 | 6.1 | N |
| JCO2_145 | 12.27 | 0.77 | 153 | 18 | -13.0 | 1.7 | 42.3 | 2.2 | -2.95 | 0.16 | 0.24 | -5.3 | 2.9 | -11.2 | 2.8 | Y |
| JCO2_213 | 13.22 | 0.93 | 226 | 24 | -14.9 | 0.7 | 20.0 | -9999 | -1.19 | 0.26 | 0.29 | -2.5 | 5.9 | -8.9 | 5.9 | Y |
| JCO2_220 | 16.42 | 2.02 | 144 | -9999 | -14.9 | 1.0 | 21.0 | -9999 | 1.16 | 0.72 | 0.64 | Y | ||||
| JCO2_373 | 12.46 | 0.88 | 176 | 15 | -14.7 | 0.5 | 20.0 | -9999 | -1.13 | 0.24 | 0.27 | -3.2 | 1.5 | -6.3 | 3.5 | Y |
| JCO2_637 | 17.20 | 2.75 | 435 | -9999 | -14.2 | 4.0 | 75.8 | 7.6 | 3.45 | 0.88 | 0.80 | -8.0 | 1.0 | 2.0 | 5.0 | Y |
| JCO2_736 | 17.90 | 2.99 | 264 | -9999 | -11.2 | 3.0 | 20.0 | -9999 | -0.01 | 0.80 | 0.60 | 14.0 | 5.0 | -6.0 | 4.0 | ? |
| JCO3_065 | 15.04 | 1.55 | 91 | 22 | -14.3 | 0.6 | 20.0 | -9999 | 0.32 | 0.55 | 0.53 | 2.0 | 5.9 | -9.5 | 5.9 | Y |
| JCO3_285 | 13.34 | 0.82 | 72 | -9999 | -14.3 | 0.9 | 20.0 | -9999 | -2.12 | 0.17 | 0.18 | -0.8 | 3.0 | -7.7 | 2.9 | Y |
| JCO3_357 | 13.52 | 1.10 | 290 | 27 | -12.6 | 0.7 | 20.0 | -9999 | 0.34 | 0.27 | 0.32 | -2.2 | 5.9 | -3.6 | 5.9 | Y |
| JCO3_395 | 13.72 | 1.06 | 282 | 19 | -12.7 | 0.4 | 20.0 | -9999 | -0.28 | 0.33 | 0.33 | 1.3 | 5.9 | -8.5 | 5.9 | Y |
| JCO3_396 | 13.43 | 0.99 | 209 | 18 | -13.1 | 0.4 | 20.0 | -9999 | -1.27 | 0.28 | 0.29 | 4.0 | 5.9 | -3.7 | 5.9 | Y |
| JCO3_724 | 17.77 | 2.31 | 348 | -9999 | -12.8 | 2.3 | 23.0 | -9999 | -0.23 | 0.64 | 0.63 | 16.0 | 6.0 | 0.0 | 3.0 | ? |
| JCO3_770 | 17.56 | 2.70 | 225 | -9999 | -16.8 | 2.9 | 22.2 | 4.9 | 3.58 | 0.65 | 0.53 | 2.0 | 2.0 | -8.0 | 0.0 | Y |
| JCO4_053 | 13.53 | 1.16 | 226 | 19 | -13.9 | 0.9 | 32.5 | 1.7 | -0.10 | 0.38 | 0.35 | -0.2 | 5.9 | -9.5 | 5.9 | Y |
| JCO4_149 | 14.19 | 1.26 | 66 | -9999 | -13.8 | 0.4 | 20.0 | -9999 | -1.03 | 0.18 | 0.28 | -3.8 | 5.9 | -10.9 | 5.9 | N |
| JCO4_226 | 13.78 | 1.00 | 224 | 19 | -14.7 | 0.7 | 20.0 | -9999 | -0.96 | 0.30 | 0.31 | -4.4 | 5.9 | -6.1 | 5.9 | Y |
| JCO4_295 | 11.45 | 0.43 | 42 | -9999 | -6.4 | 7.6 | 82.5 | 6.1 | -8.20 | 0.12 | 0.11 | -13.0 | 2.5 | 1.6 | 2.4 | N |
| JCO4_337 | 13.91 | 1.38 | 69 | -9999 | -13.9 | 0.5 | 20.0 | -9999 | -0.89 | 0.43 | 0.46 | 8.6 | 5.9 | 3.9 | 5.9 | Y |
| JCO4_437 | 16.72 | 2.08 | 142 | -9999 | -11.5 | 1.0 | 20.0 | -9999 | 0.35 | 0.60 | 0.68 | Y | ||||
| JCO4_459 | 17.89 | 2.58 | 190 | -9999 | -16.7 | 2.4 | 20.0 | -9999 | 3.84 | 0.53 | 0.61 | Y | ||||
| JCO4_558 | 17.33 | 2.78 | 174 | -9999 | -8.7 | 4.5 | 25.0 | -9999 | -0.20 | 0.50 | 0.50 | -26.0 | 4.0 | -34.0 | 2.0 | N |
| JCO4_591 | 16.24 | 1.88 | 69 | -9999 | -12.4 | 0.5 | 20.0 | -9999 | -0.60 | 0.77 | 0.75 | 3.1 | 6.2 | -7.2 | 6.3 | Y |
| JCO5_129 | 13.73 | 1.22 | 49 | -9999 | -13.9 | 0.3 | 20.0 | -9999 | -1.06 | 0.19 | 0.27 | -1.1 | 5.9 | 2.2 | 5.9 | N |
| JCO5_179 | 14.41 | 1.24 | 242 | 49 | -13.8 | 0.8 | 20.0 | -9999 | -0.04 | 0.33 | 0.39 | -0.1 | 5.9 | -3.1 | 5.9 | Y |
| JCO5_280 | 14.24 | 1.09 | 70 | -9999 | -14.4 | 0.3 | 20.0 | -9999 | -0.79 | 0.30 | 0.41 | 0.0 | 5.9 | -6.9 | 5.9 | Y |
| JCO5_282 | 12.15 | 0.73 | 112 | 9 | -13.2 | 1.1 | 34.8 | 1.8 | -1.95 | 0.15 | 0.18 | 1.8 | 1.5 | -7.4 | 1.5 | Y |
| JCO5_296 | 13.94 | 1.08 | 279 | 64 | -18.4 | 3.4 | 72.0 | 2.9 | -0.01 | 0.35 | 0.40 | 8.0 | 5.9 | -5.1 | 5.9 | Y |
| JCO5_329 | 11.43 | 0.66 | 25 | -9999 | -15.6 | 1.1 | 41.9 | 2.0 | -3.84 | 0.17 | 0.15 | 2.8 | 4.3 | -7.2 | 2.7 | ? |
| JCO5_394 | 16.69 | 2.13 | 114 | -9999 | -12.3 | 0.7 | 20.0 | -9999 | -0.31 | 0.79 | 0.74 | ? | ||||
| JCO5_472 | 16.91 | 2.17 | 102 | -9999 | -14.4 | 0.6 | 20.0 | -9999 | 0.74 | 0.71 | 0.65 | Y | ||||
| JCO5_515 | 17.85 | 2.74 | 228 | -9999 | -15.4 | 2.3 | 23.0 | -9999 | 1.93 | 0.60 | 0.63 | Y | ||||
| JCO5_521 | 17.06 | 2.29 | 108 | -9999 | -13.6 | 1.0 | 20.0 | -9999 | 0.66 | 0.70 | 0.62 | Y | ||||
| JCO6_018 | 13.90 | 1.21 | 70 | -9999 | -12.8 | 0.6 | 20.0 | -9999 | -1.04 | 0.24 | 0.29 | -2.9 | 5.9 | -18.5 | 5.9 | N |
| JCO6_059 | 14.48 | 1.27 | 108 | -9999 | -14.9 | 0.5 | 20.0 | -9999 | -1.10 | 0.21 | 0.29 | -2.8 | 5.9 | -6.9 | 5.9 | N |
| JCO6_088 | 13.72 | 1.03 | 223 | 19 | -13.2 | 0.4 | 20.0 | -9999 | -0.50 | 0.29 | 0.31 | 0.0 | 0.0 | 0.0 | 0.0 | Y |
| JCO6_095 | 13.51 | 1.01 | 285 | 46 | -13.7 | 0.9 | 17.9 | 2.9 | -0.43 | 0.28 | 0.42 | 3.2 | 5.9 | -0.9 | 5.9 | Y |
| JCO6_111 | 15.99 | 1.78 | 64 | -9999 | -14.0 | 0.4 | 20.0 | -9999 | 0.59 | 0.68 | 0.63 | 7.0 | 6.0 | -7.8 | 5.9 | Y |
| JCO6_240 | 11.66 | 0.59 | 72 | -9999 | -11.9 | 4.3 | 75.9 | 4.4 | -3.16 | 0.23 | 0.24 | -4.7 | 1.5 | -8.5 | 1.5 | Y |
| JCO7_021 | 13.13 | 1.02 | 241 | 16 | -13.9 | 0.8 | 24.6 | 2.0 | -0.40 | 0.27 | 0.34 | 1.8 | 5.9 | -4.7 | 5.9 | Y |
| JCO7_027 | 14.20 | 1.22 | 267 | -9999 | -11.7 | 1.2 | 20.0 | -9999 | -1.14 | 0.17 | 0.24 | -5.5 | 5.9 | -0.8 | 5.9 | N |
| JCO7_079 | 13.09 | 0.85 | 83 | 24 | -13.5 | 1.1 | 20.0 | -9999 | -1.57 | 0.22 | 0.23 | 2.0 | 2.8 | -2.5 | 2.6 | Y |
| JCO7_088 | 15.41 | 1.88 | 117 | -9999 | -12.9 | 0.9 | 24.0 | 3.5 | 0.69 | 0.81 | 0.73 | -4.0 | 6.4 | -3.2 | 5.9 | Y |
| JCO7_130 | 14.14 | 1.32 | 93 | -9999 | -12.2 | 0.7 | 20.0 | -9999 | -1.16 | 0.22 | 0.35 | -7.0 | 5.9 | 2.2 | 5.9 | N |
| JCO7_670 | 17.35 | 2.58 | 157 | -9999 | -11.1 | 7.3 | 35.2 | 5.2 | 1.02 | 0.64 | 0.66 | Y | ||||
| JCO8_061 | 14.45 | 1.28 | 79 | -9999 | -14.0 | 0.6 | 20.0 | -9999 | -1.10 | 0.23 | 0.26 | 1.4 | 5.9 | -16.8 | 5.9 | N |
| JCO8_257 | 12.92 | 1.05 | 132 | 30 | -13.5 | 1.0 | 28.8 | 2.2 | -1.72 | 0.24 | 0.26 | -5.2 | 3.0 | -6.1 | 2.9 | Y |
| JCO8_364 | 17.53 | 2.62 | 174 | -9999 | -15.2 | 1.4 | 23.7 | 4.1 | 1.62 | 0.71 | 0.66 | Y | ||||
| JCO8_395 | 17.65 | 2.52 | 241 | -9999 | -15.4 | 2.1 | 20.0 | -9999 | 0.76 | 0.77 | 0.67 | Y | ||||
| JCO8_550 | 17.87 | 2.84 | 480 | -9999 | -12.1 | 5.9 | 46.1 | 4.7 | 3.58 | 0.91 | 0.62 | Y | ||||
| JCO9_120 | 14.40 | 1.10 | 94 | -9999 | -13.2 | 0.5 | 20.0 | -9999 | -1.17 | 0.27 | 0.30 | 4.9 | 5.9 | 1.9 | 5.9 | Y |
| JCO9_281 | 14.96 | 1.42 | 107 | 19 | -13.4 | 0.4 | 20.0 | -9999 | -0.22 | 0.45 | 0.49 | -3.2 | 6.1 | -6.9 | 5.9 | Y |
| JCO9_406 | 14.54 | 1.21 | 211 | -9999 | -21.3 | 6.1 | 25.0 | -9999 | -1.00 | 0.28 | 0.28 | -3.1 | 5.9 | -2.2 | 5.9 | N |
| JCO9_508 | 13.51 | 1.27 | 58 | -9999 | -14.8 | 0.4 | 20.0 | -9999 | -1.13 | 0.20 | 0.27 | -0.5 | 5.9 | 1.2 | 5.9 | N |
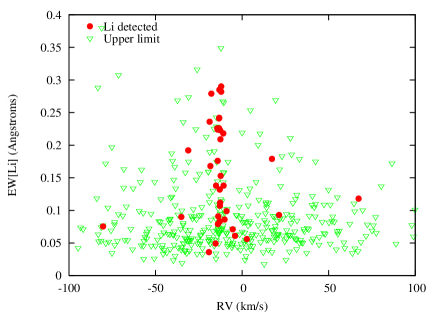
Cluster membership was assessed primarily from the RVs. The cluster is clearly present as a concentration in the RV distribution (see Fig. 3), although it sits upon a much broader contaminating field star distribution. The subset of stars with strong Li 6708Å features have very similar RVs. Discarding several outliers, there are 22 Li-rich stars, which we assume are cluster members, with RV km s-1, giving a weighted mean RV of km s-1. Using spectra of all the observed RV standards we estimate an additional external error on this mean of km s-1, making our value consistent with the km s-1 found by PG94, but km s-1 higher than the value reported by M08. Comparing the standard deviation of the RVs with their individual uncertainties indicates an intrinsic cluster RV dispersion of 1 km s-1. Adding this internal dispersion to the RV uncertainties in quadrature, we then accept any star with an RV within 1.5-sigma of the cluster mean as a probable cluster member, yielding 56 candidates. Applying similar criteria for assumed mean RVs 10 km s-1 either side of the IC 4665 RV allows us to estimate that about of these 56 candidates are non-members with RVs that randomly coincide with IC 4665.
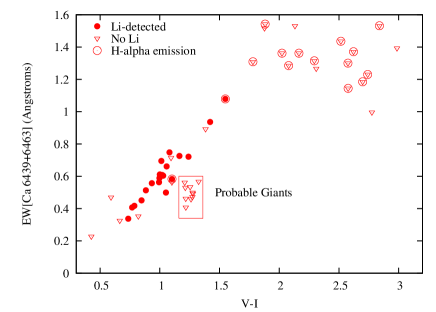
The candidate list was refined in several ways. Figure 1 shows that the heaviest contamination is expected for where a “finger” of background K-giants cuts across the cluster sequence. To filter these out, we measured the EWs of two gravity-sensitive, isolated Ca i lines at 6439Å and 6463Å. We have used the spectral synthesis software uclsyn (Smalley, Smith & Dworetsky 2001) along with Atlas stellar atmosphere models (Kurucz 1993) to establish that these should be a about a factor of 2 weaker in giants than in dwarfs of the same temperature/colour. Accordingly, in Fig. 4 we identify 10 of our candidates, all with , that have weaker Ca i lines than expected for dwarfs and which we class as probable giants (or dwarfs with a low metallicity) and hence not cluster members. As expected, none of these have measurable Li, rapid rotation or H emission (see below).
Proper motions for 45 of the 56 RV candididates are found in the nomad database (Zacharias et al. 2004). The mean proper-motion of the Li-rich stars is milli-arcsec/yr in RA and milli-arcsec/yr in Dec. This is not greatly different from the mean for field stars in this direction. We find that 2 stars (the brightest F-star in our sample [JCO4_295] and an M-dwarf with H in absorption, [JCO4_558]) have proper-motions incompatible with cluster membership at the 3-sigma level.
We measured the EW of the H line by direct integration above (or below) a pseudo-continuum. Most of the cooler targets exhibit H emission (see Fig. 4), as expected for young, chromospherically active stars. It is unlikely that the 4 cool targets () with H in absorption are members, because H emission is ubiquitous for such stars, even in older clusters like IC 2391 and the Pleiades (see Stauffer et al. 1997). These four objects are probably older contaminating field stars and one of them is also a non-member by proper motion as explained above. We wish to use H emission as an age indicator later on (see section 5), so we do not discard these objects, but mark them as “possible” members.
Finally, we have taken magnitudes from 2MASS (Cutri et al. 2003) and plotted the vs diagram. Only one star stands out from the general trend of photospheric colours, and this only by 2.5-sigma. JCO5_329 is a target with and , which is too red in by about mag compared with other cluster candidates. This could perhaps be due to warm circumstellar dust, although this is unlikely at an age of Myr. For now this star is classed as a “possible” member.
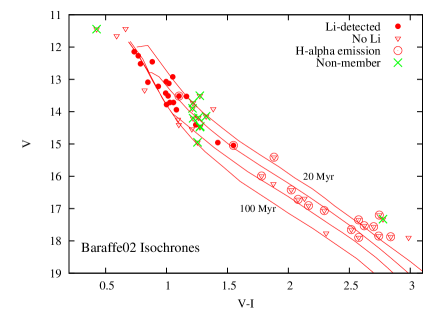
The 40 stars that pass all these tests are classified as definite members. The full 56-star candidate list and a summary of the measurements and membership judgements are shown in Fig. 5 and listed in Table 2.
3.1 Comparison with other work on IC 4665
Many of our targets and members were selected as such and studied by Prosser (1993), PG94, MM97 and M08. We comment in detail on the comparison of our measurements and membership selections with these papers below.
We find 137 of our targets have and photometry in Prosser (1993). The agreement of this photometry with that presented here is good. The average difference in magnitudes (ours minus Prosser) is mag with a standard deviation of 0.086 mag. After converting Prosser’s Kron colours to Cousins colours using the formulae of Bessell & Weis (1987), the average difference in colour is mag with a standard deviation of 0.077 mag and no obvious colour dependence in the range .
There are 30 stars with RVs common to our work and PG94. The agreement is excellent apart from 4 objects. Three of these (JCO4_057P166 , JCO5_160P19 and JCO8_038P38) have been identified by us as probable SB2 binary systems (see Table 1). The other (JCO9_462P66) has a RV discrepancy (our value minus that of PG94) of and it is probably a short period SB1 binary. For the remaining 26 stars the average RV discrepancy is with a standard deviation of 2.1 . Ignoring the SB2 objects mentioned above, then the values quoted by PG94 also agree well with our measurements. The one exception is JCO6_347P12, where PG94 find but we have . As both MM97 and Allain et al. (1996) also find that P12 is a rapid rotator, with and a rotation period of 0.60 days respectively, then it seems likely that the PG94 measurement is in error. We have 12 measurements for targets in common with Shen et al. (2005) and all are in perfect agreement.
There are 59 targets common to this paper and M08. A comparison of RVs reveals three probable SB1 binaries (JCO5_039 number 103 in M08, with RV difference of ; JCO4_271 M08 number 40, RV ; JCO4_249 M08 number 116, RV ). After clipping out these objects, the mean difference between our RVs and those of M08 is , with a standard deviation of 1.9 .
We have been able to compare our values for EW[Li] with 12 stars also studied by MM97. Agreement is good with the average EW difference (ours minus MM97) being mÅ with a standard deviation of 27 mÅ. We also have 5 targets with EW[Li] listed by M08 and again, the agreement is good.
In terms of selected members, there are 7 objects selected by PG94 or by MM97 as cluster members that are not in our list of candidate members (Table 2). For P12, P19, P27, P38 and P166 these either have an RV outside our selection range or are possible SB2 binary systems. The objects P39 and P155 may be genuine members but are among the 13 per cent of photometric candidates we did not observe spectroscopically. There are 27 candidate members considered by M08 that do not appear in our Table 2. Most of these are too faint () to have been included in our sample, but six (identified by M08 with the numbers 6, 16, 20, 59, 83 and 125) were observed by us but had RV values outside our selection range. JCO5_190 ( M08 number 59) is a probable binary system according to both us and M08. JCO6_038 ( M08 number 20) is a binary according to M08, but we have only one RV measurement. M08 claim weak detections of Li with EWs between 30 and 70 mÅ in stars 6, 16, 20, 59 and 126. Our measurements are in agreement apart from for star 6 ( JCO6_063) where we find EW[Li] mÅ compared with the mÅ measured by M08.
4 Lithium Depletion in IC 4665

4.1 Lithium Equivalent Widths
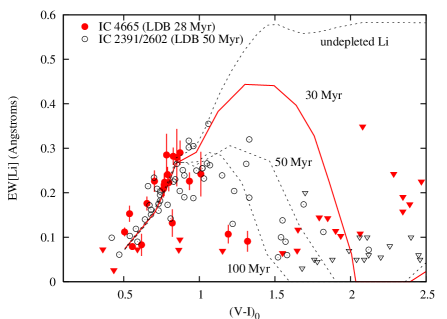
Figure 6 compares EW[Li] as a function of intrinsic in IC 4665 (from Table 2 excluding the 12 non-members, so only a few contaminants may be left and these may have already been identified as the “possible” members – see section 3) with EW[Li] measured in a similar way for stars in the IC 2391, IC 2602 and Pleiades clusters. The contribution of the weak, blended Fe i 6707.44Å line has not been removed from any of the EWs at this stage. We have initially chosen to make the comparison in this observational plane because the relative uncertainties are easier to understand and besides which, as the clusters have similar metallicity (see section 5) the transformation to Li abundance versus is similar for each of these clusters.
IC 2391 has a measured LDB age of Myr (Barrado y Navascues et al. 2004) and IC 2602 is usually assumed to have a similar age based on low-mass isochronal fits. The Li data come from the analyses of Randich et al. (1997) and Randich et al. (2001), the photometry from papers by Patten & Simon (1996) and Prosser, Randich & Stauffer (1996). The colours of the plotted data have been corrected for reddening ( and 0.04 for IC 2391 and IC 2602 respectively – Patten & Simon 1996) . Our purpose is to show that whilst the amount of Li-depletion seen among F- and G-type stars () is quite similar in IC 4665 and IC 2391/2602 (actually, it is consistent with very little depletion at all, see below and section 4.2), the few K- and early M-type stars we have found in IC 4665 seem to have undergone as much or more Li-depletion, despite this cluster having a younger LDB age. Note that uncertainties in the relative cluster reddenings (dominated by the mag in for IC 4665) affect the comparison of F/G stars far more than for cooler stars.
The status of the K- and M-stars becomes more significant when considered in the context of the Li depletion predicted by PMS models. Figure 6 also shows loci of EW[Li] expected for undepleted lithium, along with isochrones at ages of 30, 50 and 100 Myr, determined using the Baraffe et al. (2002) evolutionary models with convective mixing length set to 1.0 pressure scale height. These isochrones were calculated using a relationship between and effective temperature from Kenyon & Hartmann (1995), a curve of growth for the Li i 6708Å feature described in Jeffries et al. (2003) and an assumed initial Li abundance of (Li), on the conventional logarithmic scale (Anders & Grevesse 1989). The curve representing an undepleted level of Li is an excellent match to EW[Li] measurements for cool objects in star forming regions over the whole colour range considered (e.g. see Jeffries et al. 2009). The lower EW[Li] in stars of the same colour in young PMS clusters like IC 2391/2602 has long been cited as evidence for PMS Li depletion (e.g. Randich et al. 2001).
Evolutionary models by different authors predict different levels of Li depletion as a function of time (e.g. Pinsonneault, Kawaler & Demarque 1990; Pinsonneault 1997; D’Antona & Mazzitelli 1997; Siess, Dufour & Forestini 2000; Piau & Turck-Chièze 2002) . We have chosen the Baraffe et al. (2002) models because they reasonably match the average Li depletion seen in IC 2391/2602 at their LDB age, although underpredict the Li-depletion seen in some of the cooler stars. However, if IC 4665 were Myr younger than IC 2391/2602, as suggested by its LDB age, we would expect to see stars with much higher EW[Li] (at the same intrinsic colour) than in IC 2391/2602 for , and to have detected lithium in stars as cool as . Whether or not the detailed predictions of these models are correct, all published models predict a significant diminuition of EW[Li] with age at the colour of K- and M-stars. The observed progression of EW[Li] between the K- and M-stars () of IC 4665 and IC 2391/2602 is, if anything, the wrong way around.
Figure 6b shows a similar comparison with Li data from the Pleiades, which has an LDB age of Myr (Stauffer et al. 1998). The Li EWs come from the uniform re-analysis by Sestito et al. (2005); upper limits for cool stars were added from García-López, Rebolo & Martín (1994) and Jones et al. (1996). Kron photometry from Stauffer (1982, 1984) and Prosser, Stauffer & Kraft (1991) has been converted to the Johnson-Cousins system using the transformation in Bessell & Weis (1987). A reddening of was assumed, except for those few stars listed in Table 9 of Soderblom et al. (1993a), which have larger reddening values. The F- and G-stars of the Pleiades have marginally lower EW[Li] than their equivalents in IC 4665. This may indicate some Li-depletion, but the uncertainty in for IC 4665 could eliminate most of this difference. The EW[Li] of the K- and M-stars of IC 4665 appear consistent with the most Li-depleted K- and M-stars in the Pleiades. Despite being much older, a significant fraction of the Pleiades population lies above the existing data in IC 4665.
We have checked through all of our IC 4665 spectra to see whether any possible cluster members with high levels of Li might have been excluded during the RV selection process. There are a number of objects with significant Li i 6708Å detections that are either young field stars or candidate short-period binary stars in IC 4665 (see Fig. 3 and Table 1). However, none of these lie above the envelope of IC 4665 candidate members in Fig. 6, so their inclusion could only reinforce the phenomena described above.
4.2 Lithium Abundances
| Identifier | (K) | (Li) | (Li) | (Li) | Identifier | (K) | (Li) | (Li) | (Li) | ||
|---|---|---|---|---|---|---|---|---|---|---|---|
| (K) | LTE | NLTE | (K) | LTE | NLTE | ||||||
| JCO1_427 | 0.997 | 5742 | 3.33 | 0.20 | 3.12 | JCO5_280 | 1.094 | 5166 | 1.82 | 1.93 | |
| JCO1_530 | 0.787 | 6389 | 3.12 | 0.19 | 3.02 | JCO5_282 | 0.735 | 6608 | 3.51 | 0.13 | 3.34 |
| JCO2_145 | 0.768 | 6450 | 3.54 | 0.10 | 3.35 | JCO5_296 | 1.081 | 5243 | 3.17 | 0.50 | 2.96 |
| JCO2_213 | 0.933 | 6062 | 3.64 | 0.12 | 3.35 | JCO5_329 | 0.664 | 7099 | |||
| JCO2_220 | 2.023 | 3856 | 0.09 | JCO5_394 | 2.132 | 3763 | -0.37 | ||||
| JCO2_373 | 0.883 | 6214 | 3.50 | 0.09 | 3.29 | JCO5_472 | 2.165 | 3738 | -0.50 | ||
| JCO2_637 | 2.745 | 3456 | 2.16 | JCO5_515 | 2.741 | 3458 | 0.56 | ||||
| JCO2_736 | 2.986 | 3393 | 0.80 | JCO5_521 | 2.294 | 3638 | -0.50 | ||||
| JCO3_065 | 1.549 | 4375 | 0.75 | 0.22 | JCO6_088 | 1.028 | 5587 | 3.20 | 0.17 | 3.02 | |
| JCO3_285 | 0.820 | 6340 | 3.33 | 3.18 | JCO6_095 | 1.013 | 5668 | 3.71 | 0.35 | 3.33 | |
| JCO3_357 | 1.102 | 5128 | 3.20 | 0.20 | 2.97 | JCO6_111 | 1.780 | 4120 | 0.41 | ||
| JCO3_395 | 1.057 | 5426 | 3.41 | 0.16 | 3.13 | JCO6_240 | 0.591 | 7418 | |||
| JCO3_396 | 0.993 | 5758 | 3.29 | 0.16 | 3.09 | JCO7_021 | 1.019 | 5635 | 3.37 | 0.16 | 3.13 |
| JCO3_724 | 2.310 | 3625 | 1.52 | JCO7_079 | 0.847 | 6286 | 3.20 | 0.13 | 3.08 | ||
| JCO3_770 | 2.699 | 3470 | 0.53 | JCO7_088 | 1.882 | 4001 | 0.42 | ||||
| JCO4_053 | 1.164 | 5071 | 2.73 | 0.15 | 2.66 | JCO7_670 | 2.576 | 3489 | -0.05 | ||
| JCO4_226 | 1.000 | 5730 | 3.36 | 0.17 | 3.13 | JCO8_257 | 1.051 | 5459 | 2.49 | 0.19 | 2.50 |
| JCO4_337 | 1.383 | 4584 | 1.06 | 1.32 | JCO8_364 | 2.622 | 3478 | 0.11 | |||
| JCO4_437 | 2.079 | 3806 | -0.02 | JCO8_395 | 2.516 | 3507 | 0.64 | ||||
| JCO4_459 | 2.577 | 3488 | 0.27 | JCO8_550 | 2.839 | 3430 | 2.52 | ||||
| JCO4_591 | 1.877 | 4007 | -0.50 | JCO9_120 | 1.101 | 5132 | 1.97 | 1.86 | |||
| JCO5_179 | 1.240 | 4900 | 2.63 | 0.37 | 2.59 | JCO9_281 | 1.421 | 4521 | 1.29 | 0.23 | 1.55 |
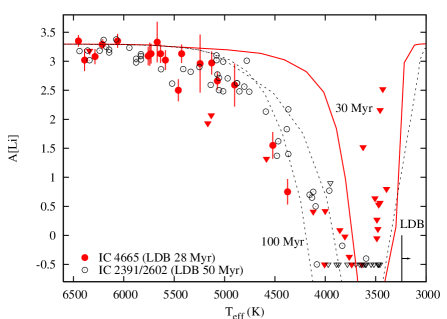
An alternative way to view these comparisons is to calculate Li abundances. The procedure described in detail by Jeffries et al. (2003) was used to convert intrinsic colours to and then transform EW[Li] into an abundance using a curve of growth for the Li i 6708Å feature. The curve of growth is based on the calculations presented by Soderblom et al. (1993b) for K and those of Zapatero-Osorio et al. (2002) for cooler objects. Prior to the transformation, EW[Li] was corrected for the presence of the weak, blended Fe i line, using the formula EW[Fe], derived from the correction as a function of suggested by Soderblom et al. (1993b) after applying the relation of Kenyon & Hartmann (1995). The curves of growth are based on LTE atmospheres. NLTE corrections to the Li abundances were made using the results of Carlsson et al. (1994). The corrections vary from about dex for K and (Li), to dex for K and (Li). The Carlsson et al. (1994) corrections are only calculated for K, so for cooler stars no corrections have been applied. For K it is likely that the absolute corrections become smaller (Pavelenko & Magazzu 1996).
The Li abundances for the IC 4665 members (and possible members) from Table 2 are given in Table 3. Note that any abundances (Li) are extrapolations beyond the calibrated limits of the curves of growth and are pegged at this value. Similarly, we have not derived abundances for stars with K. The abundance uncertainties are derived from propagated uncertainties in EW[Li] combined in quadrature with errors due to random uncertainties, assumed to be K. There are also a number of systematic uncertainties to consider which are discussed at length by Jeffries et al. (2003). Most of these, such as the adopted temperature scale and curves of growth, affect stars in all the clusters considered and do not alter comparisons between them. However, there are systematic uncertainties at the dex level which will affect the comparison with models of Li depletion and the assumed initial Li abundance also has some uncertainty. We used an initial (Li), on the basis of the meteoritic Li abundance in the solar system (Anders & Grevesse 1989). It seems reasonable to assume that the initial abundance is similar for all the clusters considered, because they have very similar metallicities (see section 5), but there could still be systematic errors of dex in the absolute model abundances.
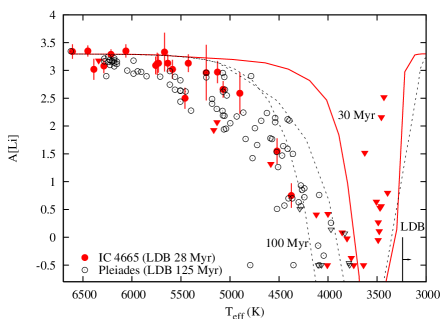
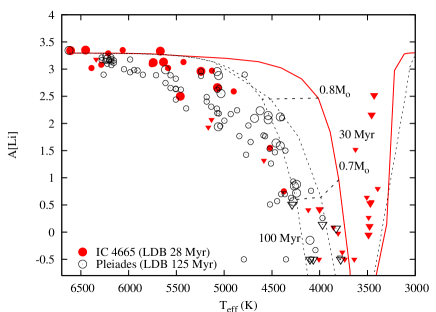
Figure 7 shows comparisons between IC 4665, IC 2391/2602, the Pleiades and the Baraffe et al. (2002) Li depletion models in the (Li)- plane. Because the transformations are similar for each cluster then the points made in the last subsection by comparing EW[Li] are equally valid here – namely, that the cool IC 4665 members are as or more depleted than stars of the same in IC 2391/2602 and occupy the same region as the most Li-depleted stars in the Pleiades. There is some evidence that the hotter stars ( K) in IC 4665 have depleted a little less Li than their counterparts in the Pleiades, but again we caution that this conclusion rests on the adopted reddening for IC 4665. A reduction in of 0.06 mag, would make the hotter stars cooler by about 100 K and reduce (Li) by about 0.15 dex. At lower temperatures ( K) the assumed reddening has less influence; any uncertainty shifts the points almost parallel to the trend of decreasing abundance with decreasing temperature seen in the data and models, and hence does not greatly alter the comparison between one cluster and another or the comparison with the models.
The comparison with the models shows again that IC 4665 appears to have suffered much more depletion than expected. Other models with greater convective efficiency (e.g. the Baraffe models with a mixing length of 1.9 pressure scale heights) could address this, but these models would also predict far too much depletion to account for the observed Li abundances in IC 2391/2602 and the Pleiades.
The below which Li re-appears on the other side of the “Li-chasm” can be estimated from the data in M08. The LDB occurs at , corresponding to from the colour- relations of Kenyon & Hartmann (1995). This appears to be in perfect agreement with the predictions of the 30 Myr Baraffe et al. (2002) isochrone, though it should be noted that there are probably uncertainties of 100-200 K in our estimated LDB .
5 Discussion
5.1 The age of IC 4665
The LDB age of IC 4665 quoted by M08 is Myr, where the bulk of the uncertainty is due to uncertainty in the distance ( pc) to the cluster. The re-analysis of the Hipparcos data by van Leeuwen (2007) improves matters only a little, where a mean distance to IC 4665 of pc is found. The LDB age is found from the luminosity of the brightest very low-mass stars at temperatures below the “Li-chasm” (see Fig. 7) which still retain their initial lithium (see M08). Although age spreads of up to 10 Myr have been suggested in young clusters (Palla & Stahler 2000; Jeffries 2007), there is no strong evidence in M08 for Li-depleted cluster members below the LDB luminosity that might indicate the presence of a significant fraction of older stars in the cluster. In any case, a 10 Myr age spread would not alter any of our subsequent discussion and conclusions.
The LDB age has two key advantages over other age estimation techniques. First, although it is dependent on an assumed distance, it is much less sensitive to distance than some other methods, notably fitting isochrones to either the high- or low-mass stars (see below). Second, the physics of Li-depletion in fully convective low-mass stars is thought to be well enough understood that little room for systematic error remains. Indeed, any errors that persist must be due to effects that are currently not being debated by the various “flavours” of current low-mass evolutionary models, as they all give the same LDB ages to within a few per cent for clusters at Myr (see Burke et al. 2004; Jeffries & Oliveira 2005). For these reasons we attribute the greatest confidence to both the absolute and relative ages of clusters determined using the LDB technique.
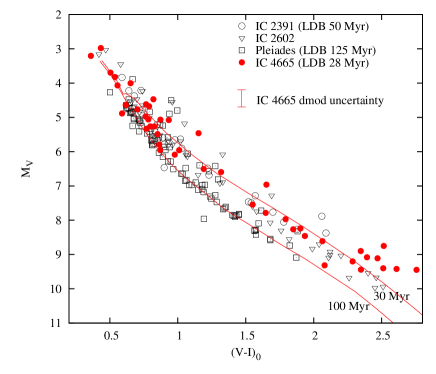
We can now ask whether the absolute ages and relative age ordering of clusters derived using other techniques concur with the LDB ages? For IC 4665, the age we would deduce from the low-mass isochrones in Fig. 5 (given a mag distance modulus uncertainty) is in the range 20–50 Myr, probably younger than the IC 2391 and IC 2602 clusters (see also M08) and certainly younger than the Pleiades. These absolute isochronal ages could be in error so it helps to look at relative ages. Figure 8 plots absolute versus intrinsic diagram for these clusters, using the points plotted in Fig. 6 and using intrinsic distance moduli of 6.05 mag, 5.95 mag and 5.54 mag for IC 2391, IC 2602 and the Pleiades respectively (Stauffer et al. 1997).
From Fig. 8 we can conclude that IC 4665 is younger than the Pleiades, but depending on the exact distance (the uncertainty is indicated in the diagram) it could be younger than IC 2391/2602 (and consistent with the LDB age) or of a similar age. Note that any uncertainty in the reddening tends to shift points parallel to the cluster sequence, so is relatively unimportant compared with the distance uncertainty. There is some indication from the upper part of the diagram, where the 30 and 100 Myr isochrones converge, that the assumed distance of 370 pc for IC 4665 may be too small. Better agreement with the shape of the isochrones would be achieved with a larger distance (say 400 pc), which would move the IC 4665 towards a younger isochronal age, in accord with its LDB age and younger than IC 2391/2602.
The ages determined from the nuclear turn-off in the Hertzsprung-Russell diagram do not contradict the age order of these clusters determined from their LDBs. IC 4665, IC 2391 and IC 2602 were assigned nuclear turn-off ages of 36 Myr by Mermilliod (1981) who also assigned the Pleiades an older age of 78 Myr. These ages are dependent on uncertain interior physics such as the amount of convective core overshoot, but the age sequence should be secure.
Other indicators of youth such as the fraction of G-stars which are rapid rotators and the colour/spectral type at which H first appears in emission are less precise (e.g. Jeffries, Totten & James 2000). In both these respects, IC 4665 appears as young as IC 2391 and IC 2602, although the statistics are poor. In the range , where significant spin down might be expected between ages of 30 and 50 Myr, there are 16/32 stars in IC 2391 and IC 2602 (of those plotted in Fig. 6) that have km s-1, where measurements come from the same papers as the Li data. In the Pleiades this fraction has dropped to only 6/56, where we have taken from Queloz et al. (1998), Soderblom et al. (1993a) or Stauffer & Hartmann (1987), in that priority order. The equivalent fraction among IC 4665 candidate members is 5/15, so is similar to IC 2391/2602, but inconsistent with the Pleiades (excluded with 95 per cent confidence by a two-tailed Fisher test). In IC 2391/2602 H emission first occurs at and is ubiquitous for (see Stauffer et al. 1997; Jeffries et al. 2000). In IC 4665 H emission is first seen in a star with and 15/19 stars with exhibit H emission (see Fig. 5). Given the likelihood that a few contaminating dwarfs remain in the sample, the four cool candidates exhibiting H absorption are possibly non-members as discussed in section 3.
We conclude that the isochronal age, the rotation of solar type stars and the chromospheric activity are consistent with the LDB age of IC 4665 and support its ranking within the age sequence of young clusters.
5.2 Strong Li depletion in the K- and M-stars of IC 4665?
Given the general agreement between the sequencing of the isochronal, nuclear turn-off and LDB ages, and the likelihood that there is little theoretical uncertainty in the latter, we are left with the task of explaining why, in IC 4665, the Li-depletion pattern seen among its K/M-stars would indicate an age that is significantly older. Even though only a small number of stars have been observed, one would estimate that IC 4665 is at least as old as the Pleiades from the evidence presented in Figs. 6b and 7b.
One “uninteresting” possibility that can be discounted is that we have not observed any members of IC 4665 with at all, and that the small Li i EWs in Fig. 6 have been measured in contaminating field stars that randomly have the cluster RV. There are three strong arguments against this: (i) the predicted number of field star contaminants ( minus the 12 definite non-members, minus the 4 “possible members”) remaining in the whole candidate sample is less than the number of cluster candidates in this colour range; (ii) six candidates in this colour range exhibit H emission, which is a strong indicator of youth and rarely seen in field stars with these colours; (iii) the presence of Li-rich mid/late M-dwarfs beyond the LDB in IC 4665 (see M08) conclusively demonstrates that the cluster mass function is not truncated below G-dwarfs. The limits of correspond approximately to (for a 28 Myr Baraffe et al. 2002 isochrone). de Wit et al. (2006) used a photometric survey and statistical subtraction of background contamination to estimate that the mass function of IC 4665, within 0.5 degrees of the cluster centre, is at these masses. Given that our survey has covered 87 per cent of “eligible” cluster members, with a further per cent lost through our RV selection (because only 87 per cent will be within 1.5 sigma of the mean), we would expect to have seen cluster members with , which is comparable to (and certainly not lower) than the 10 candidates we have actually found.
More interesting physical explanations could centre around the chemical composition and rotation rates in IC 4665. Theoretically, PMS Li-depletion among stars with should be extremely sensitive to radiative opacity in the outer envelope and hence stellar metallicity. A higher metallicity should lead to deeper convection zones with hotter base temperatures and hence more extensive Li burning (see Pinsonneault 1997). For instance Piau & Turck-Chièze (2002) show that a mere 6 per cent increase in average metallicity could increase the PMS Li-depletion in solar mass stars by a factor of two. Likewise, the models of Siess, Dufour & Forestini (2000) predict that a 0.9 star with a metallicity of will have depleted lithium by 1.2 dex at an age of 30 Myr, but if the metallicity is increased to the star has a similar but has depleted lithium by more than 5 dex!
At Myr a 0.9 star has and K according to the Baraffe et al. (2002) models we are using. Figures 6 and 7 show that in order to place the K-stars of IC 4665 above those of IC 2391/2602 or the Pleiades would require about 1 dex less Li-depletion and about 2 dex less Li-depletion in order to agree with the predictions of the corresponding Baraffe et al. (2002) model isochrone. Perhaps this could be explained if IC 4665 were modestly more metal-rich than IC 2602/2391, the Pleiades and the metallicity adopted in the Baraffe et al. models? The available evidence does not wholly support or exclude this. Shen et al. (2005) spectroscopically determined [Fe/H] for F- and G-stars in IC 4665, with the abundances of other elements also similar to solar values. Platais et al. (2007) found [Fe/H] for IC 2391, whilst the Pleiades has [Fe/H] and solar abundance ratios (Wilden et al. 2002), both determined using similar techniques.
A recent paper by D’Orazi & Randich (2009) obtains even more precise values of [Fe/H] and for IC 2391 and IC 2602 respectively, with the abundance ratios for other elements close to solar values too. It does not seem likely therefore that IC 4665 is more metal-rich than IC 2391 and IC 2602 unless there is some large discrepancy in the abundance analysis methodology of Shen et al. (2005) and D’Orazi & Randich (2009). Both analyses used Kurucz model atmospheres and derive abundances differentially with respect to the Sun. However, Shen et al. (2005) fit their spectra with synthetic models to simultaneously derive stellar parameters (including ) and abundances, whilst D’Orazi & Randich derive from photometric indices and then obtain abundances from a more traditional equivalent width analysis. A possible source of systematic error is therefore the adopted temperature scale, but Shen et al. show that their fitted values are in excellent agreement with values determined from the relationship between and proposed by Alonso, Arribas & Martínez-Roger (1996) using for IC 4665. This relationship is in turn very similar to the relationship used by D’Orazi & Randich (2009) (within 30 K at 5500 K), so no inconsistency is indicated. It would be a valuable exercise to analyse the IC 2391/2602 spectra using the same approach adopted by Shen et al. (2005) to rule out any remaining possibility of systematic error.
In summary, IC 4665 could be of order 0.1 dex more metal-rich than the Pleiades – hence explaining the relative Li abundances of the K- and M-stars of these clusters. However, on the basis of the published evidence, IC 4665 seems unlikely to be more metal-rich than the IC 2391 and IC 2602 clusters by more than a few hundredths of a dex. If this were responsible for the excessive Li depletion of K- and M-stars in IC 4665 with respect to the predictions of PMS models, then the influence of metallicity must be very strong indeed. The lack of significant differences between the Li abundance trends seen in a number of Pleiades-age clusters argues against such a strong metallicity dependence during the PMS Li-depletion phase (e.g. Soderblom et al. 1993b; Jeffries, James & Thurston 1998; Jeffries & James 1999; Barrado y Navascués et al. 2001).
Another possibility is a dependence of Li-depletion on rotation rate. Several authors have remarked that the wide spread in Li i EWs and consequently deduced Li abundances among the K-stars of young clusters may be correlated with rotation rate. This finding is based mainly on the Pleiades and clusters of similar age (e.g. Soderblom et al. 1993b; Jeffries et al. 1998; Randich et al. 1998), where it is found that the fastest rotators tend to have the strongest Li i features and the lower boundary of the (Li) distribution is defined mainly by the slowest rotators. This may indicate that the fast rotators have preserved more of their initial Li, but could also be caused by problems with the model atmospheres, associated with rotationally-induced chromospheric activity or starspots (Stuik, Bruls & Rutten 1997; Ford, Jeffries & Smalley 2002).
It is notable in this context that only 1 out of 10 IC 4665 candidates with has km s-1. In contrast, the equivalent fractions for the IC 2391/2602 and Pleiades samples in Fig. 6 are 10/25 and 18/44. According to a two-tailed exact Fisher test we can marginally reject the null hypothesis that the fraction of rapid rotators is similar in IC 4665 to IC 2391/2602 or the Pleiades at confidence levels of 88 or 92 per cent respectively. Balanced against this, one might expect 0.7-1.0 stars to spin-up as they contract between 28 Myr and 125 Myr, but even neglecting angular momentum loss this spin-up should only be a modest factor of (Baraffe et al. 2002).
Figure 9 represents this information in graphical form, where the fast rotators in the Pleiades and IC 4665 are identified by larger symbols. The Pleiades fast rotators appear to have depleted less Li than their slower rotating counterparts and these in turn have similar levels of Li depletion to the few K- and early M-type stars in IC 4665. Our view of the IC 4665 Li-depletion pattern might change if some rapidly rotating K-star members were found with higher levels of Li, but as discussed above, our data should include 75 per cent of cluster members in our survey area. If the RV selection criteria were relaxed so that 87 per cent of cluster members would have been included, there are still no Li-rich stars to be found. Even if a rapidly rotating, Li-rich member should emerge from the few remaining unstudied candidates, we would still have to explain why there are K- and M-type stars in IC 4665 that appear as Li-depleted as the most depleted stars of similar types in IC 2391, IC 2602 and the Pleiades.
Finally we comment on the status of the PMS models themselves. There may be a number of modifications or additions required in order to match emerging measurements of masses and radii for eclipsing PMS binaries (e.g. see Stassun et al. 2004). Much of the discussion centres around the efficiency of convection and whether it is simply less effective than usually assumed (both on the PMS and for main-sequence binaries) or whether it may be suppressed by the presence of dynamo-generated fields at the interface between radiative and convective zones (e.g. Chabrier, Gallardo & Baraffe 2007).
The lack of progression with age in Fig. 7 between IC 4665, IC 2391/2602 and the Pleiades (and other clusters at a similar age) offers an important constraint, but also presents an interesting dilemma when considered in this context. The problem is not how to prevent further Li depletion between ages of 30 and 125 Myr, but to explain why stars of a given Li abundance do not get significantly hotter over this period. This is demonstrated in Fig. 9, where evolutionary tracks for stars of 0.7 and 0.8 are shown. In the Baraffe et al. (2002) models with a relatively low convection efficiency (a mixing length of 1.0 pressure scale height), Li depletion is almost complete by an age of 30 Myr at these masses. The change from the 30 Myr through to the 100 Myr isochrone is driven by the development of the radiative core, the corresponding change in the average polytropic index of the star and its traverse across the Hertzsprung-Russell diagram to hotter temperatures along the Henyey track (Henyey, Lelevier & Levée 1955). To prevent, or minimise this evolution in requires more efficient convection (or increased radiative opacities). This is clearly seen in current models with higher convective efficiency or higher metallicity (opacity), where there is much less difference between the 30 and 100 Myr (Li)- isochrones (e.g. see Fig. 9 in Jeffries et al. 2003). But paradoxically, this leads to much greater Li depletion at a given age and , so that such models cannot match the observed data, unless there were some compensatory effect, for example in the atmospheric modelling, which made the models much cooler (by several hundred Kelvin).
6 Summary
In this paper we have used a radial velocity survey to select candidate members of the young cluster IC 4665. The candidates have been filtered according to a number of criteria and the final list (Table 2) contains 40 highly probable members and a few possible members, of which we estimate only a few could still be contaminating foreground dwarfs. Table 2 should contain 75 per cent of cluster members with over the central square degree of the cluster.
The nuclear turn-off and isochronal ages of IC 4665 are consistent with its lithium depletion boundary age of Myr. However, the amount of lithum depletion seen among the K- and early-M stars of IC 4665 is greater than expected when compared with similar stars in other clusters of known age, and if judged in isolation, would indicate an age as old as the Pleiades at 125 Myr. Despite the small number of stars observed, this finding has important implications for the use of Li-depletion as an age indicator. It is precisely in the regime of small number statistics for loose kinematic groups or even individual field stars that this technique has been most widely used in the literature to estimate ages (e.g. Zuckerman & Song 2004; Barrado y Navascués 2006; Mentuch et al. 2008). Our results suggest that Li-depletion among young late-type stars is a very crude age indicator indeed, with at least one other parameter besides age determining the rate and overall level of PMS Li depletion.
A possible explanation could be differences in metallicity and hence radiative opacities between different clusters/stellar groups, leading to variation in convection zone depth and PMS Li depletion. If so, then even metallicity differences similar in size to their systematic uncertainties could be very important. Only a very careful, homogeneous study of Li-depletion in young clusters of similar age, but differing metallicities could confirm and calibrate this effect. Alternatively, there are hints that the rotation rates of K- and M-stars in IC 4665 are slower than in comparison clusters and this may contribute to their apparent Li depletion. Demonstrating a causal effect will be difficult given the small number of K- and early M-type stars in IC 4665.
7 Acknowledgements
Based on observations made with the William Herschel Telescope operated on the island of La Palma by the Isaac Newton Group in the Spanish Observatorio del Roque de los Muchachos of the Instituto de Astrofisica de Canarias. RJJ acknowledges receipt of a Science and Technology Facilities Council postgraduate studentship. DJJ and PAC acknowledge support from the National Science Foundation Career Grant AST-0349075 (Principal Investigator: K. G. Stassun). Thanks are due to an anonymous referee who helped us improve the manuscript.
References
- [\citeauthoryearAllain, Fernández, Martín & BouvierAllain et al.1996] Allain S., Fernández M., Martín E. L., Bouvier J., 1996, A&A, 314, 173
- [\citeauthoryearAlonso, Arribas & Martinez-RogerAlonso et al.1996] Alonso A., Arribas S., Martinez-Roger C., 1996, A&A, 313, 873
- [\citeauthoryearAnders & GrevesseAnders & Grevesse1989] Anders E., Grevesse N., 1989, Geochimica et Cosmochimica Acta, 53, 197
- [\citeauthoryearBaraffe, Chabrier, Allard & HauschildtBaraffe et al.2002] Baraffe I., Chabrier G., Allard F., Hauschildt P. H., 2002, A&A, 382, 563
- [\citeauthoryearBarrado y NavascuésBarrado y Navascués2006] Barrado y Navascués D., 2006, A&A, 459, 511
- [\citeauthoryearBarrado y Navascués, Stauffer, Bouvier & MartínBarrado y Navascués et al.2001] Barrado y Navascués D., Stauffer J. R., Bouvier J., Martín E. L., 2001, ApJ, 546, 1006
- [\citeauthoryearBarrado y Navascués, Stauffer & JayawardhanaBarrado y Navascués et al.2004] Barrado y Navascués D., Stauffer J. R., Jayawardhana R., 2004, ApJ, 614, 386
- [\citeauthoryearBessell, Castelli & PlezBessell et al.1998] Bessell M. S., Castelli F., Plez B., 1998, A&A, 333, 231
- [\citeauthoryearBessell & WeisBessell & Weis1987] Bessell M. S., Weis E. W., 1987, PASP, 99, 642
- [\citeauthoryearBurke, Pinsonneault & SillsBurke et al.2004] Burke C. J., Pinsonneault M. H., Sills A., 2004, ApJ, 604, 272
- [\citeauthoryearCarlsson, Rutten, Bruls & ShchukinaCarlsson et al.1994] Carlsson M., Rutten R., Bruls J. H. M. J., Shchukina N. G., 1994, A&A, 288, 860
- [\citeauthoryearCayrelCayrel1988] Cayrel R., 1988, in Cayrel de Strobel G., Spite M., eds, The impact of very high S/N spectroscopy on stellar physics. IAU Symposium 132 Kluwer, Dordrecht, p. 355
- [\citeauthoryearChabrier, Gallardo & BaraffeChabrier et al.2007] Chabrier G., Gallardo J., Baraffe I., 2007, A&A, 472, L17
- [\citeauthoryearCrawford & BarnesCrawford & Barnes1972] Crawford D. L., Barnes J. V., 1972, AJ, 77, 862
- [\citeauthoryearCutri, R. M. et al.Cutri, R. M. et al.2003] Cutri, R. M. et al. 2003, Technical report, Explanatory supplement to the 2MASS All Sky data release. http://www.ipac.caltech.edu/2mass/
- [\citeauthoryearde Wit, Bouvier, Palla, Cuillandre, James, Kendall, Lodieu, McCaughrean, Moraux, Randich & Testide Wit et al.2006] de Wit W. J., Bouvier J., Palla F., Cuillandre J.-C., James D. J., Kendall T. R., Lodieu N., McCaughrean M. J., Moraux E., Randich S., Testi L., 2006, A&A, 448, 189
- [\citeauthoryearD’Orazi & RandichD’Orazi & Randich2009] D’Orazi V., Randich S., 2009, A&A, 501, 553
- [\citeauthoryearDuncan & JonesDuncan & Jones1983] Duncan D. K., Jones B. F., 1983, ApJ, 271, 663
- [\citeauthoryearFavata, Micela, Sciortino & D’AntonaFavata et al.1998] Favata F., Micela G., Sciortino S., D’Antona F., 1998, A&A, 335, 218
- [\citeauthoryearFord, Jeffries & SmalleyFord et al.2002] Ford A., Jeffries R. D., Smalley B., 2002, A&A, 391, 253
- [\citeauthoryearGarcía-López, Rebolo & MartínGarcía-López et al.1994] García-López R. J., Rebolo R., Martín E. L., 1994, A&A, 282, 518
- [\citeauthoryearHenyey, Lelevier & LevéeHenyey et al.1955] Henyey L. G., Lelevier R., Levée R. D., 1955, PASP, 67, 154
- [\citeauthoryearHogg & KronHogg & Kron1955] Hogg A. R., Kron G. E., 1955, AJ, 60, 365
- [\citeauthoryearHorneHorne1986] Horne K., 1986, PASP, 98, 609
- [\citeauthoryearJeffriesJeffries2007] Jeffries R. D., 2007, MNRAS, 381, 1169
- [\citeauthoryearJeffries & JamesJeffries & James1999] Jeffries R. D., James D. J., 1999, ApJ, 511, 218
- [\citeauthoryearJeffries, James & ThurstonJeffries et al.1998] Jeffries R. D., James D. J., Thurston M. R., 1998, MNRAS, 300, 550
- [\citeauthoryearJeffries & NaylorJeffries & Naylor2001] Jeffries R. D., Naylor T., 2001, in Montmerle T., André P., eds, From darkness to light: Origin and evolution of young stellar clusters ASP Conference Series, Vol. 243, San Francisco, p. 633
- [\citeauthoryearJeffries, Naylor, Walter, Pozzo & DeveyJeffries et al.2009] Jeffries R. D., Naylor T., Walter F. M., Pozzo M. P., Devey C. R., 2009, MNRAS, 393, 538
- [\citeauthoryearJeffries & OliveiraJeffries & Oliveira2005] Jeffries R. D., Oliveira J. M., 2005, MNRAS, 358, 13
- [\citeauthoryearJeffries, Oliveira, Barrado y Navascués & StaufferJeffries et al.2003] Jeffries R. D., Oliveira J. M., Barrado y Navascués D., Stauffer J. R., 2003, MNRAS, 343, 1271
- [\citeauthoryearJeffries, Totten & JamesJeffries et al.2000] Jeffries R. D., Totten E. J., James D. J., 2000, MNRAS, 316, 950
- [\citeauthoryearJones, Shetrone, Fischer & SoderblomJones et al.1996] Jones B. F., Shetrone M., Fischer D., Soderblom D. R., 1996, AJ, 112, 186
- [\citeauthoryearKenyon & HartmannKenyon & Hartmann1995] Kenyon S. J., Hartmann L. W., 1995, ApJS, 101, 117
- [\citeauthoryearKuruczKurucz1993] Kurucz R. L., 1993, Technical report, Kurucz Synthe spectral synthesis. Synthe spectral synthesis code, Smithsonian Astrophysical Observatory, CD-ROM No. 18
- [\citeauthoryearLandoltLandolt1992] Landolt A., 1992, AJ, 104, 340
- [\citeauthoryearManzi, Randich, de Wit & PallaManzi et al.2008] Manzi S., Randich S., de Wit W. J., Palla F., 2008, A&A, 479, 141
- [\citeauthoryearMartín & MontesMartín & Montes1997] Martín E. L., Montes D., 1997, A&A, 318, 805
- [\citeauthoryearMentuch, Brandeker, van Kerkwijk, Jayawardhana & HauschildtMentuch et al.2008] Mentuch E., Brandeker A., van Kerkwijk M. H., Jayawardhana R., Hauschildt P. H., 2008, ApJ, 689, 1127
- [\citeauthoryearMermilliodMermilliod1981] Mermilliod J. C., 1981, A&A, 97, 235
- [\citeauthoryearNidever, Marcy, Butler, Fischer & VogtNidever et al.2002] Nidever D. L., Marcy G. W., Butler R. P., Fischer D. A., Vogt S. S., 2002, ApJS, 141, 503
- [\citeauthoryearPalla & StahlerPalla & Stahler2000] Palla F., Stahler S. W., 2000, ApJ, 540, 255
- [\citeauthoryearPatten & SimonPatten & Simon1996] Patten B. M., Simon T., 1996, ApJS, 106, 489
- [\citeauthoryearPavlenko & MagazzuPavlenko & Magazzu1996] Pavlenko Y., Magazzu A., 1996, A&A, 311, 961
- [\citeauthoryearPiau & Turck-ChièzePiau & Turck-Chièze2002] Piau L., Turck-Chièze S., 2002, ApJ, 566, 419
- [\citeauthoryearPinsonneaultPinsonneault1997] Pinsonneault M. H., 1997, ARA&A, 35, 557
- [\citeauthoryearPinsonneault, Kawaler & DemarquePinsonneault et al.1990] Pinsonneault M. H., Kawaler S. D., Demarque P., 1990, ApJS, 74, 501
- [\citeauthoryearPlatais, Melo, Mermilliod, Kozhurina-Platais, Fulbright, Méndez, Altmann & SperauskasPlatais et al.2007] Platais I., Melo C., Mermilliod J.-C., Kozhurina-Platais V., Fulbright J. P., Méndez R. A., Altmann M., Sperauskas J., 2007, A&A, 461, 509
- [\citeauthoryearProsserProsser1993] Prosser C. F., 1993, AJ, 105, 1441
- [\citeauthoryearProsser & GiampapaProsser & Giampapa1994] Prosser C. F., Giampapa M. S., 1994, AJ, 108, 964
- [\citeauthoryearProsser, Randich, Stauffer, Schmitt & SimonProsser et al.1996] Prosser C. F., Randich S., Stauffer J. R., Schmitt J. H. M. M., Simon T., 1996, AJ, 112, 1570
- [\citeauthoryearQueloz, Allain, Mermilliod, Bouvier & MayorQueloz et al.1998] Queloz D., Allain S., Mermilliod J. C., Bouvier J., Mayor M., 1998, A&A, 335, 183
- [\citeauthoryearRandich, Aharpour, Pallavicini, Prosser & StaufferRandich et al.1997] Randich S., Aharpour N., Pallavicini R., Prosser C. F., Stauffer J. R., 1997, A&A, 323, 86
- [\citeauthoryearRandich, Pallavicini, Meola, Stauffer & BalachandranRandich et al.2001] Randich S., Pallavicini R., Meola G., Stauffer J. R., Balachandran S., 2001, A&A, 372, 862
- [\citeauthoryearRandich, Singh, Simon, Drake & SchmittRandich et al.1998] Randich S., Singh K. P., Simon T., Drake S. A., Schmitt J. H. M. M., 1998, A&A, 337, 372
- [\citeauthoryearSestito & RandichSestito & Randich2005] Sestito P., Randich S., 2005, A&A, 442, 615
- [\citeauthoryearShen, Jones, Lin, Liu & LiShen et al.2005] Shen Z.-X., Jones B., Lin D. N. C., Liu X.-W., Li S.-L., 2005, ApJ, 635, 608
- [\citeauthoryearSiess, Dufour & ForestiniSiess et al.2000] Siess L., Dufour E., Forestini M., 2000, A&A, 358, 593
- [\citeauthoryearSmalley, Smith & DworetskySmalley et al.2001] Smalley B., Smith K. C., Dworetsky M. M., 2001, Uclsyn v3.1 incorporating binsyn and telsyn. Keele University
- [\citeauthoryearSoderblom, Jones, Balachandran, Stauffer, Duncan, Fedele & HudonSoderblom et al.1993] Soderblom D. R., Jones B. F., Balachandran S., Stauffer J. R., Duncan D. K., Fedele S. B., Hudon J. D., 1993, AJ, 106, 1059
- [\citeauthoryearSoderblom, Stauffer, Hudon & JonesSoderblom et al.1993] Soderblom D. R., Stauffer J. R., Hudon J. D., Jones B. F., 1993, ApJS, 85, 315
- [\citeauthoryearSong, Caillault, Barrado y Navascués, Stauffer & RandichSong et al.2000] Song I., Caillault J.-P., Barrado y Navascués D., Stauffer J. R., Randich S., 2000, ApJ, 533, L41
- [\citeauthoryearStassun, Mathieu, Vaz, Stroud & VrbaStassun et al.2004] Stassun K. G., Mathieu R. D., Vaz L. P. R., Stroud N., Vrba F. J., 2004, ApJS, 151, 357
- [\citeauthoryearStaufferStauffer1982] Stauffer J. R., 1982, ApJ, 87, 1507
- [\citeauthoryearStauffer, Balachandran, Krishnamurthi, Pinsonneault, Terndrup & SternStauffer et al.1997] Stauffer J. R., Balachandran S. C., Krishnamurthi A., Pinsonneault M. H., Terndrup D. M., Stern R. A., 1997, ApJ, 475, 604
- [\citeauthoryearStauffer, Hartmann, Soderblom & BurnhamStauffer et al.1984] Stauffer J. R., Hartmann L., Soderblom D. R., Burnham N., 1984, ApJ, 280, 202
- [\citeauthoryearStauffer & HartmannStauffer & Hartmann1987] Stauffer J. R., Hartmann L. W., 1987, ApJ, 318, 337
- [\citeauthoryearStauffer, Hartmann & Barrado y NavascuésStauffer et al.1995] Stauffer J. R., Hartmann L. W., Barrado y Navascués D., 1995, ApJ, 454, 910
- [\citeauthoryearStauffer, Schild, Barrado y Navascués, Backman, Angelova, Kirkpatrick, Hambly & VanziStauffer et al.1998] Stauffer J. R., Schild R., Barrado y Navascués D., Backman D. E., Angelova A. M., Kirkpatrick J. D., Hambly N., Vanzi L., 1998, ApJ, 504, 805
- [\citeauthoryearStetsonStetson1987] Stetson P. B., 1987, PASP, 99, 191
- [\citeauthoryearStuik, Bruls & RuttenStuik et al.1997] Stuik R., Bruls J. H. M. J., Rutten R. J., 1997, A&A, 322, 911
- [\citeauthoryearvan Leeuwenvan Leeuwen2007] van Leeuwen F., 2007, Hipparcos, the new reduction of the raw data. Springer, Dordrecht
- [\citeauthoryearWilden, Jones, Lin & SoderblomWilden et al.2002] Wilden B. S., Jones B. F., Lin D. N. C., Soderblom D. R., 2002, AJ, 124, 2799
- [\citeauthoryearZacharias, Monet, Levine, Urban, Gaume & WycoffZacharias et al.2004] Zacharias N., Monet D. G., Levine S. E., Urban S. E., Gaume R., Wycoff G. L., 2004, in Bulletin of the American Astronomical Society Vol. 36 of Bulletin of the American Astronomical Society, The Naval Observatory Merged Astrometric Dataset (NOMAD). pp 1418–+
- [\citeauthoryearZuckerman & SongZuckerman & Song2004] Zuckerman B., Song I., 2004, ARA&A, 42, 685