Star formation and AGN activity in SDSS cluster galaxies
Abstract
We investigate the recent and current star formation activity of galaxies as function of distance from the cluster center in a sample of 521 SDSS clusters at . We characterize the recent star formation history by the strength of the 4000Å break and the strength of the Balmer absorption lines, and thus probe the star formation history over the last Gyr. We show that when the Brightest Cluster Galaxies are excluded from the galaxy sample, there is no evidence for mass segregation in the clusters, so that differences in cluster and field populations cannot simply be attributed to different mass functions. We find a marked star formation–radius relation in that almost all galaxies in the cluster core are quiescent, i.e. have terminated star formation a few Gyr ago. This star formation–radius relation is most pronounced for low-mass galaxies and is very weak or absent beyond the virial radius. The typical star formation rate of non-quiescent galaxies declines by approximately a factor of two towards the cluster center. However, the fraction of galaxies with young stellar populations indicating a recently completed starburst or a truncation of star formation does not vary significantly with radius. These results favor a scenario in which star formation is quenched slowly, on timescales similar to the cluster crossing time, i.e. a few Gyr. The fraction of star-forming galaxies which host a powerful optical AGN is also independent of clustercentric radius, indicating that the link between star formation and AGN in these galaxies operates independent of environment. The fraction of red galaxies which host a weak optical AGN decreases, however, towards the cluster center, with a similar timescale as the decline of star forming galaxies. Our results can be fully explained by a gradual decline of star formation rate upon infall into the cluster, and rule out significant contributions from more violent processes at least beyond cluster radii .
keywords:
galaxies: clusters: general1 Introduction
Galaxies in dense environments, i.e. in galaxy clusters and groups, are observed to have different properties than galaxies in less rich environments - their star formation activity is subdued compared to field galaxies, and the occurrence of early-type galaxies is higher than in the field (Hubble 1936; Dressler 1980, and references thereto). In the field, star formation and morphology are not independent of each other: low star formation rate is correlated with early-type morphology (i.e. elliptical and S0 galaxies), whereas high star formation activity is typical of late-type morphology (disk galaxies). This bimodality is modified in dense environments, as evidenced by the atypical galaxies: the occurrence of passive spiral galaxies is higher in clusters than in the field, whereas star-forming ellipticals are rarer in clusters (Bamford et al. 2009). This suggests that star formation rate couples most strongly to environment, with morphology being only a secondary correlation. Evidence for this has been found in the local universe both in terms of local density (Kauffmann et al. 2004; Blanton et al. 2005; Bamford et al. 2009), as also from studies of clusters (Christlein & Zabludoff 2005; Quintero et al. 2006; van den Bosch et al. 2008a; Weinmann et al. 2009).
In a hierarchical universe, clusters grow by accreting galaxies from less dense environments. In order to form / maintain the star formation – density relation, galaxy properties thus need to be altered upon infall into a group or cluster: star formation needs to be suppressed, and some disk systems may need to be restructured to create spheroidal systems. Several mechanisms have been suggested by which either or both of these transitions may take place. There is increasing evidence (e.g. Weinmann et al. 2006, 2009; van den Bosch et al. 2008a, b) that strangulation, the stripping of a diffuse gas reservoir surrounding the galaxy (Larson et al. 1980), is the most important of these processes. Strangulation is effective already in the cluster outskirts, and removes the gaseous envelope within a few Gyr (Bekki et al. 2002). With no diffuse gas available to replenish the cold disk gas, star formation is shut-off on similarly long time-scales. If the density of the intra-cluster medium is high enough, also the cold disk gas may be stripped (ram-pressure stripping, Gunn & Gott 1972; Farouki & Shapiro 1980; Quilis et al. 2000), thus truncating star formation on a very short time-scale. A few galaxies have been identified where ram-pressure stripping of the star-forming gas is evident through tails of Hi or H emission and UV-bright knots (Gavazzi et al. 2001; Kenney et al. 2004; Sun & Vikhlinin 2005; Sun et al. 2007; Cortese et al. 2007); all these galaxies are observed at the cores of massive clusters. At lower densities, i.e. in the cluster outskirts, ram-pressure stripping seems to be effective at truncating the cold gas disks as traced by HI beyond the stellar disk, but without apparent effects on the optical appearance of these galaxies (Cayatte et al. 1990; Chung et al. 2007).
By themselves, neither strangulation nor ram-pressure stripping can alter the morphology of infalling (spiral) galaxies, apart from the fading of star-forming regions and spiral arms. While galaxy mergers are an efficient mechanism to transform spiral galaxies into ellipticals (e.g. Toomre 1977; Farouki & Shapiro 1982; Negroponte & White 1983; Barnes & Hernquist 1992, 1996; Naab & Burkert 2003; Cox et al. 2006), they are unlikely to occur frequently in galaxy clusters due to the high relative velocities of cluster members (an exception is merging with the central galaxy). However, encounters between galaxies which do not lead to merging can still affect galaxy properties via tidal forces which heat the stellar disk (harassment Moore et al. 1998). Furthermore, galaxies experience tidal forces in the gravitational potential of the cluster, which can similarly heat the stellar disk (Gnedin 2003).
These processes can be distinguished by the different effects they have on the properties of galaxies, and by the timescale on which galaxies are affected. For example, strangulation causes an approximately exponential decline of the star formation rate, ram-pressure stripping truncates star formation abruptly, whereas mergers and tidal interaction cause gas to be transported to the center, thus triggering bursts of enhanced star formation. Examining the recent star formation histories of cluster galaxies is therefore a powerful tool to identify the processes at work.
1.1 Radial cluster profiles as density probes
In galaxy clusters, the star formation–density relation translates to a star formation–radius relation, since the density decreases with increasing (projected) clustercentric radius. Measurements of local density, such as the distance to the neighbor have the disadvantage of strong shot noise, as well as selection and projection effects. In this sense, radial distance presents a much cleaner measurement. Stacking clusters allows for much better statistics than possible with any individual cluster, and yields the properties of an average cluster. Although the properties of individual clusters can differ significantly from the average cluster properties, even for clusters with similar masses (Moran et al. 2007), this scatter seems to be mostly stochastic in nature: several studies find that there is no systematic trend of varying galaxy populations with cluster mass, at least not for massive clusters (Tanaka et al. 2004; Balogh et al. 2004b; Goto 2005; Finn et al. 2008). There are, however, indications of a dependence on cluster mass at lower masses (, Hansen et al. 2009), as well as at higher redshift (Poggianti et al. 2006).
Clustercentric distance has a second interpretation apart from a local density measure: it also relates to the time since infall into the cluster (Gao et al. 2004). Of the galaxies at or beyond the virial radius, a considerable fraction has not (yet) experienced the dense cluster environment. Galaxies at the cluster core, on the other hand, were either born in a dense environment, or they must have traversed the cluster from the outskirts to the center at least once. The cluster crossing time is of the order of , i.e. 2.5 Gyr, and is independent of cluster mass, since . Therefore, clustercentric distance is also an approximate timescale, and is sensitive to processes occurring on timescales of the order of Gyr. This timescale is particularly interesting for the processes which have been proposed to quench star formation in galaxies entering the cluster environment. Processes which quench star formation on long timescales, such as strangulation or harassment, would induce gradients over the complete radial range. Processes which act on shorter timescales are likely to cause distinctive signatures at the radii where they are most effective - e.g. ram-pressure stripping could be detectable as an increase in the (post-)starburst rate, presumably mostly in the cluster center, where the gas densities are highest. Mergers could induce (post-)starbursts primarily at outer cluster radii, where the relative galaxy velocities allow frequent mergers. (Note that the truncation of star formation induces the same spectral signatures as a true post-starburst galaxy, see Sect. 2.3.)
The dependence of the galaxy population mix on distance from the cluster center has been investigated in numerous studies, with an overall consensus that the fraction of star-forming galaxies declines towards the cluster center, as traced both by galaxy color (e.g. Kodama & Bower 2001; Quintero et al. 2006; Blanton & Berlind 2007; Hansen et al. 2009) and emission-line strength (e.g. Lewis et al. 2002; Gómez et al. 2003; Balogh et al. 2004a; Christlein & Zabludoff 2005). These studies furthermore find that the suppression of star-formation can be traced to . However, as we have motivated above, the properties of star-forming cluster galaxies can provide additional information that goes beyond a simple quantification of the galaxy bimodality in clusters. Studies of e.g. the occurrence of post-starburst galaxies have largely been limited to intermediate-redshift clusters, with the notable exception of Hogg et al. (2006). Hogg et al. showed that in the local universe, post-starburst galaxies are found in the same environments as star-forming galaxies (see also Zabludoff et al. 1996). But they also find a marginal increase in the ratio of post-starburst to star-forming galaxies within the virial radius of clusters.
At intermediate redshifts, the reported results are contradictory. Balogh et al. (1997, 1999) found no enhancement of starburst or post-starburst galaxies in a sample of 15 X-ray-selected clusters at . But in a sample of 10 clusters at slightly higher redshifts, Dressler et al. (1999) and Poggianti et al. (1999) find a marked increase in the occurrence of post-starbursts. Subsequent studies have not been able to resolve these discrepant findings: evidence has been presented for cluster-triggered post-starbursts (Tran et al. 2004; Poggianti et al. 2009) but also for suppression of post-starburst in groups (Yan et al. 2008). Poggianti et al. (2009) show that post-starbursts are found both in rich clusters as well as a in a subset of less massive groups.
1.2 The occurrence of AGN as function of environment
A different viewing angle to the galaxy population mix is the occurrence of Active Galactic Nuclei (AGN). The details of the link between AGN activity and the properties of the host galaxy, particularly its star formation history, are still a matter of debate. But the mere existence of the linear correlation between the mass of the central black hole and the mass of the bulge (e.g. Magorrian et al. 1998) is a strong indication that the formation of the two must be closely linked (e.g. Cattaneo et al. 1999; Heckman et al. 2004). Powerful optical AGN trace current star formation activity, as they are found predominantly in galaxies with massive, but young, bulges (Kauffmann et al. 2003). At least in the local universe, this AGN population correlates well with X-ray selected AGN (Heckman et al. 2005), which are thus also likely linked to ongoing star formation. Weak optical AGN and radio-selected AGN, on the other hand, are found predominantly in massive galaxies with old stellar populations (Kauffmann et al. 2003; Best et al. 2005).
A prerequisite for AGN activity is a mechanism to transport gas to the central black hole. In disk galaxies, this may take place via major or minor mergers, or disk instabilities. Increased AGN activity in cluster galaxies could thus trace the effect of mergers, but possibly also harassment, which also calls for disturbance of the disk.
However, the influence of environment on AGN activity is not yet well established. Large-scale statistical studies of optical AGN have become possible only with the SDSS, but a unanimous picture has not emerged. Kauffmann et al. (2004) showed that galaxies in dense environments are less likely to host a powerful optical AGN (), similar to the suppression of star formation, but find no dependence on environment for weaker optical AGN. A previous study by Miller et al. (2003) found no dependence of optical AGN occurrence on environment, presumably because their sample was dominated by weak AGN. On the other hand, Popesso & Biviano (2006) report a lower fraction of (weak and strong) optical AGN in clusters with velocity dispersions greater than 500 km/s, compared to the field and smaller systems.
In Best et al. (2007), we investigated the occurrence of radio-selected and optical AGN in Brightest Cluster Galaxies (BCGs) compared to non-BCGs of the same stellar mass. We showed that BCGs are more likely to host a radio-loud AGN, but less likely to host a (powerful) optical AGN. We furthermore showed that enhanced radio-loudness occurs also for non-BCGs at the cluster core, whereas optical AGN emission is suppressed over most of the radial range to the virial radius. On the other hand, using a galaxy group sample extending to much lower masses, Pasquali et al. (2009) find that both radio and optical AGN activity are enhanced in central galaxies vs. satellites of equal stellar mass, and that the occurrence of optical AGN is independent of clustercentric radius.
In the local universe, X-ray selected AGNs are rare, and there is little evidence that the fraction of galaxies hosting an X-ray AGN differs systematically from clusters to the field (Martini et al. 2007). There are however suggestions that the AGN fraction is higher in groups and poor clusters compared to richer clusters (Gilmour et al. 2007; Sivakoff et al. 2008). At higher redshifts, there is evidence for a marked increase in the fraction of cluster galaxies which host an X-ray AGN (Eastman et al. 2007; Martini et al. 2009), but also that the AGN fraction is comparable between groups and the field (Georgakakis et al. 2008).
1.3 This work
In this work, we investigate the composition of the cluster galaxy population as a function of clustercentric distance in a sample of 521 clusters at from the SDSS. Sect. 2 presents the cluster and galaxy selection, as well as our diagnostics of the recent star formation history. We use spectroscopic indicators of current and past star formation rate, rather than just broad-band colors. We apply new high signal-to-noise spectral indicators for light-weighted age and excess Balmer line strength (to identify post-starbursts) developed by Wild et al. (2007). Using a diagram of light-weighted age vs. stellar mass, we divide the galaxies into stellar mass-limited subsamples of red (quiescent), green (transition-stage), young, and very young galaxies. In Sect. 3, we present the dependence of several galaxy properties, including nuclear activity, as function of clustercentric radius, and interpret these dependencies in light of the different galaxy transformation mechanisms. We summarize our results and conclusions in Sect. 4.
Unless otherwise noted, we assume a concordance cosmology with , and , where .
2 Data
2.1 Cluster sample
Here we analyze 521 clusters from the sample defined in von der Linden et al. (2007). This cluster sample is derived from the C4 cluster catalog by Miller et al. (2005), but special attention was paid in selecting the Brightest Cluster Galaxy (BCG) as the galaxy to be most likely to be at the center of the cluster potential well. In von der Linden et al. (2007) and Best et al. (2007) we have shown that these galaxies indeed differ systematically from other galaxies. The differences can well be attributed to their special position in the cluster center, and the rich merger history expected for central cluster galaxies. In the absence of X-ray centroids, the position of the BCG has been shown to be a good marker for the center, with a typical offset from the X-ray centroid of 100 kpc (Koester et al. 2007). We are therefore confident that the thus selected BCGs are the best available indicators of the cluster center for these systems. A further deviation from the original C4 catalog was the recalculation of the cluster velocity dispersions.

For the present work, we have further refined the sample from von der Linden et al. (2007) to account for the available data on cluster galaxies and the structure of the cluster. For each cluster, we have determined the SDSS survey coverage from the photometric catalogs (von der Linden 2007), and retain only clusters for which more than 95% of the area within is in the survey area, i.e. is not subject to masks from bright stars, field edges, etc. Furthermore, for each cluster we have determined a light-weighted centroid from galaxies in the photometric catalog, after doing a statistical background subtraction to estimate the likelihood of cluster membership (von der Linden 2007). In the following, we consider only clusters for which the distance between the light centroid and the BCG is less than 400 kpc, and less than . This constraint is placed to ensure that the BCG position is a good tracer of the cluster center, and that therefore the association between distance from the BCG and local density / time since cluster infall rate is valid. Clusters for which this is not the case, i.e. clusters with highly unusual structure, such as double clusters, are excluded from the analysis. These two constraints reduce the sample from 625 to 585 and then to 521 clusters. The redshifts and velocity dispersions of these 521 clusters are shown in Fig. 1.
2.2 Galaxy selection
For the 521 clusters in our sample, we select the galaxies within and , using the SDSS spectroscopic database. We exclude the BCGs from the galaxy sample, as we have shown that they differ systematically from other galaxies (von der Linden et al. 2007; Best et al. 2007). The large radial range allows to probe radial dependences to distances (far) beyond the turn-around radius. If a galaxy could be associated with more than one cluster, we assign it to the “closest” cluster, according to the distance measure , where is the radial distance from the BCG, and the velocity offset. For this association of galaxies with clusters, not only the final 524 clusters are taken into account, but also those in the original C4 catalog. For those clusters that were removed in the BCG selection process, we use the velocity dispersion as given in the original catalog. According to Miller et al. (2005), the C4 cluster catalog is about 90% complete. Hence, our sample of field galaxies should be quite clean from galaxies in undetected clusters. Since the C4 catalog was compiled from DR3, only galaxies contained in DR3 are used for the field sample. Within , these data are supplemented with DR4 data, for which the MPA/JHU value added catalogues111http://www.mpa-garching.mpg.de/SDSS/ were available at the time of writing.
2.3 Spectral indices
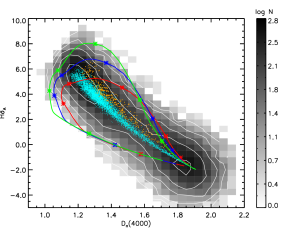
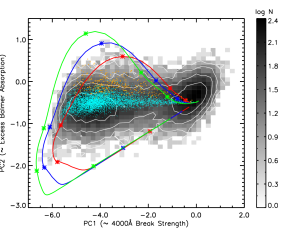
Our main focus in this analysis is the recent star formation history of cluster galaxies. Different spectral features are associated with different timescales of star formation. In this paper we make use of nebular emission lines which indicate star formation rates on timescales of years, the Balmer absorption lines for timescales of Gyr and the 4000Å break strength for longer timescales of a few Gyr. For the latter two indicators, we make use of the spectral indices developed by Wild et al. (2007), which are based on a Principal Component Analysis of the wavelength region 3750-4150Å. The first principal component (PC1) is essentially equivalent to the strength of the 4000Å break, and is thus a measure of the light-weighted mean age of the stellar population. The second principal component (PC2) measures the excess Balmer absorption compared to the expectation value for a given 4000Å break strength (the locus of galaxies with continuous star formation). Traditionally, the Balmer absorption line strength is quantified as the strength of the H line - the great advantage of the new index is that it can be applied to spectra with considerably lower SNR than required for measuring H (Wild et al. 2007).
Fig. 2 illustrates the distribution of a subsample of the SDSS galaxies used in this paper, in PC2 vs. PC1 and the more traditional H vs. Dn(4000) for comparison. On the right hand side of both figures, the red sequence can be seen with large 4000Å break strengths (PC1) from the predominantly old stellar populations. As we move left in both diagrams, the mean light-weighted stellar age decreases, indicated by a decrease in 4000Å break strength, and in this dataset a well defined blue sequence is seen at PC1. To the bottom left of both diagrams we find weak Balmer lines and weak break strengths i.e. starburst galaxies. And above the blue sequence, with strong Balmer absorption lines, we find the “Balmer strong” galaxies, which are often associated with post-starburst galaxies, or galaxies which have suffered a recent truncation in their star formation history. Because PCA identifies lines of correlation in the dataset, and H and Dn(4000) are correlated in galaxy populations, the first component of PCA naturally takes account of this correlation. This causes the twist of the figures relative to each other, and means that PC2 is equivalent to “excess” Balmer absorption over that expected for the 4000Å break strength of the galaxy. Along with the improved SNR of the PCA indicators, this makes the identification of Balmer-strong galaxies easy, as they are displaced upwards in PC2 from the main cloud of points.
To aid interpretation of both diagrams we have overplotted examples of stellar population synthesis models (from Charlot & Bruzual 2009, in prep.), with differing star formation scenarios. The cyan points indicate the position of galaxies composed of the superposition of two components with differing star formation histories: an old “bulge” component, and a young “disk” component. Disk-to-bulge ratios vary between 0 and 1, and the SFR of the disks is allowed to fluctuate on timescales of years which causes the scatter in the distribution compared to standard smoothly exponentially declining SFHs ( models). The purple points are a subset of the cyan points - in these models, star formation has decreased substantially in a short timespan, i.e. has been truncated. Note how these star formation histories can easily be distinguished from the “normal” models by their larger PC2 values. The tracks show a different star formation scenario: the superposition of short starbursts on old stellar populations. Galaxies then move in a clockwise circle, from the red sequence, quickly to the starburst phase, then climb increasingly slowly in PC2 or H into the post-starburst phase, until the burst fades and they reenter the red sequence. As we can see, the indices PC1/PC2 are interesting for investigating the stellar populations of cluster galaxies, since they can test whether cluster galaxies are prone to experience starbursts (e.g. through mergers) or truncation (by ram-pressure stripping) more often than field galaxies.
2.4 PC1 vs. stellar mass
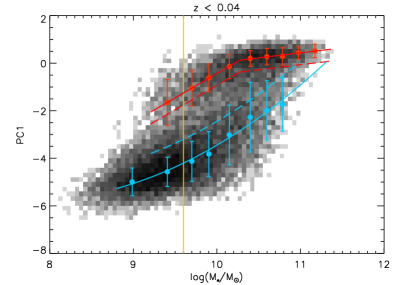
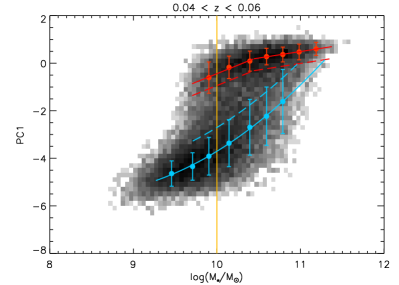
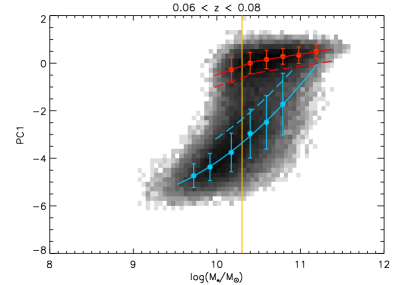
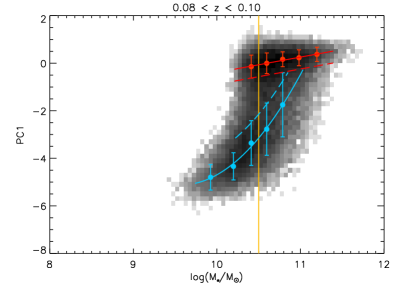
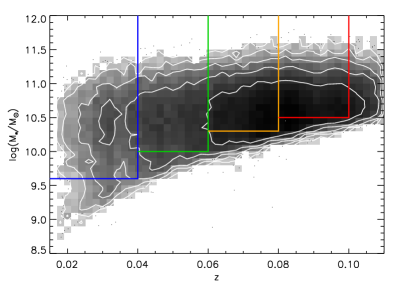
Fig. 3 presents the distribution of the galaxies in our sample in the PC1 vs. stellar mass diagram in four redshift subsamples (see next section). The stellar masses have been determined from the model magnitudes, via the kcorrect_v4.1.4 algorithm (Blanton & Roweis 2007). Both a red sequence (strong 4000Å break, PC1) and a blue sequence (PC1) are clearly visible.
This diagram is analogous to the more traditional color-magnitude diagrams (CMDs), in that both color and PC1 are indicators of the recent star formation history, whereas luminosity and stellar mass measure the “size” of the system. PC1 is a better indicator of the light-weighted age of the stellar population than broad-band colors, because it spans a much shorter range in wavelength, and is thus much less affected by dust extinction. Stellar mass is arguably a more fundamental galaxy property than luminosity, as the latter is highly dependent on the age of the stellar population: young stars are very luminous, hence galaxies with young stellar populations have low ratios. Furthermore, the ratio varies with the observed band: blue bands are particularly dominated by young stars, whereas red bands are sensitive also to older stellar populations. This means effectively that the red and blue sequences are shifted in CMDs of different bands.
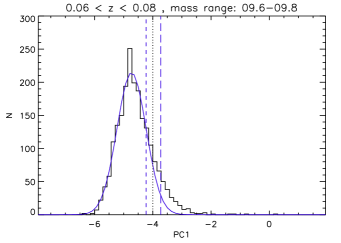
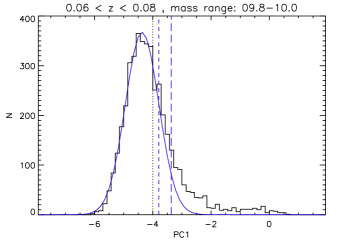
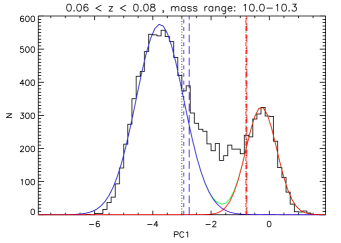
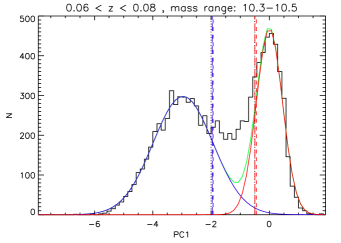
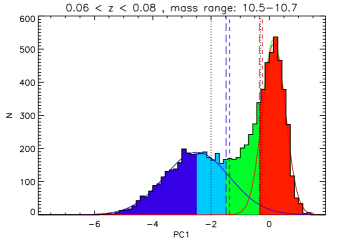
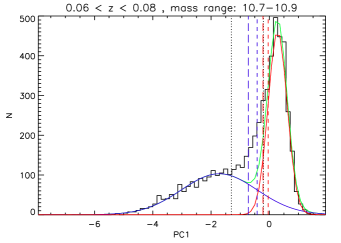
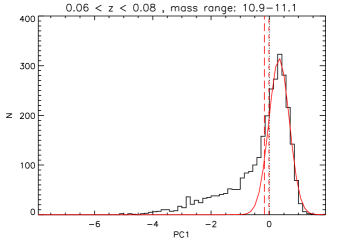
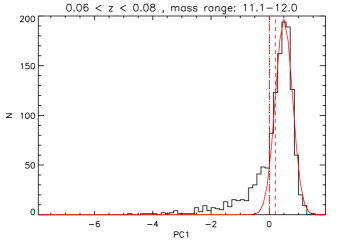
Baldry et al. (2004) fitted bimodal Gaussians to the red and blue sequences in a color-magnitude diagram of a large sample of SDSS galaxies in bins of luminosity. We follow the same approach here and fit the distribution in PC1 in bins of stellar mass, shown in Fig. 4. Clearly, the distributions are not well described by two Gaussians - there is an excess of galaxies between the red and blue peaks. In CMDs, the region between the red and blue sequences has been coined the green valley, and we adopt this term here, as well. We fit two Gaussian curves to the distribution, but ignoring the green valley region for the fit. The fits provide adequate descriptions for the blue edge of the blue sequence and the red edge of the red sequence. However, in the green valley, there is clearly a population of galaxies not accounted for by these two components. The clear separation of the red and blue sequence, and identification of the green valley, illustrates the advantage of using spectroscopic age indicators over broad-band colors, cf. Figs. 3 and 4 of Baldry et al. (2004).
Fig. 3 also indicates the peaks and widths of the red and blue sequences. The ridgeline of the red sequence can be well described by two linear relations (the highest redshift bin does not probe low enough masses, hence only one line is fit), whereas the blue ridge is better described by a parabola. With these fits, we have continuous descriptions of the red and blue sequences with mass: refers to the ridgeline of the red sequence, to that of the blue sequence.
2.5 Galaxy classification
The widths of both the red and blue sequences change with mass, most notably for the blue sequence (Fig. 4). This makes it unsatisfactory to define the extent of each sequence in terms of the widths; e.g. in the higher mass subsets, the green valley region is within of the peak of the blue sequence, simply because the blue sequence is very broad. Instead, we use a fixed offset from each ridge to separate the three regions of the distribution. We define the upper (red) limit of the green valley to be half a unit in PC1 lower than the peak of the red sequence, and the lower (blue) limit to be one unit larger than the peak of the blue sequence. As illustrated in Fig. 3 and Fig. 4, these limits correspond closely to the width of both sequences for most of the mass range considered here. Furthermore, these limits reliably select the excess of green galaxies over the two gaussian fit in those mass bins where it is apparent (Fig. 4). By comparison, the width of the blue sequence fails to do so at large stellar masses. Each galaxy is classified via the following scheme (also illustrated in Fig. 4):
-
1.
If , the galaxy is classified as “red”. These are the quiescent galaxies, in which star formation has ceased Gyr ago.
-
2.
If , the galaxy is classified as “green”, i.e. in the transition regime between young, star-forming and old, quiescent.
-
3.
If , the galaxy is classified as “cyan”. Note that we have divided the young, blue population into two subsets - the “cyan” galaxies have slightly older populations than the “blue” galaxies.
-
4.
If , the galaxy is classified as “blue”. These are the youngest galaxies.
While “green” may actually signify an intermediate class of galaxies between the red and blue sequence, the term “cyan” has been introduced only to ease terminology, and “cyan” should be considered a subclass of blue galaxies in the more general sense. Although PC1 is strictly speaking a measure of the age of the stellar populations, “blue” galaxies generally have higher levels of star formation than “cyan” galaxies.
It is important to make the classification in this order: the red sequence is well defined in all mass bins (above the mass limit), but according to this definition, not every mass bin has a green valley. Extreme cases of this are the highest mass bins, where it is not possible to fit a peak to the blue sequence.
The most important classification for the purpose of this paper is the distinction between old, quiescent (red) galaxies, and young, star-forming galaxies. We have verified that our results do not depend on the precise location of the cut between green and red galaxies. In particular, all our results apply qualitatively also to the red side of the red sequence, i.e. galaxies redder than the red peak.
2.6 Mass completeness
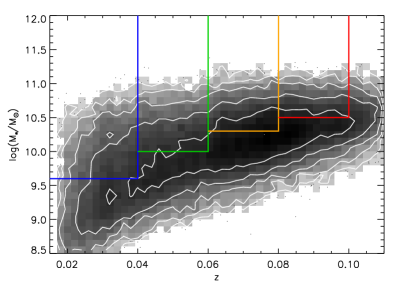
Our aim is to work with a sample of galaxies complete in stellar mass, in order to follow the evolution of galaxies at fixed mass. The galaxies with the highest mass-to-light ratios are those with old stellar populations, i.e. the red galaxies . In Fig. 5 we plot the stellar masses of galaxies on the red sequence as a function of redshift. For the whole sample, the sample is complete in red galaxies only for . But by defining subsamples of clusters (and their galaxies) in redshift bins, the completeness limit can be pushed to lower mass values. We define four such samples: the lowest redshift one () is complete in red galaxies with stellar masses as low as , but it contains only 39 clusters. The sample with (107 clusters) includes red galaxies with . The sample in the range (200 clusters) is complete for , and the highest redshift sample (175 clusters) is complete only for .
Note that we refrain from using a weighting. This is because assumes that galaxies are selected solely because of their apparent magnitude. This is not the case for our cluster galaxies, as also the parent clusters are subject to selection biases. Furthermore, the effect of fiber collisions is not constant with redshift - at higher redshifts, fewer galaxies in denser environments can be targetted.
2.7 Aperture bias
In the PC1 – stellar mass diagram, the red and the blue sequences are not entirely parallel. At low stellar masses, the blue sequence is approximately parallel to the red sequence. But at masses , the blue sequence curves upward towards the red sequence. This is a consequence of the aperture bias inherent to the SDSS survey, which obtains spectra within a diameter. In our lowest redshift sample, corresponds to kpc, and thus only the inner regions of large (resp. massive) galaxies. Many massive disk galaxies also have a bulge component, with a stellar population older than the one in the disk. If only the inner part of the galaxy is observed, then the light of the bulge with its old stellar population is dominant. This is the reason the blue sequence turns “upward” with larger masses: generally, the bulge-to-total fraction increases with stellar mass for disk galaxies. Thus, the more massive the galaxy, the more prominent the bulge, and the older the light-weighted population in the bulge. Note that in galaxy samples based on slit spectroscopy, the red and blue sequences remain parallel and well-separated over all mass ranges (von der Linden 2007).
The aperture bias could thus “contaminate” our sample in cases where the light from the central is not a good estimator of the total population. This would be the case e.g. for typical Sb galaxies, with on old, red bulge, and a young, blue disk. In the three redshift samples at , 98% of the galaxies identified as red from their PC1 values also have a red overall color; in the sample, this number is 90%. Furthermore, only a small fraction (6%) of PC1-red galaxies have a dominant photometric disk component (frac_DeV); of these galaxies, about 30-50% of these are indeed face-on, early-type spiral galaxies. The overall “contamination” of the red sequence galaxies is therefore rather small, and of the order of 2-5%. We are thus confident that although the aperture bias distorts the PC1–mass diagram, our classification scheme is not significantly affected.
The aperture bias further leads to an apparent shift of the location of the blue sequence with redshift, since the bias towards the central, oldest bulge population is largest in the closest galaxies. This is the reason why we need to fit the location of the blue and red sequence in separate redshift bins.
3 Results: radial profiles of the galaxy population
3.1 Mass segregation
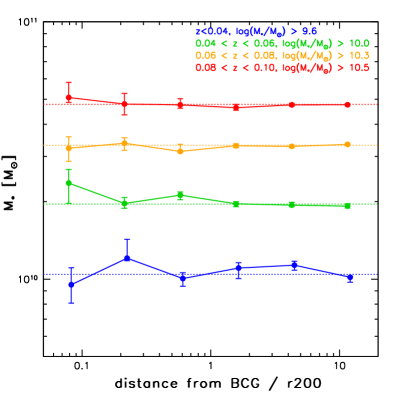
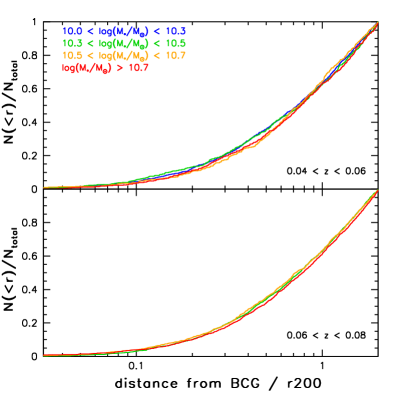
It has been claimed that the dependence of the galaxy population on environment is simply a consequence of a varying galaxy stellar mass function with local density (e.g. Bamford et al. 2009; van den Bosch et al. 2008b). However, other studies based on cluster samples find that any luminosity segregation is solely due to the BCG(s) (Biviano et al. 2002; Pracy et al. 2005). One would expect mass segregation in the clusters, if the dynamical friction timescale is comparable to the cluster crossing time. The more massive galaxies then sink to the center faster than less massive galaxies, thus changing the mass function. In the left panel of Fig. 6, we test for this effect by examining the median mass in the four redshift subsamples. Unlike Bamford et al. (2009) and van den Bosch et al. (2008b), we find that the median mass appears constant with clustercentric radius. But the median as function of radius might be insensitive to changes in the radial distribution, and thus we test for mass segregation also via the cumulative radial distribution of four mass subsamples (right panel of Fig. 6). We do not combine the redshift subsamples in order to avoid any possible bias from fiber collisions. If mass segregation were significant, it should show up as a deficit at small radii for the largest stellar masses. This is clearly not the case - the radial distributions for all mass subsamples are very similar. We thus find no indication of mass segregation in our cluster samples. This likely indicates that the dynamical friction time in our clusters is larger than the characteristic cluster crossing timescale for the majority of our galaxies. From N-body simulations, Boylan-Kolchin et al. (2008) find that in order for the dynamical friction time-scale to be of the order of Gyr, the mass ratio between the satellite and the host halo needs to be large, , and the merger orbit needs to be highly eccentric. For individual galaxies and small groups infalling into the cluster, this is not the case, and the typical dynamical friction timescales are longer, Gyr. The lack of noticeable mass segregation is thus fully consistent with such long dynamical friction timescales.
How can this be reconciled with the results of Bamford et al. (2009) and van den Bosch et al. (2008b)? Bamford et al. do not exclude the BCGs from their study, and their stellar mass trend appears to be in fact largely driven by the BCGs. van den Bosch et al. do exclude the BCGs, but still find a significant trend of average stellar mass with radius. However, they find a strong gradient only for clusters of . For larger halo masses, the gradient is significant only at the level. Almost half of our clusters fall into this largest halo mass bin, and because these clusters are typically richer, they dominate our signal. The remaining discrepancy is thus not large. It is not clear what causes it - the cluster samples differ in many aspects. One possibility is that the discrepancy is caused by the different adaptations of the cluster center: van den Bosch et al. measure the distance to the luminosity-weighted centroid, rather than the distance to the BCG. It is thus natural that they see luminous (and thus massive) galaxies at small radii. But particularly in case they missed the true BCG due to fiber collisions, or in the presence of significant substructure, the luminosity-weighted centroid may differ substantially from the position of our BCG.
3.2 Star formation–radius relation
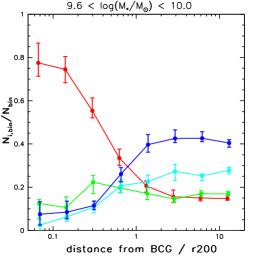
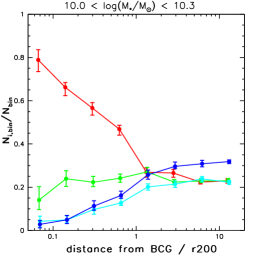
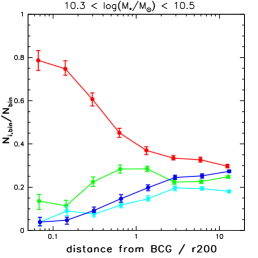
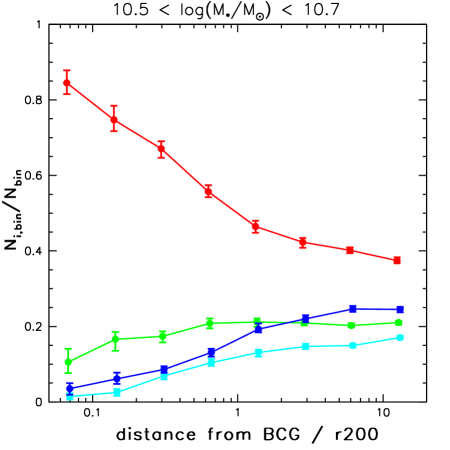
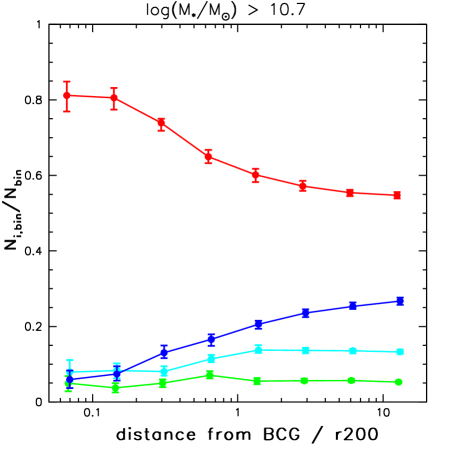
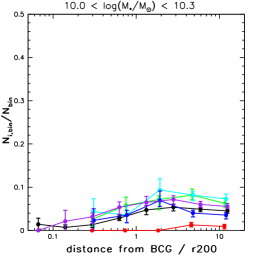
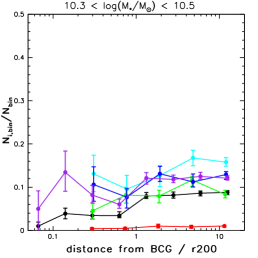
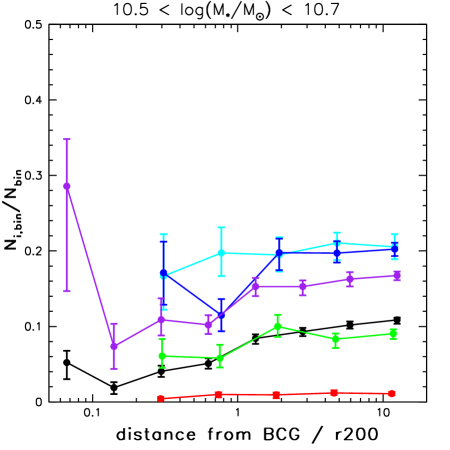
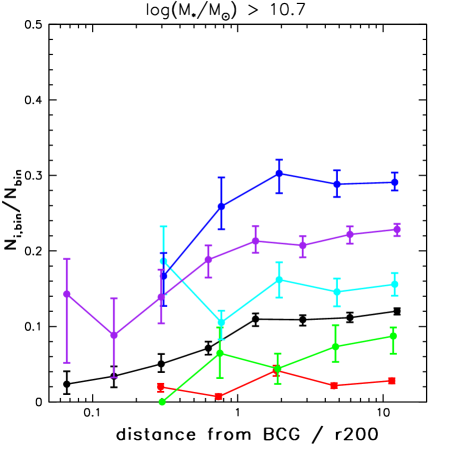
In Fig. 7 we investigate how each galaxy population (red, green, cyan, and blue) contributes to the number of galaxies within bins of mass and of clustercentric distance. For each mass range, we use the maximal number of clusters for which this mass range is complete, i.e. for the lowest mass range, , only the lowest-redshift subsample with is used, for the mass range clusters with are used (cf. Fig. 5). For each mass range, we find a strong color–radius relation: within about , clusters are dominated by red galaxies. In the center, they make up more than 80% of the galaxy population, regardless of mass. The color-radius relation is particularly pronounced for low mass galaxies: in the lowest mass range, less than 20% of the field galaxies are red galaxies. This fraction is approximately constant till the virial radius, where it changes abruptly with a steep increase in the red fraction towards the cluster center. With increasing stellar mass, the red fraction in the field galaxies also increases, but also here, the strongest change is between and .
By construction, the majority of field galaxies which are not red belong to the “blue” class. This is not the case within clusters. Clearly, the “blue” galaxies (i.e. the galaxies with youngest stellar population ages, and highest star formation rates) are most strongly affected by the cluster environment. The fraction of “cyan” galaxies decreases more gradually. The fraction of “green” galaxies, however, is almost constant across all radii. Only in the very cluster center () is it significantly lower than in the field. This is in good agreement with the results of Weinmann et al. (2006), who found that the fraction of “intermediate” galaxies, as classified by color, is independent of environment.
These trends suggest that star formation is affected by a physical process effective already at and beyond. As star formation shuts off, “blue” and “cyan” galaxies redden and move onto the red sequence. This transition apparently does not occur instantaneously, rather, these galaxies are seen as “green valley” objects for a time span somewhat shorter than a cluster crossing time. Hence the fraction of green galaxies decreases slower than the number of blue galaxies, as it is replenished by the latter ones as they redden. Similarly, “blue” galaxies will be first seen as “cyan”, hence the fraction of the latter declines more slowly.
One striking trend with mass is that the transition in the population mix appears more abrupt at low masses, and more gradual at high masses. At low masses, suppression of star formation can traced to , but at high masses, up to . We have verified that this is not simply a consequence of cluster selection effects and the slightly different cluster samples employed for each mass range. One might conjecture that the more abrupt trend seen in the low-mass samples is simply a consequence of a possible higher completeness in selecting smaller galaxy groups at lower redshifts, and thus a purer field sample at low redshifts. The more gradual trend seen at higher stellar mass could then be caused by undetected galaxy groups in filaments around the cluster, which would already quench star formation prior to cluster infall. To test this hypothesis, we compared the star formation – radius relation in a fixed mass bin, , in all four redshift subsamples. The relation is remarkably similar in all four samples, and so we conclude that the qualitative differences in the mass subsamples is not caused by a possible redshift dependence of cluster selection.
It has been suggested that an appreciable fraction of galaxies observed at previously passed through the cluster (e.g. Balogh et al. 2000; Gill et al. 2005; Ludlow et al. 2009). This “backsplash” population should be dominated by low-mass, red galaxies. While we see suppression of star formation beyond , we see no evidence of this mass dependence. In all mass bins, the population at the virial radius and just beyond is very similar to the field. If anything, our data suggests that more massive galaxies are affected to larger distances from the cluster.
The apparent influence of the cluster to distances well beyond may be an indication of “pre-processing” of galaxies in the filaments and in small groups below our detection threshold (e.g. Zabludoff & Mulchaey 1998). With increasing stellar mass, galaxies cluster more strongly (e.g. Li et al. 2006), and are thus more likely to be found in such environments. This provides a natural explanation for the earlier onset of the cluster influence for more massive galaxies.
Finally, the sharp transition from field to cluster serves as evidence that our measured velocity dispersions and cluster centers, both of which required manual adjustments to an automatic process, are in general good representations of their true values.
3.3 Star formation rate
The decrease in the fraction of star-forming galaxies means that when averaging over the whole galaxy population, the star formation rate clearly declines towards the cluster center. We have shown this via the ages of the stellar populations of cluster galaxies, which probe the recent star formation (on timescales Gyr). If star formation indeed declines gradually in cluster galaxies, then also the instantaneous star formation rates in star-forming galaxies should decrease towards the cluster center. Thus, here we investigate the typical star formation rate of those galaxies with young stellar population - the “blue”, “cyan”, and “green” galaxies.
We use the star formation rate measurements of Brinchmann et al. (2004). For consistency we use only galaxies which have been classified as star-forming or low S/N star-forming. The star formation rates for these galaxies are based on emission line model fits to the spectra. The star formation rates of other types of galaxies (AGN, composites, and unclassifiable) have been estimated from D(4000) and are thus representative of the recent star formation history (just as PC1) rather than the instantaneous rate. Note, however, that our results do not change if these galaxies are included. Just as the PCA, the star formation rate measurements are derived only from the central stellar populations covered by the fiber. We show here the fiber star formation rates, but our results are qualitatively similar when using the star formation rates corrected for aperture effects provided by Brinchmann et al. (2004).
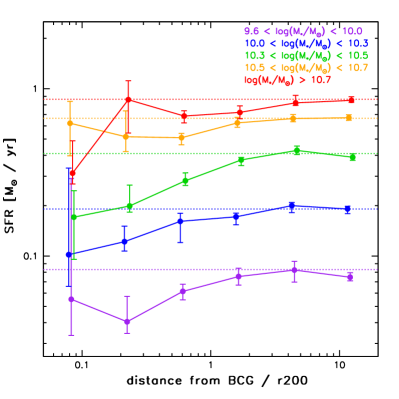
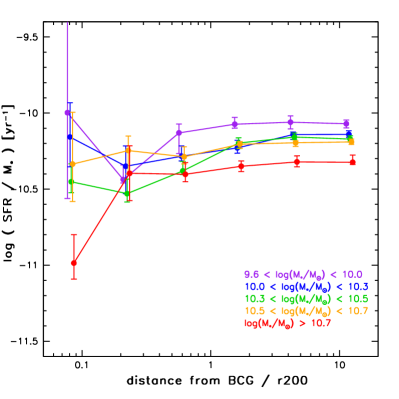
Fig. 8 shows the median star formation rate and the specific star formation rate (i.e. the star formation rate scaled by the galaxy stellar mass) of the star-forming galaxies as function of cluster distance, again in five mass bins. The star formation rate clearly decreases towards the cluster, though not very strongly (less than a factor of 2). This is consistent with the scenario we proposed earlier: as galaxies fall into the cluster, their star formation declines. The subsequent aging of the average stellar population causes the PC1 value of the galaxies to increase - they transition from “blue” via “cyan” and “green” to “red”.
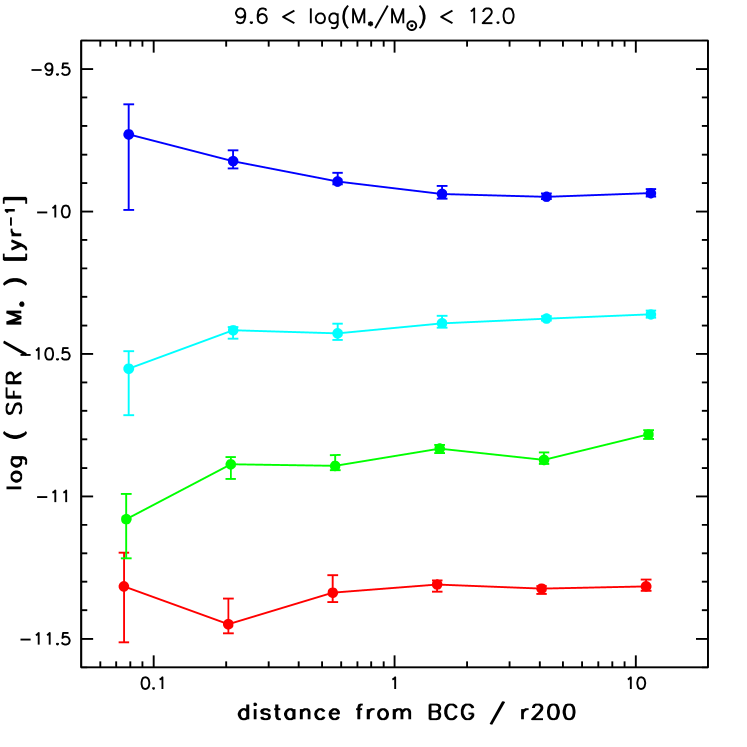
In each subpopulation of star-forming galaxies, however, the star formation rate varies very little with radius (Fig. 9) - it is predominantly the proportions of strongly star-forming (i.e. young, “blue”) galaxies, star-forming(“cyan”), and weakly star-forming / transition (“green”) galaxies which change and cause the decrease in overall star formation rate.
The gradual decline of the typical star formation rate over most of the radial range from the cluster outskirts to the cluster center suggests that the quenching of star formation takes places on timescales similar to the cluster crossing time, i.e. a few Gyr. Indeed, Balogh et al. (2000) modeled the star formation gradients in clusters, assuming that star formation declines on Gyr timescales, and predicted a decline by a factor of about 3, which is similar to what we observe.
Our results differ from those of Balogh et al. (2004a), who investigated star formation rate as a function of environment density in SDSS and 2dFGRS galaxies. While they also found that the fraction of actively star-forming galaxies is a function of density, they did not find a significant difference in the distribution of H equivalent widths (as measure of specific star formation) of star-forming galaxies in different environments. A possible cause for this difference is that their density estimator, the distance to the fifth nearest neighbor, is a more noisy density measurement than clustercentric radius in our composite cluster. Furthermore, a pure local density estimator lacks a clear association with a time-scale since infall into a dense environment, which could be the determining factor.
3.4 Fraction of Balmer-strong galaxies
We have argued that the radial dependence of the central stellar populations of cluster galaxies suggests that star formation is not shut off instantaneously. This hypothesis can be tested via the occurrence of galaxies with excess Balmer absorption line strength. If a galaxy experiences a brief starburst, or if a significant level of star formation is truncated on short timescales (yr), the galaxy spectrum displays strong Balmer absorption lines for Gyr. The PCA measures the excess strength of the Balmer lines with the second Principal Component, PC2 (see Fig. 2). While the PCA is a powerful tool to identify true post-starburst galaxies (Wild et al. 2009), we are in this analysis interested simply in the extremes of the star-forming population. In each redshift and mass bin, we identify the Balmer strong galaxies as the 5% of blue, cyan, or green galaxies with the largest PC2 values. This cut-off generally lies around PC2. Since PC2 is more sensitive to noise in the spectra than PC1, this analysis is carried out only for galaxies with SNR8 spectra (90% of the galaxies). Because of the low number of objects, we split the population only in two mass bins, with the division at the galaxy bimodality demarcation mass, .
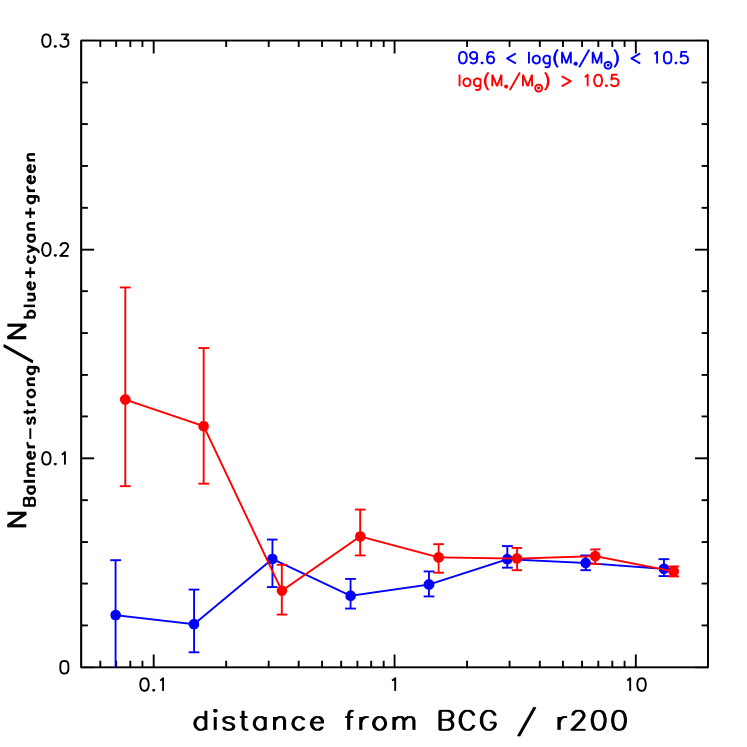
Fig. 10 shows the fraction of Balmer-strong blue, cyan, and green galaxies as function of distance from the cluster center. For low-mass galaxies, the fraction of Balmer-strong galaxies is consistent with being constant with radius. For high-mass galaxies, the data suggest a tantalizing increase in the two innermost bins, at . The signal is robust against variations in the definition of Balmer-strong galaxies, the signal-to-noise criterion, the mass binning, etc. This is exactly the kind of signal one would expect from ram-pressure stripping, and it is tempting to associate it with this. However, the signal is carried by only 11 Balmer-strong galaxies in the first two bins. Furthermore, comparing the properties of the host clusters, these galaxies are found in clusters with similar velocity dispersions and X-ray luminosities as normal star-forming galaxies, whereas the efficiency of ram-pressure should scale with cluster mass (but see Poggianti et al. 2009, for evidence for Balmer-strong galaxies in low-mass groups). Finally, the known galaxies in the process of being ram-pressure stripped tend to be low-mass galaxies, but our data show no peak for low-mass galaxies. The increase in Balmer-strong high-mass galaxies at the core may therefore be a statistical fluke.
Hogg et al. (2006) also found a marginal increase in the number of post-starburst galaxies compared to the number of star-forming galaxies within clusters. They find an excess (compared to the field ratio) over all of the radial range up to , with the largest ratios at the cluster core (), as well as right at . While we cannot confirm the peak at , nor an excess beyond , it is interesting that both studies find a peak excess at the cluster core, though it should be kept in mind that both are only marginal detections.
With the possible exception of the cluster core, we find no strong environmental dependence of the ratio of Balmer-strong galaxies to star-forming galaxies. Since the fraction of star-forming galaxies decreases in the cluster, the absolute fraction of Balmer-strong galaxies also decreases towards the cluster center. This is consistent with the results of Zabludoff et al. (1996) and Hogg et al. (2006), who found that post-starburst galaxies are predominantly field galaxies. In our terminology, this is simply a reflection of the higher field abundances of blue, cyan, and green galaxies.
For low-mass galaxies, which are the dominant population of infalling, star-forming galaxies, the lack of a trend in the occurrence of post-starburst galaxies with cluster environment shows that the physical process(es) which cause a post-starburst signature in the spectrum operate no differently throughout most of the cluster environment than in low-density environments. Since a (moderate) post-starburst signature results not only from a recent star-burst, but also from any rapid truncation of star formation, this indicates that the process(es) which quench star formation in these galaxies operate on longer timescales.
Given that examples of (low-mass) galaxies in the process of being ram-pressure stripped have been observed, why do we not detect such a population statistically? One part of the puzzle is probably that these objects are quite rare, as evidenced by the few objects known. One may speculate that it must take unusual circumstances for a small disk galaxy to travel to the cluster core with its star-forming disk intact. The other part of the puzzle is likely the selection of clusters - our sample contains only few clusters of similar mass to the host clusters of these galaxies, and thus ram-pressure stripping is likely less efficient in our sample.
3.5 Fraction of strong Active Galactic Nuclei
Kauffmann et al. (2003) showed that powerful () narrow-line AGN typically reside in massive galaxies with young stellar populations, i.e. those galaxies which are the exception to the typical mass bimodality. Nuclear activity and star formation must therefore be tightly linked in these galaxies, and AGN could thus provide us with another channel to study environmental influences.
A luminosity of is approximately the demarcation boundary between powerful Seyfert galaxies, and weaker LINERs. Furthermore, above this luminosity, AGN can be reliably identified in SDSS spectra regardless of redshift and star formation rate of the host (Kauffmann et al. 2003).
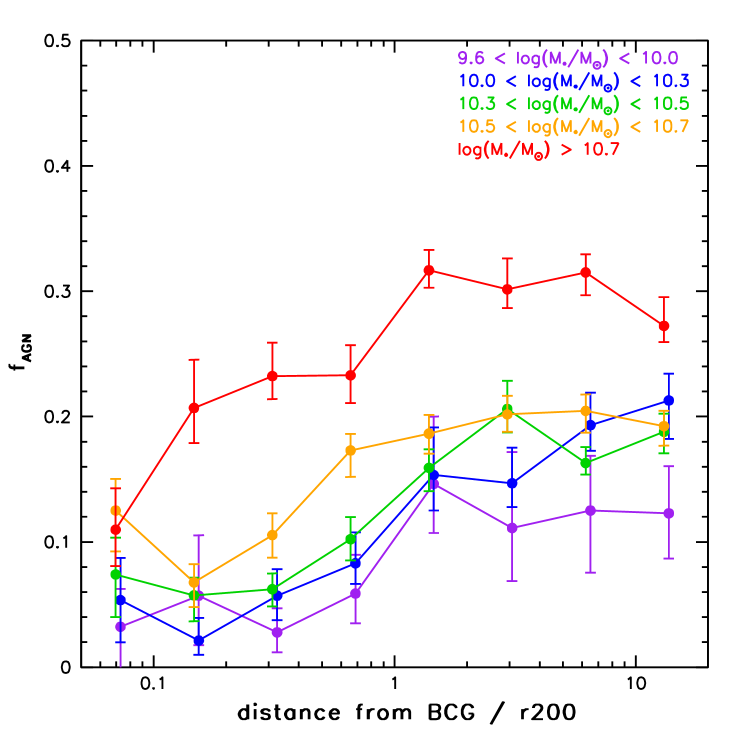
Fig. 11 shows the fractions of galaxies which host a powerful optical AGN with . We see that the overall fraction of strong AGNs decreases towards the cluster center. Within each galaxy class, however, the fraction of strong AGN is consistent with being constant with radius, at least for radii . The decline of the total AGN fraction is then almost exclusively an effect of the increasing number of red galaxies, which host very few strong AGN.
To increase the number statistics in the core of the cluster, we investigate the fraction of strong AGN in blue, cyan, and green galaxies combined (the purple symbols in Fig. 11). We do not find significant evidence for an enhanced fraction of strong AGN even in the cluster core.
Li et al. (2008) and Reichard et al. (2009) showed that kinematical disturbances such as close companions, mergers, and disk lopsidedness trigger star formation at the centers of galaxies. While they also find an increased occurrence of optical AGN, this is entirely accounted for by the existence of the young stellar populations. Also Kauffmann & Heckman (2009) argue that for the powerful AGN hosted by star-forming galaxies, black hole accretion rate is largely independent of processes in the interstellar medium, as long as the central stellar population is young. These studies suggest that the star formation rate at the galaxy center regulates the probability that the central black hole shines as a powerful optical AGN. Our results are consistent with this scenario: our galaxy classification scheme is based on the age of the central stellar population, and thus the AGN fraction within each galaxy class is independent of cluster radius. Due to the suppression of star formation, the overall AGN population is suppressed in the cluster environment, as well. Strictly speaking, this scenario precludes the use of powerful AGN as tracers of environmental processes.
3.6 Fraction of AGN in red galaxies
While the more powerful Seyferts are found almost exclusively in star-forming galaxies, the weaker LINERs are found predominantly in galaxies with old stellar populations (Kauffmann et al. 2003). The star formation rate in our red galaxies is quite low (Fig. 9), so that AGN can be identified to much lower luminosities without contamination from star formation emission lines. Fig. 12 shows that the fraction of optical AGN in red galaxies declines towards the cluster center, by approximately a factor of two between the field and the center. The decline is gradual, and consistent with setting in around .
The relation between these weak AGN and their host galaxy properties is very different from the more powerful optical AGN. Kauffmann & Heckman (2009) showed that for these systems, the rate of accretion onto the black hole is proportional to the bulge mass, with a constant of proportionality that depends on the age of the bulge stellar population. A likely explanation for this result is that the AGN is fuelled by mass loss from evolved stars. Dn(4000) and PC1 are largely insensitive to stellar populations of Gyr, and thus our class of red galaxies is far from a homogeneous population. It is therefore plausible (and indeed expected, see De Lucia & Blaizot 2007) that the mean age of the red galaxies increases towards the cluster center, and provides less fuel for the central black hole.
There is furthermore evidence that the (weak) AGN activity in galaxies with old central stellar populations may be sensitive to processes in the outer galaxy regions. Kauffmann et al. (2007) find that galaxies with an old central stellar population which host an optical AGN span a wide range in UV-optical color. In contrast, galaxies with old central populations, but no AGN emission, almost all have red UV-optical colors. They interpret the UV emission as residual small levels of star formation in an outer disk, traceable only via ultraviolet radiation. These star-forming outer disks presumably trace a (low-mass) reservoir of cold gas, which is available to fuel star formation and AGN activity.222Note, however, that this is not a linear relation. Galaxies with UV-blue outer disks span a wide range in central star formation rate, age of the central stellar population, and black hole accretion rate. Given that we find that fewer red cluster galaxies host an AGN, we expect that the fraction of red galaxies with a UV-bright outer disk also decreases in the cluster. Just as star formation in young galaxies is suppressed upon infall into the cluster environment, also this “hidden”, residual star formation in otherwise old galaxies is quenched, presumably because potential fuel is removed from the outer regions.
4 Summary and discussion
Our results can be summarized as follows:
-
•
The median mass of cluster galaxies other than the BCG does not vary with cluster radius. Environmental differences in the galaxy population are therefore not solely a result of a varying stellar mass function.
-
•
There is a pronounced relation between distance from the cluster center and the composition of the galaxy population. In the cluster center, star formation has ceased in 80% of the cluster galaxies, regardless of stellar mass. The fraction of the youngest (“blue”) stellar populations declines most rapidly towards the cluster center, less rapidly for slightly older (“cyan”) stellar populations, and is almost constant for the transition “green valley” galaxies.
-
•
The star formation rates of galaxies which are not on the red sequence declines by about a factor of two from the field to the cluster center.
-
•
The fraction of “blue”, “cyan”, and “green” galaxies which have excess Balmer absorption line strength, indicative of a post-starburst or truncation of star formation, is independent of cluster radius at least for . There is a marginally significant increase of Balmer-strong galaxies within for galaxy masses .
-
•
The fraction of star-forming and transition galaxies which host a powerful optical AGN () is independent of cluster radius.
-
•
The fraction of quiescent (red) galaxies which host a (weak) optical AGN decreases towards the cluster center.
Our results indicate that the star formation rate of galaxies infalling into clusters decreases gradually over a timescale similar to the cluster crossing time, i.e. a few Gyr. E.g. a simple approximately exponential decline of the star formation rate suffices to explain the declining fraction of very young (i.e. strongly star-forming) in the cluster. These “blue” galaxies would then be seen as star-forming, “cyan” galaxies and later as transition,“green” galaxies, which naturally explains the slower decline of these two types.
Remarkably, the properties of star-forming and transition galaxies, at fixed stellar mass and fixed light-weighted age, are largely independent of clustercentric radius. The star formation rate in each of these classes is nearly constant, as well as the fraction of galaxies which host a post-starburst galaxy or a strong optical AGN. This argues against more violent processes than the mere fading of star formation being a dominant effect: truncation of star formation due to e.g. ram-pressure stripping would lead to an increase of Balmer-strong galaxies, whereas mergers and kinematic instabilities (caused e.g. by harassment) would lead to an increase of starburst galaxies and Balmer-strong galaxies, and possibly AGN activity. There is no evidence of any of these over the radial range we can probe, apart from a marginally significant excess of Balmer-strong galaxies the cluster core.
We therefore come to the conclusion that a simple gradual decline of star formation suffices to explain our results, and that other, more abrupt, processes cannot play a major role at cluster radii beyond a tenth of the virial radius, at least not in the moderately massive clusters we probe here.
Our data alone can only approximate the timescale on which star formation is quenched in clusters - it must be of the order of the cluster crossing time, a few Gyr. In Weinmann et al., in prep. we will compare a similar dataset to semi-analytical models in order to investigate the timescale more precisely.
Acknowledgments
Funding for the Sloan Digital Sky Survey (SDSS) has been provided by the Alfred P. Sloan Foundation, the Participating Institutions, the National Aeronautics and Space Administration, the National Science Foundation, the U.S. Department of Energy, the Japanese Monbukagakusho, and the Max Planck Society. The SDSS Web site is http://www.sdss.org/.
The SDSS is managed by the Astrophysical Research Consortium (ARC) for the Participating Institutions. The Participating Institutions are The University of Chicago, Fermilab, the Institute for Advanced Study, the Japan Participation Group, The Johns Hopkins University, the Korean Scientist Group, Los Alamos National Laboratory, the Max-Planck-Institute for Astronomy (MPIA), the Max-Planck-Institute for Astrophysics (MPA), New Mexico State University, University of Pittsburgh, University of Portsmouth, Princeton University, the United States Naval Observatory, and the University of Washington.
References
- Baldry et al. (2004) Baldry, I. K., Glazebrook, K., Brinkmann, J., Ivezić, Ž., Lupton, R. H., Nichol, R. C., & Szalay, A. S. 2004, ApJ, 600, 681
- Balogh et al. (2004a) Balogh, M., et al. 2004a, MNRAS, 348, 1355
- Balogh et al. (2004b) Balogh, M. L., Baldry, I. K., Nichol, R., Miller, C., Bower, R., & Glazebrook, K. 2004b, ApJ, 615, L101
- Balogh et al. (1997) Balogh, M. L., Morris, S. L., Yee, H. K. C., Carlberg, R. G., & Ellingson, E. 1997, ApJ, 488, L75+
- Balogh et al. (1999) Balogh, M. L., Morris, S. L., Yee, H. K. C., Carlberg, R. G., & Ellingson, E. 1999, ApJ, 527, 54
- Balogh et al. (2000) Balogh, M. L., Navarro, J. F., & Morris, S. L. 2000, ApJ, 540, 113
- Bamford et al. (2009) Bamford, S. P., et al. 2009, MNRAS, 393, 1324
- Barnes & Hernquist (1992) Barnes, J. E. & Hernquist, L. 1992, ARA&A, 30, 705
- Barnes & Hernquist (1996) Barnes, J. E. & Hernquist, L. 1996, ApJ, 471, 115
- Bekki et al. (2002) Bekki, K., Couch, W. J., & Shioya, Y. 2002, ApJ, 577, 651
- Best et al. (2005) Best, P. N., Kauffmann, G., Heckman, T. M., Brinchmann, J., Charlot, S., Ivezić, Ž., & White, S. D. M. 2005, MNRAS, 362, 25
- Best et al. (2007) Best, P. N., von der Linden, A., Kauffmann, G., Heckman, T. M., & Kaiser, C. R. 2007, MNRAS, 379, 894
- Biviano et al. (2002) Biviano, A., Katgert, P., Thomas, T., & Adami, C. 2002, A&A, 387, 8
- Blanton & Berlind (2007) Blanton, M. R. & Berlind, A. A. 2007, ApJ, 664, 791
- Blanton et al. (2005) Blanton, M. R., Eisenstein, D., Hogg, D. W., Schlegel, D. J., & Brinkmann, J. 2005, ApJ, 629, 143
- Blanton & Roweis (2007) Blanton, M. R. & Roweis, S. 2007, AJ, 133, 734
- Boylan-Kolchin et al. (2008) Boylan-Kolchin, M., Ma, C.-P., & Quataert, E. 2008, MNRAS, 383, 93
- Brinchmann et al. (2004) Brinchmann, J., Charlot, S., White, S. D. M., Tremonti, C., Kauffmann, G., Heckman, T., & Brinkmann, J. 2004, MNRAS, 351, 1151
- Cattaneo et al. (1999) Cattaneo, A., Haehnelt, M. G., & Rees, M. J. 1999, MNRAS, 308, 77
- Cayatte et al. (1990) Cayatte, V., van Gorkom, J. H., Balkowski, C., & Kotanyi, C. 1990, AJ, 100, 604
- Christlein & Zabludoff (2005) Christlein, D. & Zabludoff, A. I. 2005, ApJ, 621, 201
- Chung et al. (2007) Chung, A., van Gorkom, J. H., Kenney, J. D. P., & Vollmer, B. 2007, ApJ, 659, L115
- Cortese et al. (2007) Cortese, L., et al. 2007, MNRAS, 376, 157
- Cox et al. (2006) Cox, T. J., Dutta, S. N., Di Matteo, T., Hernquist, L., Hopkins, P. F., Robertson, B., & Springel, V. 2006, ApJ, 650, 791
- De Lucia & Blaizot (2007) De Lucia, G. & Blaizot, J. 2007, MNRAS, 375, 2
- Dressler (1980) Dressler, A. 1980, ApJ, 236, 351
- Dressler et al. (1999) Dressler, A., Smail, I., Poggianti, B. M., Butcher, H., Couch, W. J., Ellis, R. S., & Oemler, A. J. 1999, ApJS, 122, 51
- Eastman et al. (2007) Eastman, J., Martini, P., Sivakoff, G., Kelson, D. D., Mulchaey, J. S., & Tran, K.-V. 2007, ApJ, 664, L9
- Farouki & Shapiro (1980) Farouki, R. & Shapiro, S. L. 1980, ApJ, 241, 928
- Farouki & Shapiro (1982) Farouki, R. T. & Shapiro, S. L. 1982, ApJ, 259, 103
- Finn et al. (2008) Finn, R. A., Balogh, M. L., Zaritsky, D., Miller, C. J., & Nichol, R. C. 2008, ApJ, 679, 279
- Gao et al. (2004) Gao, L., White, S. D. M., Jenkins, A., Stoehr, F., & Springel, V. 2004, MNRAS, 355, 819
- Gavazzi et al. (2001) Gavazzi, G., Boselli, A., Mayer, L., Iglesias-Paramo, J., Vilchez, J. M., & Carrasco, L. 2001, ApJ, 563, L23
- Georgakakis et al. (2008) Georgakakis, A., Gerke, B. F., Nandra, K., Laird, E. S., Coil, A. L., Cooper, M. C., & Newman, J. A. 2008, MNRAS, 391, 183
- Gill et al. (2005) Gill, S. P. D., Knebe, A., & Gibson, B. K. 2005, MNRAS, 356, 1327
- Gilmour et al. (2007) Gilmour, R., Gray, M. E., Almaini, O., Best, P., Wolf, C., Meisenheimer, K., Papovich, C., & Bell, E. 2007, MNRAS, 380, 1467
- Gnedin (2003) Gnedin, O. Y. 2003, ApJ, 582, 141
- Gómez et al. (2003) Gómez, P. L., et al. 2003, ApJ, 584, 210
- Goto (2005) Goto, T. 2005, MNRAS, 356, L6
- Gunn & Gott (1972) Gunn, J. E. & Gott, J. R. I. 1972, ApJ, 176, 1
- Hansen et al. (2009) Hansen, S. M., Sheldon, E. S., Wechsler, R. H., & Koester, B. P. 2009, ApJ, 699, 1333
- Heckman et al. (2004) Heckman, T. M., Kauffmann, G., Brinchmann, J., Charlot, S., Tremonti, C., & White, S. D. M. 2004, ApJ, 613, 109
- Heckman et al. (2005) Heckman, T. M., Ptak, A., Hornschemeier, A., & Kauffmann, G. 2005, ApJ, 634, 161
- Hogg et al. (2006) Hogg, D. W., Masjedi, M., Berlind, A. A., Blanton, M. R., Quintero, A. D., & Brinkmann, J. 2006, ApJ, 650, 763
- Hubble (1936) Hubble, E. P. 1936, Realm of the Nebulae
- Kauffmann & Heckman (2009) Kauffmann, G. & Heckman, T. M. 2009, MNRAS, 842
- Kauffmann et al. (2007) Kauffmann, G., et al. 2007, ApJS, 173, 357
- Kauffmann et al. (2003) Kauffmann, G., et al. 2003, MNRAS, 346, 1055
- Kauffmann et al. (2004) Kauffmann, G., White, S. D. M., Heckman, T. M., Ménard, B., Brinchmann, J., Charlot, S., Tremonti, C., & Brinkmann, J. 2004, MNRAS, 353, 713
- Kenney et al. (2004) Kenney, J. D. P., van Gorkom, J. H., & Vollmer, B. 2004, AJ, 127, 3361
- Kodama & Bower (2001) Kodama, T. & Bower, R. G. 2001, MNRAS, 321, 18
- Koester et al. (2007) Koester, B. P., et al. 2007, ApJ, 660, 239
- Larson et al. (1980) Larson, R. B., Tinsley, B. M., & Caldwell, C. N. 1980, ApJ, 237, 692
- Lewis et al. (2002) Lewis, I., et al. 2002, MNRAS, 334, 673
- Li et al. (2008) Li, C., Kauffmann, G., Heckman, T. M., White, S. D. M., & Jing, Y. P. 2008, MNRAS, 385, 1915
- Li et al. (2006) Li, C., Kauffmann, G., Jing, Y. P., White, S. D. M., Börner, G., & Cheng, F. Z. 2006, MNRAS, 368, 21
- Ludlow et al. (2009) Ludlow, A. D., Navarro, J. F., Springel, V., Jenkins, A., Frenk, C. S., & Helmi, A. 2009, ApJ, 692, 931
- Magorrian et al. (1998) Magorrian, J., et al. 1998, AJ, 115, 2285
- Martini et al. (2007) Martini, P., Mulchaey, J. S., & Kelson, D. D. 2007, ApJ, 664, 761
- Martini et al. (2009) Martini, P., Sivakoff, G. R., & Mulchaey, J. S. 2009, ApJ, 701, 66
- Miller et al. (2003) Miller, C. J., Nichol, R. C., Gómez, P. L., Hopkins, A. M., & Bernardi, M. 2003, ApJ, 597, 142
- Miller et al. (2005) Miller, C. J., et al. 2005, AJ, 130, 968
- Moore et al. (1998) Moore, B., Lake, G., & Katz, N. 1998, ApJ, 495, 139
- Moran et al. (2007) Moran, S. M., Ellis, R. S., Treu, T., Smith, G. P., Rich, R. M., & Smail, I. 2007, ArXiv e-prints 0707.4173, 707
- Naab & Burkert (2003) Naab, T. & Burkert, A. 2003, ApJ, 597, 893
- Negroponte & White (1983) Negroponte, J. & White, S. D. M. 1983, MNRAS, 205, 1009
- Pasquali et al. (2009) Pasquali, A., van den Bosch, F. C., Mo, H. J., Yang, X., & Somerville, R. 2009, MNRAS, 394, 38
- Poggianti et al. (2009) Poggianti, B. M., et al. 2009, ApJ, 693, 112
- Poggianti et al. (1999) Poggianti, B. M., Smail, I., Dressler, A., Couch, W. J., Barger, A. J., Butcher, H., Ellis, R. S., & Oemler, A. J. 1999, ApJ, 518, 576
- Poggianti et al. (2006) Poggianti, B. M., et al. 2006, ApJ, 642, 188
- Popesso & Biviano (2006) Popesso, P. & Biviano, A. 2006, A&A, 460, L23
- Pracy et al. (2005) Pracy, M. B., Driver, S. P., De Propris, R., Couch, W. J., & Nulsen, P. E. J. 2005, MNRAS, 364, 1147
- Quilis et al. (2000) Quilis, V., Moore, B., & Bower, R. 2000, Science, 288, 1617
- Quintero et al. (2006) Quintero, A. D., Berlind, A. A., Blanton, M., & Hogg, D. W. 2006, Submitted to ApJ, astro-ph/0611361
- Reichard et al. (2009) Reichard, T. A., Heckman, T. M., Rudnick, G., Brinchmann, J., Kauffmann, G., & Wild, V. 2009, ApJ, 691, 1005
- Sivakoff et al. (2008) Sivakoff, G. R., Martini, P., Zabludoff, A. I., Kelson, D. D., & Mulchaey, J. S. 2008, ApJ, 682, 803
- Sun et al. (2007) Sun, M., Donahue, M., & Voit, G. M. 2007, ApJ, 671, 190
- Sun & Vikhlinin (2005) Sun, M. & Vikhlinin, A. 2005, ApJ, 621, 718
- Tanaka et al. (2004) Tanaka, M., Goto, T., Okamura, S., Shimasaku, K., & Brinkmann, J. 2004, AJ, 128, 2677
- Toomre (1977) Toomre, A. 1977, in Evolution of Galaxies and Stellar Populations, ed. B. M. Tinsley & R. B. Larson, 401–+
- Tran et al. (2004) Tran, K.-V. H., Franx, M., Illingworth, G. D., van Dokkum, P., Kelson, D. D., & Magee, D. 2004, ApJ, 609, 683
- van den Bosch et al. (2008a) van den Bosch, F. C., Aquino, D., Yang, X., Mo, H. J., Pasquali, A., McIntosh, D. H., Weinmann, S. M., & Kang, X. 2008a, MNRAS, 387, 79
- van den Bosch et al. (2008b) van den Bosch, F. C., Pasquali, A., Yang, X., Mo, H. J., Weinmann, S., McIntosh, D. H., & Aquino, D. 2008b, ArXiv e-prints
- von der Linden (2007) von der Linden, A. 2007, PhD thesis, LMU München
- von der Linden et al. (2007) von der Linden, A., Best, P. N., Kauffmann, G., & White, S. D. M. 2007, MNRAS, 379, 867
- Weinmann et al. (2009) Weinmann, S. M., Kauffmann, G., van den Bosch, F. C., Pasquali, A., McIntosh, D. H., Mo, H., Yang, X., & Guo, Y. 2009, MNRAS, 394, 1213
- Weinmann et al. (2006) Weinmann, S. M., van den Bosch, F. C., Yang, X., & Mo, H. J. 2006, MNRAS, 366, 2
- Wild et al. (2007) Wild, V., Kauffmann, G., Heckman, T., Charlot, S., Lemson, G., Brinchmann, J., Reichard, T., & Pasquali, A. 2007, MNRAS, 381, 543
- Wild et al. (2009) Wild, V., Walcher, C. J., Johansson, P. H., Tresse, L., Charlot, S., Pollo, A., Le Fèvre, O., & de Ravel, L. 2009, MNRAS, 395, 144
- Yan et al. (2008) Yan, R., et al. 2008, ArXiv e-prints
- Zabludoff & Mulchaey (1998) Zabludoff, A. I. & Mulchaey, J. S. 1998, ApJ, 496, 39
- Zabludoff et al. (1996) Zabludoff, A. I., Zaritsky, D., Lin, H., Tucker, D., Hashimoto, Y., Shectman, S. A., Oemler, A., & Kirshner, R. P. 1996, ApJ, 466, 104