The role of active galactic nuclei in galaxy formation
Abstract
We use Monte-Carlo Markov chain techniques to constrain acceptable parameter regions for the Munich L-Galaxies semi-analytic galaxy formation model. Feedback from active galactic nuclei (AGN) is required to limit star-formation in the most massive galaxies. However, we show that the introduction of tidal stripping of dwarf galaxies as they fall into and merge with their host systems can lead to a reduction in the required degree of AGN feedback. In addition, the new model correctly reproduces both the metallicity of large galaxies and the fraction of intracluster light.
Keywords:
galaxies: active - galaxies: formation - galaxies: interactions:
98.54-h;98.62.Ai;98.65.Fz1 Introduction
This paper describes the implementation of a model for dwarf galaxy disruption within the semi-analytic framework of De Lucia and Blaizot (2007, hereafter DLB07). The original model was suggested by Henriques et al. (2008) as a way of both reducing the excess of dwarf galaxies and creating the intracluster light (ICL); however this was implemented a posteriori, acting only to reduce the dwarf population at the current day. The new model follows the stripping of dwarfs as they fall into the halos of their parent galaxy, thus gradually reducing their mass: affecting their infall rates, increasing the time-scale for, and decreasing the magnitude of, the merger with the central object.
For the purposes of these conference proceedings, the most important result is that the masses of the black holes are reduced, with a corresponding reduction in the level of feedback of AGN energy into the interstellar medium. This should be read in conjunction with the paper by Chris Short in this volume that investigates the degree to which the accretion energy is needed to provide feedback into the intracluster medium (ICM) in order to provide the observed entropy excess in clusters.
2 Method
Any semi-analytic model has a large number of parameters whose values need to be optimized. These are not all independent and correlations between them can give insight into the key physical processes that are constrained by the observations. DLB07 has 12 explicit parameters (as well as lots of hidden ones). We fix all but 6 parameters in our analysis:
-
•
the star formation efficiency,
-
•
the AGN radio mode efficiency,
-
•
the black hole growth efficiency,
-
•
the supernova reheating and ejection efficiency, respectively and
-
•
the ejected gas reincorporation efficiency,
In Henriques et al. (2009, hereafter Paper 1) we introduced a Monte-Carlo Markov Chain (MCMC) method for mapping out allowable likelihood regions in parameter space and used it to find the best-fitting values for the above parameters, using as constraints the -band luminosity function, the colours, and the black hole-bulge mass ratio. Subsequently we have introduced a self-consistent stripping model for the dwarfs (Henriques and Thomas, 2009, hereafter Paper 2). We summarise some of the results from that paper below.
We build our model on merger trees derived from the Millennium Simulation (Springel et al., 2005), using a small but representative subset of the total volume for our MCMC analysis. However, the results presented below come from applying the best-fit model to the entire simulation.
3 Results
The best fit and confidence limits for the 6 free parameters in the model with satellite disruption, together with the published values from DLB07 and the best fit for the model without satellite disruption are shown in Table 1. The most significant thing to note is that, in the disruption model, the star-formation rate is much enhanced and the rate of re-incorporation of expelled gas is reduced. This results in a much lower fraction of cold gas in the interstellar medium and consequently a lower accretion rate onto the central black hole. Thus the black hole masses are smaller in the disruption model, in better agreement with observations, and the feedback rates from AGN are reduced.
| DLB07 | Paper 1 | Paper 2 | +1 | +2 | |||
|---|---|---|---|---|---|---|---|
| 0.03 | 0.039 | 0.17 | 0.078 | 0.13 | 0.28 | 0.53 | |
| 0.03 | 0.032 | 0.047 | 0.030 | 0.041 | 0.061 | 0.075 | |
| 3.5 | 10.28 | 6.86 | 5.22 | 6.33 | 8.51 | 10.11 | |
| 0.35 | 0.53 | 0.33 | 0.26 | 0.31 | 0.40 | 0.46 | |
| 0.5 | 0.42 | 0.13 | 0.076 | 0.12 | 0.24 | 0.30 |
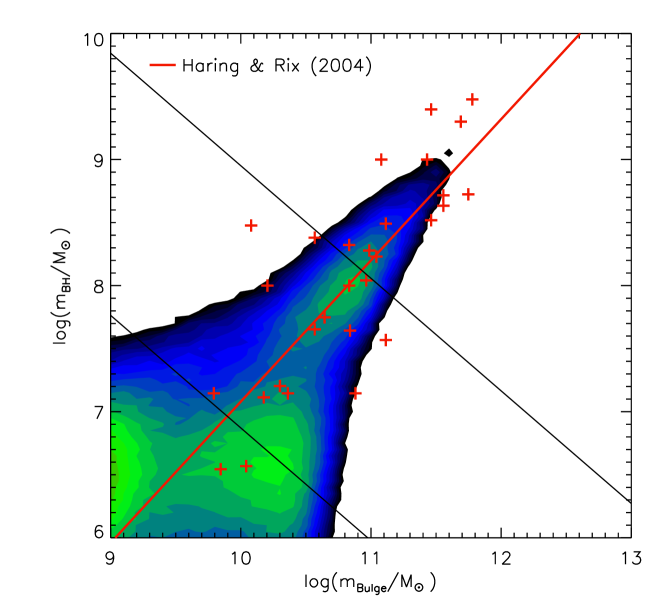
Figure 1 shows a comparison of the model black-hole/bulge mass relation (contours) with observations (crosses). Although the observations are biased to high-mass systems, the distribution of systems above and below the best-fit line are correct.
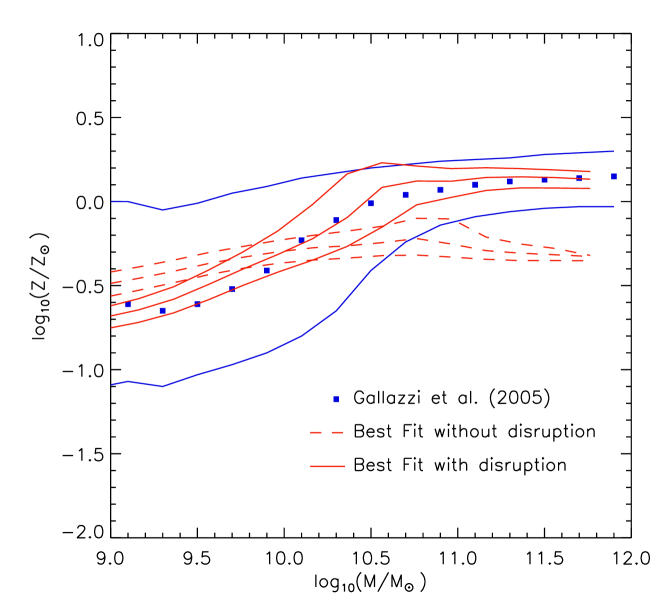
Although not used to constrain the model, it is gratifying that it produces the correct amount of ICL (see Figure 9 of Paper 2). In addition, as shown in Figure 2, it provides a much better match to the metallicity distribution of massive galaxies than the original model (in which massive galaxies accrete too many low-metallicy stars during mergers of dwarf satellites.)
4 Discussion
The black hole growth model presented here provides a real challenge for models that require AGN heating to raise the entropy of the ICM. Even using the original DLB07 model, with its higher black hole masses, 35 per cent of the available rest mass energy is required (see article by Chris Short in this volume, also Short and Thomas (2009)). Similar conclusions have been reached by Bower et al. (2008) using the Durham GALFORM semi-analytic model.
References
- De Lucia and Blaizot (2007) G. De Lucia, and J. Blaizot, MNRAS 375, 2–14 (2007).
- Henriques et al. (2008) B. M. Henriques, S. Bertone, and P. A. Thomas, MNRAS 383, 1649–1654 (2008).
- Henriques et al. (2009) B. M. B. Henriques, P. A. Thomas, S. Oliver, and I. Roseboom, MNRAS 396, 535–547 (2009).
- Henriques and Thomas (2009) B. M. B. Henriques, and P. A. Thomas, ArXiv e-prints (2009), 0909.2150.
- Springel et al. (2005) V. Springel, S. D. M. White, A. Jenkins, C. S. Frenk, N. Yoshida, L. Gao, J. Navarro, R. Thacker, D. Croton, J. Helly, J. A. Peacock, S. Cole, P. Thomas, H. Couchman, A. Evrard, J. Colberg, and F. Pearce, Nature 435, 629–636 (2005).
- Häring and Rix (2004) N. Häring, and H.-W. Rix, ApJL 604, L89–L92 (2004).
- Gallazzi et al. (2005) A. Gallazzi, S. Charlot, J. Brinchmann, S. D. M. White, and C. A. Tremonti, MNRAS 362, 41–58 (2005).
- Short and Thomas (2009) C. J. Short, and P. A. Thomas, ApJ 704, 915–929 (2009).
- Bower et al. (2008) R. G. Bower, I. G. McCarthy, and A. J. Benson, MNRAS 390, 1399–1410 (2008).