XID II: Statistical Cross-Association of ROSAT Bright Source Catalog X-ray Sources with 2MASS Point Source Catalog Near-Infrared Sources
Abstract
The 18806 ROSAT All Sky Survey Bright Source Catalog (RASS/BSC) X-ray sources are quantitatively cross-associated with near-infrared (NIR) sources from the Two Micron All Sky Survey Point Source Catalog (2MASS/PSC). An association catalog is presented, listing the most likely counterpart for each RASS/BSC source, the probability that the NIR source and X-ray source are uniquely associated, and the probability that none of the 2MASS/PSC sources are associated with the X-ray source. The catalog includes 3853 high quality () X-ray–NIR matches, 2280 medium quality () matches, and 4153 low quality () matches. Of the high quality matches, 1418 are associations that are not listed in the SIMBAD database, and for which no high quality match with a USNO-A2 optical source was presented for the RASS/BSC source in previous work. The present work offers a significant number of new associations with RASS/BSC objects that will require optical/NIR spectroscopy for classification. For example, of the 6133 2MASS/PSC counterparts presented in the association catalog, 2411 have no classification listed in the SIMBAD database. These 2MASS/PSC sources will likely include scientifically useful examples of known source classes of X-ray emitters (white dwarfs, coronally active stars, active galactic nuclei), but may also contain previously unknown source classes. It is determined that all coronally active stars in the RASS/BSC should have a counterpart in the 2MASS/PSC, and that the unique association of these RASS/BSC sources with their NIR counterparts thus is confusion limited.
1 INTRODUCTION
The ROSAT All Sky Survey Bright Source Catalog (RASS/BSC; Voges et al., 1999) contains flux and positional information for 18806 X-ray sources111The reference (Voges et al., 1999) refers to 18811 sources, but 5 duplicates were removed in the most recent version of the catalog. See ftp://ftp.xray.mpe.mpg.de/rosat/catalogues/rass-bsc/1.3_vs_1.4.diff for details (accessed 2009 May 5)., down to a limiting 0.1–2.4 keV count rate of . The observations were made in 1990/91 with the ROSAT/PSPC satellite, and at a brightness limit of (5843 sources) the RASS/BSC represents a sky coverage of 92%. The median positional uncertainty (, including 6″ systematic uncertainty) is .
The sources in the RASS/BSC are the brightest X-ray sources in the sky. Brighter sources generally allow for better X-ray spectra and time variability observations, so the RASS/BSC sources are ideal for studying the X-ray properties of their respective classes with modern X-ray telescopes. However, as of 2008 Aug 1 only 1982 RASS/BSC sources have been observed with either Chandra or XMM-Newton. Further, around two thirds of the sources in the RASS/BSC remain unclassified (cf. §4), so the number of known source classes in the RASS/BSC and the number of sources of each class is limited. Classifying RASS/BSC sources therefore not only expands our knowledge of the brightest X-ray sources in the sky, but also provides ideal targets for follow-up observations that can improve our understanding of specific source classes. As a larger fraction of the RASS/BSC is classified, the catalog will also become a useful tool in producing population constraints for various classes of objects, and the sources that remain unclassified can be targeted in searches for previously unknown source classes and objects with unusual properties.
To classify RASS/BSC sources, one needs spectral and flux measurements in other wavebands. The error cones of the X-ray sources often contain several off-band sources, any one (or none) of which may be a counterpart. If the probability of association between the X-ray source and one or more off-band counterparts is calculated, the classification of that X-ray–off-band pair/group can be constrained. Furthermore, probable off-band counterparts can be studied with ground-based or other instrumentation, which can provide constraints on the source of X-rays. Similarly, the absence of off-band sources near a RASS/BSC source can also constrain its class. Thus, searching for off-band counterparts to RASS/BSC sources is a good way to advance the classification and study of these sources.
A summary of previous work identifying likely counterparts for RASS/BSC sources is given in Table 1, which also includes the present work for comparison. Many of these previous cross-associations searched for counterparts in catalogs of objects of a specific type, like stars (Huensch et al., 1998; Hünsch et al., 1999; Makarov & Urban, 2000; Torres et al., 2006), galaxies (Zimmermann et al., 2001), or quasars (Bade et al., 1998; Zickgraf et al., 2003). Other previous cross-associations searched for counterparts in catalogs of sources in one or more specific wave-bands, like optical (Voges et al., 1999; Rutledge et al., 2000; Schwope et al., 2000; McGlynn et al., 2004) and/or radio (Bauer et al., 2000; McGlynn et al., 2004). Only work that specifically addresses finding counterparts to RASS/BSC sources has been included in Table 1, while work that includes other X-ray catalogs without explicitly considering the RASS/BSC subset (e.g. Flesch & Hardcastle, 2004) has not been included.
The RASS/BSC sources were quantitatively cross-associated with USNO-A2 optical sources in previous work (Rutledge et al., 2000). The present work adapts the methods used in that X-ray–optical cross-association to associate RASS/BSC sources with Two Micron All Sky Survey Point Source Catalog (2MASS/PSC; Skrutskie et al., 2006) near-infrared (NIR) sources. The present work is the first to produce a cross-association between the full RASS/BSC and 2MASS/PSC catalogs.
2MASS surveyed 99.998% of the celestial sphere in the near-infrared, resulting in a Point Source Catalog containing 470992970 point sources, and an Extended Source Catalog (XSC) containing 1647599 extended sources. The majority of 2MASS/XSC sources are galaxies (97%), while most 2MASS/PSC sources are stars in the Milky Way. The 2MASS/PSC also contains point-source processed versions of virtually all the 2MASS/XSC sources, as well as a significant number of unresolved galaxies (Cutri et al., 2003). The present work considers only the 2MASS/PSC, for which the greatest sensitivity was achieved in the J band (), with a detection level better than 15.8 mag (Skrutskie et al., 2006).
This paper is organized as follows. In §2, the method used to perform the statistical cross-association between RASS/BSC and 2MASS/PSC sources is described. The results of this cross-association are discussed in §3, which includes an association catalog containing the most likely NIR counterpart for each X-ray source. In §4, the source types listed in the SIMBAD database for the 2MASS/PSC sources that appear in the association catalog are discussed. The present work is compared to previous cross-associations in §5, and discussion and conclusions can be found in §6.
2 ANALYSIS
The present approach follows that of previous work, in which RASS/BSC X-ray sources were statistically associated with USNO-A2 optical sources (Rutledge et al., 2000, R00 hereafter). The main steps to this approach are recounted here, as relevant to the present work, while the earlier work is referred to for a more detailed discussion.
Source fields are defined as regions within of a RASS/BSC X-ray source. For each source field, a number of non-overlapping, adjacent background fields are extracted (in R00, 10 fields were extracted along a line of constant declination through the RASS/BSC position).
One defines a function, , which depends on the joint properties of an X-ray–off-band source pair, such as the X-ray–off-band source separation and its uncertainty, and the off-band magnitude of the candidate counterpart. should be large when the the X-ray source and off-band counterpart are associated, and small when they are not.
is computed for each X-ray–off-band source pair within a source field, and for off-band sources in background fields as if there is an X-ray source at the background field center.
The reliability of association of an X-ray source with a given off-band source is
| (1) |
where is the value of for that X-ray–off-band source pair, is the number of true associations (per source field) with that value, and is the number of associations (per source field) with that value, where the off-band source is an unrelated background source. As it is not known a priori which off-band sources in source fields are unrelated background objects and which are true counterparts to a RASS/BSC source, must be approximated based on the number distributions in of off-band sources per source and background field, and respectively. The approximation to used is (cf. R00)
| (2) |
In the theoretical development below, the formal definition of (eq. [1]) is used, while the approximation to (eq. [2]) is used whenever discussing computed values or results.
Assuming that each X-ray source is either associated uniquely with one of the off-band sources in the corresponding source field or associated with none of them, the probability of unique (exclusive) association between the X-ray source and the candidate off-band counterpart, , is calculated:
| (3) |
Further, the probability that none of the off-band sources are associated with a given X-ray source,
| (4) |
is computed. This permits the fraction of the RASS/BSC that has an identifiable counterpart in the off-band catalog (the ’quality’) to be determined:
| (5) |
where the average is over all RASS/BSC sources. The definitions of and given above are the same as in the previous work . The apparent difference is due to the normalization factor being written out explicitly in the present work, with common factors being cancelled from the numerator and denominator.
The remainder of §2 describes the adaptation of the method described above to the RASS/BSC–2MASS/PSC cross-association performed in the present work. The main focus of this analysis is to identify individual 2MASS/PSC sources associated with a RASS/BSC source.
2.1 Source and Background Fields
NIR sources are extracted from the 2MASS/PSC catalog for source and background fields, within a radius of from each field center. The background fields are centered on a square lattice of spacing around each source field, and assigned the same positional uncertainty as the X-ray source in the source field. The square lattice is chosen to ensure that the background fields are taken from regions similar to the source fields. Background fields containing a RASS/BSC source are excluded from the analysis, since it is assumed in calculating that background fields contain no NIR sources that are associated with a RASS/BSC source. There are a total of background fields.
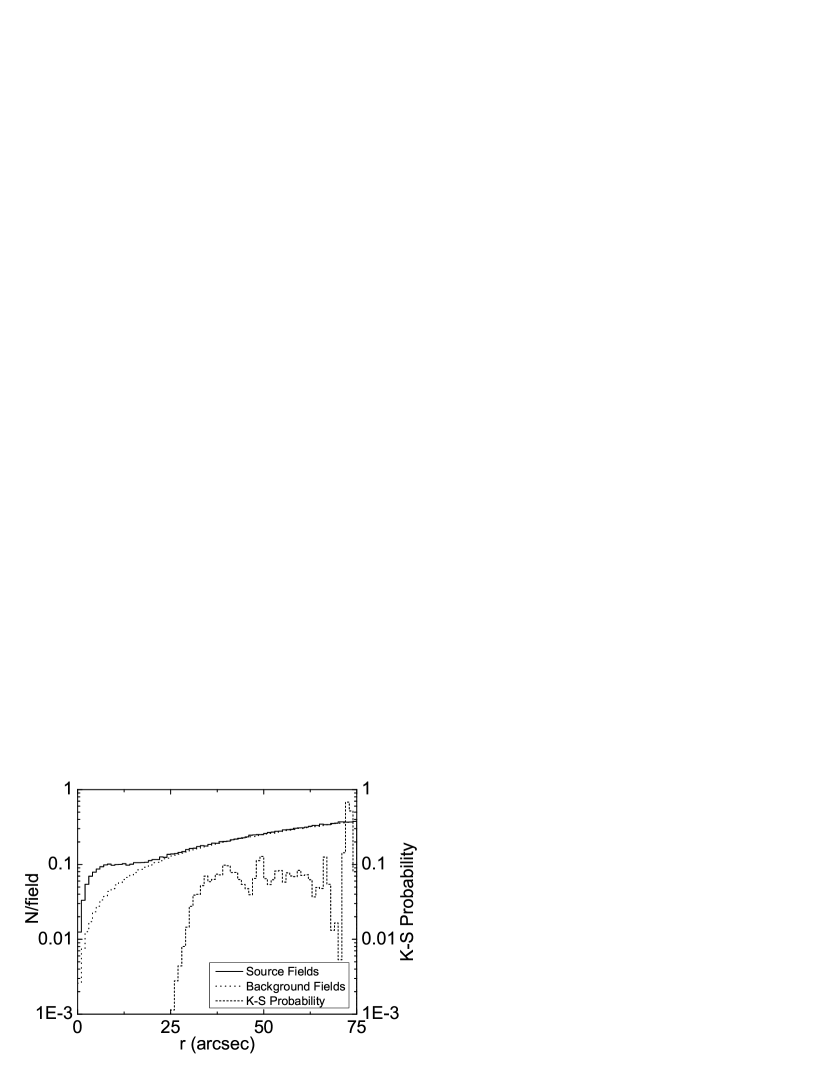
The distance from a 2MASS/PSC source to the field center is denoted . The differential number distributions of separations in the source and background fields are shown in Fig. 1. At each , the shapes of the cumulative distributions from to are compared using a two sample Kolmogorov–Smirnov (K–S; Press et al., 1992) test. The K–S test gives the probability that the cumulative source and background field distributions arise from the same underlying distribution. For there is an excess of NIR sources in the source fields compared to the background fields, and the K–S probability is below for . This excess in the source fields is due to 2MASS/PSC sources that are associated with a RASS/BSC source.
There is an improbable difference () between the number distributions of NIR sources, observed when comparing source and background fields in the range . A detailed examination of these distributions finds a small, but apparently significant, excess of NIR sources in the source fields compared to background fields. Only 314 RASS/BSC sources have positional uncertainties greater than , so it is unlikely that the excess of NIR sources at is due to 2MASS/PSC sources associated with a RASS/BSC source. However, the clustering of 2MASS/PSC sources (in open clusters or galaxy clusters) could cause deviations in the source field distribution compared to that of background fields, for , associated with the presence of the X-ray source.
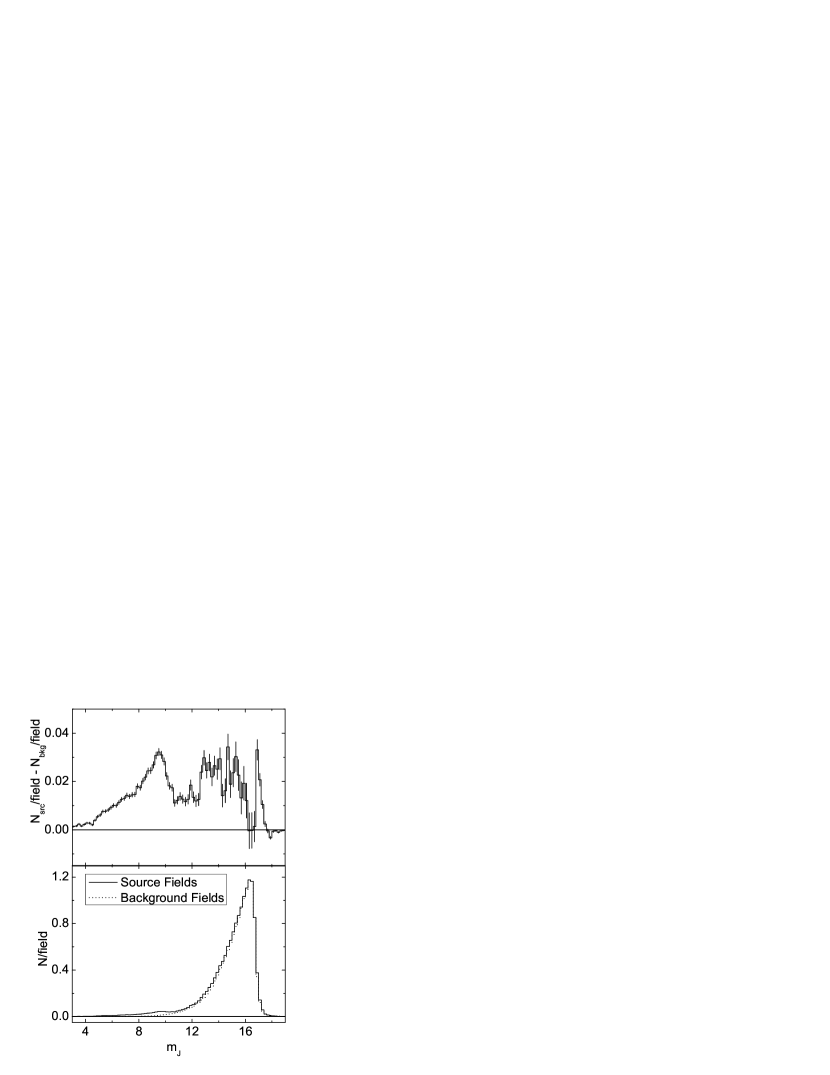
Differential number distributions in J-band magnitude for NIR sources in the source and background fields are shown in Fig. 2. There is an excess of NIR sources in the source fields, except for , where there is a slight deficit of NIR sources in the source fields compared to the background fields. This deficit is likely due to the detectability of faint NIR sources being limited by the presence of a larger number of bright NIR sources in the source fields. The excess of NIR sources in source fields is statistically most significant for bright () NIR sources.
The excess NIR sources present in source fields compared to background fields are NIR sources that are associated in some way with the X-ray source. A large number of known X-ray source classes are associated with single, point-source NIR counterparts, like coronally active stars or (spectroscopic or eclipsing) binaries, active galactic nuclei (AGN), or low-mass X-ray binaries. The present analysis is optimized to find these sources classes, as they have single NIR counterparts. However, there are known X-ray source classes which are associated with multiple NIR sources, either due to the nature of the source class (e.g. X-ray clusters of galaxies) or because the source class tends to be found in groups of similar NIR sources (e.g. T Tauri stars in stellar open clusters, or AGN in galaxy clusters). Further, X-ray emitting NIR resolved binaries also have more than one NIR source associated with the X-ray source. These classes of X-ray sources that are associated with multiple NIR sources will still appear in the present analysis, but the top match will be affected by source confusion; multiple possible NIR counterparts will decrease the value for the most likely counterpart. The remainder of this section attempts to constrain the number of RASS/BSC sources that are associated with a given number of NIR sources.
The normalized number distribution of RASS/BSC sources with NIR sources in the corresponding source field is shown in Fig. 3, for . The distribution of RASS/BSC sources has a sharp peak around a mode of , and has a tail extending to . There are 1199 RASS/BSC sources with , with less than 30 RASS/BSC sources at any given .
A source field containing a RASS/BSC source that is associated with NIR sources should on average contain more NIR sources than an adjacent background field. Thus, the normalized distribution in of RASS/BSC sources associated with NIR sources should be consistent with the normalized number distribution of background fields in . Further, the overall distribution of RASS/BSC sources in should be consistent with a weighted sum over of background field distributions in , where the weights are the fraction of RASS/BSC sources that are associated with NIR sources. To estimate these weights, a Levenberg–Marquardt nonlinear minimization fitting (cf. Press et al., 1992) to the distribution of RASS/BSC sources is performed using the Origin (OriginLab, Northampton, MA) software. Values of are excluded since the uncertainties are assumed to be Gaussian, which is not necessarily a good approximation for the low number counts in this range of . Since there are almost eight times as many background fields as RASS/BSC sources, the fractional uncertainties on the background field distribution should in general be less than half those on the RASS/BSC distribution, though differences in the distributions may increase the importance of the background field distribution uncertainties. The background field distribution uncertainties are neglected when fitting, and it can be verified after fitting that these uncertainties are indeed negligible.
The aim of the fitting is to determine whether there is an acceptable description of the observed distribution of RASS/BSC sources in , under the assumption that a fraction of all RASS/BSC sources have NIR counterparts, where . The method adopted is to first fix for all except , and then free components one by one (first , then , etc.) until the reduced drops below 1. For the that are allowed to vary in each step, a constraint is adopted to avoid computational problems that arise in the fitting routine if the constraint is used. With the addition of the component, the reduced value is 0.94, so no further components are added. The components have best-fit values , i.e. equal to the lower constraint, so these are then fixed to zero. Re-running the fit, the component is consistent with zero weight (), so this weight is also fixed to zero. The final best fit (reduced ) is then , , , and . Thus, of all RASS/BSC sources have zero or one NIR counterparts, i.e. satisfy the assumptions used when calculating and . Extending the present method to include matches with two or more NIR sources in the calculation of will be the focus of future work.
It should be noted that the quoted uncertainties on only take into account the diagonal elements of the covariance matrix, and thus do not consider dependencies between different components. Since the different components only differ by a shift in of 1, parameters with similar are likely to be highly dependent, so the true fraction of the RASS/BSC that is associated with NIR counterparts may not be consistent with the quoted uncertainty on . Further, it is likely that the component accounts for a population of RASS/BSC sources that are associated with NIR sources, rather than just an population.
Given the best-fit values of , it can now be verified that neglecting the uncertainties on the background field distribution in is an appropriate assumption. The largest ratio of the uncertainty on the RASS/BSC distribution to that on any of the components is 0.27 (for and ). Adding this uncertainty to the RASS/BSC distribution uncertainty in quadrature would give an uncertainty that is 4% larger than the RASS/BSC distribution uncertainty alone, so neglecting the background field distribution uncertainty is unlikely to have a significant effect on the fitting.
2.2
Large uncertainties in the RASS/BSC positions make it difficult to identify likely NIR counterparts based only on the probability of positional coincidence. Therefore, the J-band brightness of the NIR source and the local density of NIR sources were included in the function :
| (6) |
is the number of brighter NIR sources in background fields, is the sum of squares of the uncertainties in the X-ray and NIR positions, and is the the local density of NIR sources. To compute , the number of 2MASS/PSC sources within of the X-ray source is divided by angular area of a radius cone. Some X-ray sources have a listed positional uncertainty of zero, for which an uncertainty of 12″ is adopted.
The quantity defined in equation (6) should be understood as a figure of merit, and not as a likelihood ratio in the formal statistical definition of that term (cf. Wilks, 1938); in the formal definition the likelihood ratio is a ratio of probability density functions, whereas the quantity as used here and previously includes integrated probability density functions, and thus does not satisfy this definition. Moreover, the quantity is not here used as a likelihood ratio, in that a likelihood ratio is used to determine the relative likelihood of two competing hypotheses; here, is used strictly as a figure of merit and not, itself, to compare the relative likelihood of two competing hypotheses.222The quantity evolved as a modified version of a quantity referred to as a “likelihood ratio”, used in previous work (Wolstencroft et al., 1986) to identify likely off-band counterparts of IRAS sources. The terminology “likelihood ratio” was applied in the previous work (Wolstencroft et al., 1986), where the relevant quantity was in fact used to choose between two competing hypotheses; however, the quantity to which it was applied involved terms which were not probability density functions, so the quantity used there does not satisfy the formal definition of a likelihood ratio. Thus, the reader is strongly cautioned that in the present work, the quantity is used strictly as a figure of merit; it is not itself used as a likelihood ratio to distinguish between two competing hypotheses, and should not be considered as anything other than strictly a figure of merit.
The used in the present work differs from that employed in the RASS/BSC–USNO-A2 cross-association by a factor of , due to the use of a two dimensional—rather than one dimensional—normalization of the probability of coincidence, and by the added factor of , which is the probability that there is no closer NIR source to the field center. ranges from 0.3 to 50 NIR sources per square arcmin, is 2.8 sources per square arcmin on average, and is typically large close to the galactic plane and small away from it. Including a dependence in accounts for the fact that the higher the local density of NIR sources, the larger the chance that an unrelated background NIR source falls within the error cone of an X-ray source.
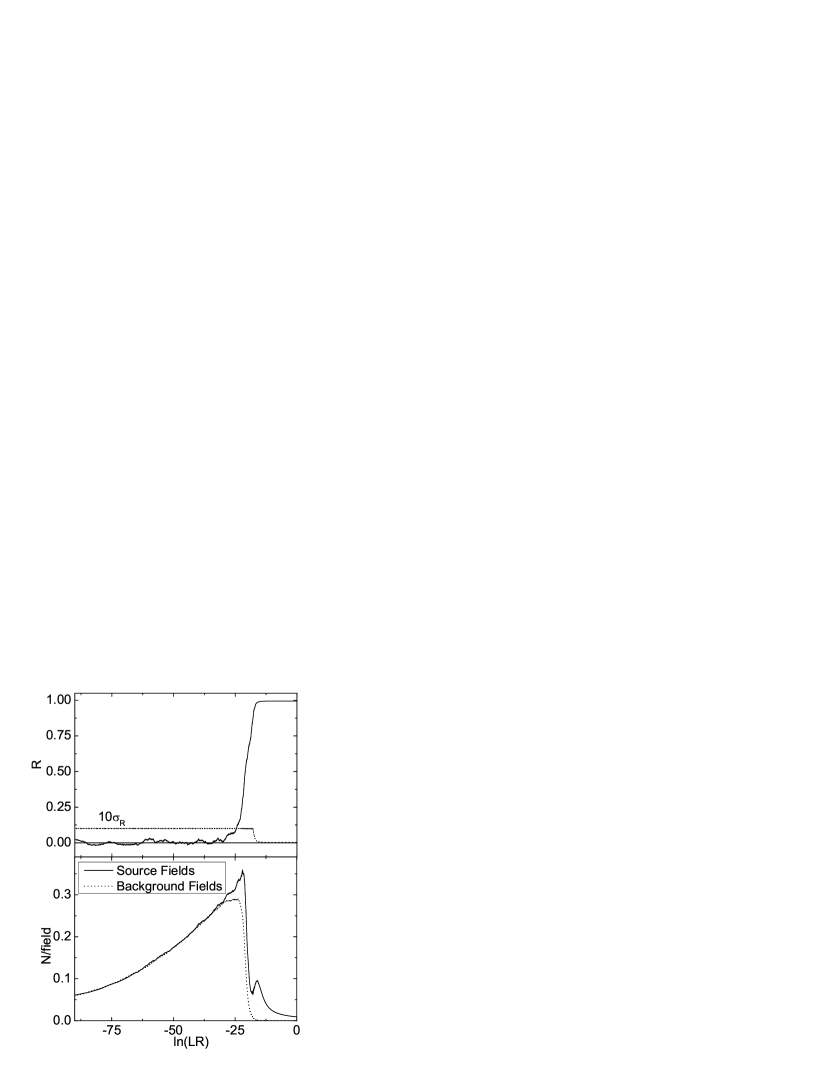
Fig. 4 shows the number distributions in of NIR sources in source and background fields, and the resulting . To ensure sufficient counting statistics, the number distributions are calculated by first dividing the range into bins of width 0.01, and then for each bin averaging over a wide enough range of bins around it—at least 21—to keep the propagated Gaussian counting uncertainty , and to keep the total number of NIR sources above 250—to justify using the Gaussian uncertainty. The normalization of the number distributions is such that approximately equals the total number of NIR sources per field for that field type (the equality is not exact because of the averaging over bins described above). is set to zero for values less than the largest for which , so that for all X-ray–NIR pairs. Negative values can arise from random fluctuations, or from breakdown of the assumption that source fields contain both background NIR sources and NIR sources that are associated with the X-ray source. An example of such breakdown is the apparent deficit of very faint NIR sources in source fields compared to background fields.
X-ray–NIR pairs with values in the same bin are all assigned the same value, so values in the same bin are perfectly correlated. Further, the averaging over bins used to calculate introduces a correlation between bins. All bins with are correlated to some extent, since there are only 247 NIR sources in background fields with in this range, and any bin in that range of thus must include at least one bin with in the averaging described above. For the remaining range of where is non-zero, , the distance in over which a correlation exists varies between 0.23 and 2.33. There are 10191 source fields with at least one pair of matches for which the values are not independent. Thus, care must be taken when propagating to calculate , and if the uncertainties are propagated as if the values are independent, it must be verified that this assumption does not significantly affect the values of interest.
The chosen form of neglects any dependence on of the number distribution of NIR sources as a function of . Such a dependence could arise from source population differences between the denser galactic plane and the less dense regions at higher galactic latitudes, or from the detectability of faint sources being limited by the presence of bright sources. Some dependence on is seen in a normalized version of , and this is most significant for the very brightest sources (). However, there are very few sources in source or background fields (cf. Fig. 2), and these are likely to have values close to 1 when they appear in source fields (cf. §3), so it is not expected that addressing these population differences would have a significant impact on the resulting association catalog.
2.3 Control Fields
In addition to the source and background fields, one control field ( radius) is extracted per square degree of the celestial sphere. Control fields that overlap with a source field are excluded, bringing the total number of control fields to 41192. Each control field is assigned the properties of a randomly chosen RASS/BSC source, and , , and are calculated for each NIR source in a given control field using the function computed from the source and background fields. Note that is a function which depends only on the source and background fields, not on the control fields.
A control field resembles an X-ray source that is not associated with a 2MASS/PSC source, so the values of control fields should be comparable to those of near-infrared faint RASS/BSC sources, and to RASS/BSC sources associated with any extended NIR sources that do not appear in the 2MASS/PSC. This information has proven useful in population studies of blank-field X-ray sources, such as isolated neutron stars (Rutledge et al., 2003; Turner et al., 2009).
3 RESULTS
For 100 RASS/BSC sources, there are no 2MASS/PSC sources within . For the remaining 18706 X-ray sources, there are a total of 287736 distinct NIR sources within . Except for three NIR sources that lie within of both 1RXS J020220.5-010609 and 1RXS J020221.0-01071, each NIR source is paired with only one RASS/BSC source, so the distinction between an NIR source and an X-ray–NIR pair can be relaxed. Assuming Gaussian counting uncertainty on the number of NIR sources, there are NIR sources per source field, and per background field, amounting to an excess in source fields of NIR sources per field.
The distribution in of the excess of NIR sources in source fields can be seen from Fig. 4. For , the source and background field distributions are consistent with no excess in source fields ( sources per field), and the probability that the same underlying distribution would give rise to two distributions as or more different than the source and background field distributions—for —is 0.55 (two sample K–S test; Press et al., 1992). Thus, the number distributions of NIR sources in source and background fields are consistent with being identical for , and setting for this range of is justified. For , the excess of NIR sources in source fields compared to background fields is per field. Thus, there are NIR sources in source fields in excess of the number of expected background sources for , and these NIR sources are assumed to be associated with the RASS/BSC sources when calculating .
Background fields are positioned near source fields to ensure that the population of NIR sources in background fields is similar to the population of background NIR sources in source fields, since the two populations are assumed to be identical when calculating . Further, the positional uncertainty of the RASS/BSC source in a given source field is adopted for the adjacent background fields, so that any anisotropy in the distribution of RASS/BSC positional uncertainties also is present for the background fields. The demonstrated similarity of the source and background field distributions of NIR sources with indicates that the background field NIR population does indeed approximate the background population in source fields, most likely also for .
There are NIR sources per control field, so there are more NIR sources per control field than per source field or per background field. Table 2 gives the number of source and control fields in six different regions of the sky, and the average value of —the local density of NIR sources—for the fields in that region. The regions are chosen to differentiate between the galactic poles, center, and anti-center, since these have different average NIR source densities in the 2MASS/PSC catalog. A larger fraction of control fields than source fields lie in the galactic plane, where the NIR source density is larger than in the remaining part of the sky, and this explains why there are more NIR sources per control field than per source field or per background field. Only NIR sources with are of interest in the case of control fields, since only these sources have , and for this range of the cumulative distributions of NIR sources in control and background fields are consistent with arising from the same underlying distribution (two sample K–S test probability of 0.19; Press et al., 1992). The distributions thus only differ in normalization for this range of .
To examine the impact of using as a measure of the significance of an association rather than , it is useful to consider the differential number distributions in and of NIR sources in the source and control fields. The distributions in are shown in Fig. 5, while the distributions in are shown in Fig. 6. For the number density in source fields is above that in control fields, while for the number density in source fields is below that in control fields in all but two bins. In total, there is a 9% excess of NIR sources in control fields compared to source fields for , which is due to the larger average number of NIR sources in control fields. For , there is a 78% excess of NIR sources in source fields compared to control fields, and this excess is due to NIR sources that are associated with a RASS/BSC source only being present in source fields. The distributions in show that for the number density in source fields is above that in control fields, while for the number density in source fields is below that in control fields in all but two bins. In total, there is a 6% excess of NIR sources in control fields compared to source fields for , and a 222% excess in source fields compared to control fields for . If each field contained only one source, would equal for all NIR sources, and the distributions in would be identical to the distributions in (cf. eq. [3]). However, 85% of source fields and 58% of control fields contain more than one source, so the distributions do in fact differ. The reason that a larger fraction of source fields than control fields contain multiple NIR sources with is because source fields contain NIR sources that are associated with a RASS/BSC source, while control fields do not. As a result, unrelated background sources in source fields are assigned lower values than similar sources in control fields, and it is possible that for some where , as is the case for .
The quality of the association catalog (eq. [5]) is . The uncertainty on is a conservative estimate of the statistical uncertainty, computed by noting that is simply the sum of of all values in source fields divided by the number of RASS/BSC sources. Since each value is correlated with at least 249 other source field values (due to the binning described in §2.2), their values cannot simply be summed in quadrature as if the values are independent. Rather, the conservative assumption that all values are perfectly correlated is adopted, and the uncertainties summed absolutely to obtain the conservative estimate of the statistical uncertainty on .
The interpretation of is that it is the fraction of the RASS/BSC with a counterpart in the 2MASS/PSC identifiable by the present method . Therefore, is the fraction of the RASS/BSC that does not have an NIR counterpart, under the assumption that all RASS/BSC sources have zero or one NIR counterparts. However, it was shown in §2.1 that this assumption only holds for of RASS/BSC sources, so the assumption may introduce a large systematic uncertainty on . In fact, the fraction of RASS/BSC sources found in §2.1 to have no NIR counterpart is , which is not consistent with the statistical uncertainty on . Thus , and by extention many values, have large systematic uncertainties introduced by the assumption of zero or one NIR counterparts to each RASS/BSC source. These systematic uncertainties are also likely to be present in the previous work , as it was concluded there that of RASS/BSC sources do not satisfy the assumption that each X-ray source has zero or one USNO-A2 counterparts.
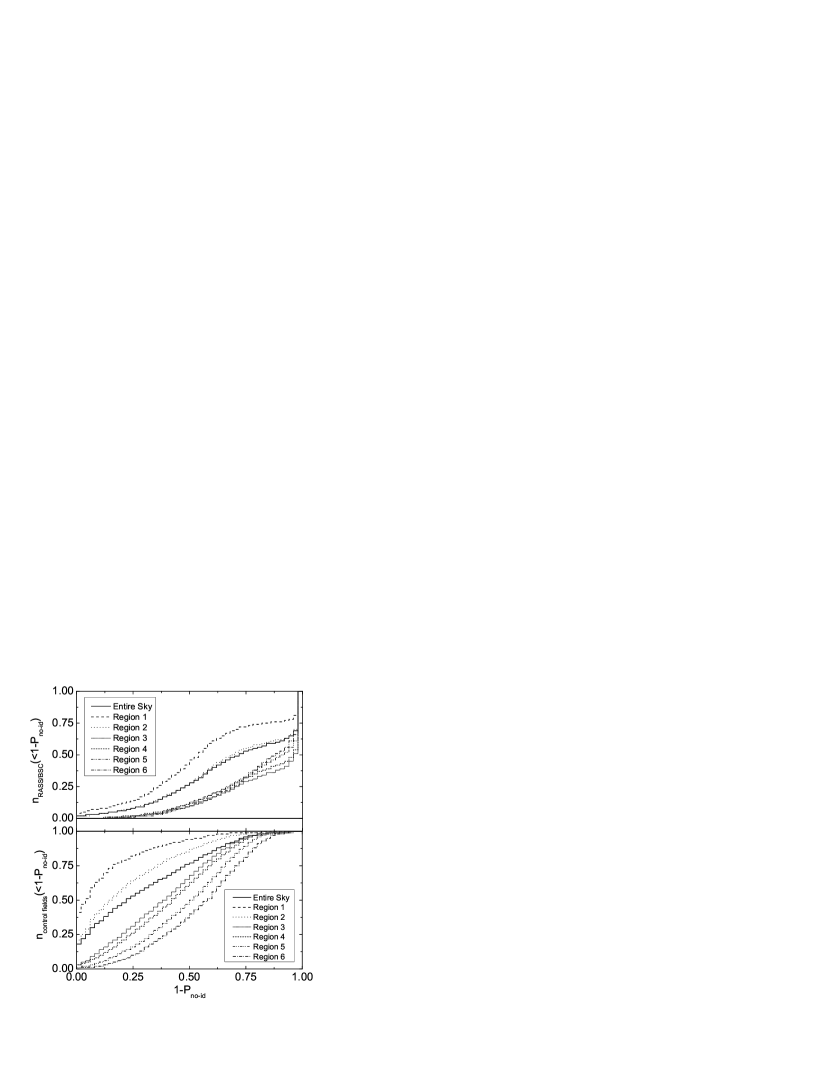
Control fields do not contain NIR sources that are associated with a RASS/BSC source, but have and values computed based on the function computed using the source and background fields. The control fields are thus like the source fields of X-ray bright NIR faint sources in the RASS/BSC. Fig. 7 shows the normalized cumulative distributions in of RASS/BSC sources and control fields, , for the six different regions of the sky described in Table 2. At every value of , is larger for each region than for any other region with larger average NIR source density. Thus, X-ray bright NIR faint sources are more easily identified in regions of lower NIR source density. In the case of RASS/BSC sources, the distributions for regions in the galactic plane follow each other closely for , and lie entirely below the distributions for regions outside the galactic plane. This may in part be due to greater confusion in the galactic plane as a result of higher NIR source density, but is most likely indicative of a difference in the population of X-ray sources in and outside the galactic plane.
3.1 The Association Catalog
Of the 18806 RASS/BSC sources, 18568 are associated with at least one 2MASS/PSC source with . Further, each RASS/BSC source is assigned a . The association catalog (Table 3) contains all RASS/BSC sources, their , and the 2MASS/PSC source in the corresponding source field with the highest non-zero . If any of the RASS/BSC sources or 2MASS/PSC sources in the association catalog were listed in the SIMBAD database as of 2009 April 23, the source type given there is also included (cf. §4 for details). The association catalog is sorted by the 1RXS designation of the RASS/BSC source. An online version of the catalog is also available333http://dualcore.physics.mcgill.ca/RASS/index.html, and is searchable by and .
The catalog contains 3853 2MASS sources with , 2280 with , and 4153 with . These subsets of the catalog are referred to as high, medium, and low quality matches, respectively, and correspond to the catalogs which resulted from the RASS/BSC–USNO-A2 cross-association . The background contamination (, cf. R00) is 39, 101, and 1443 for the high, medium, and low quality matches respectively.
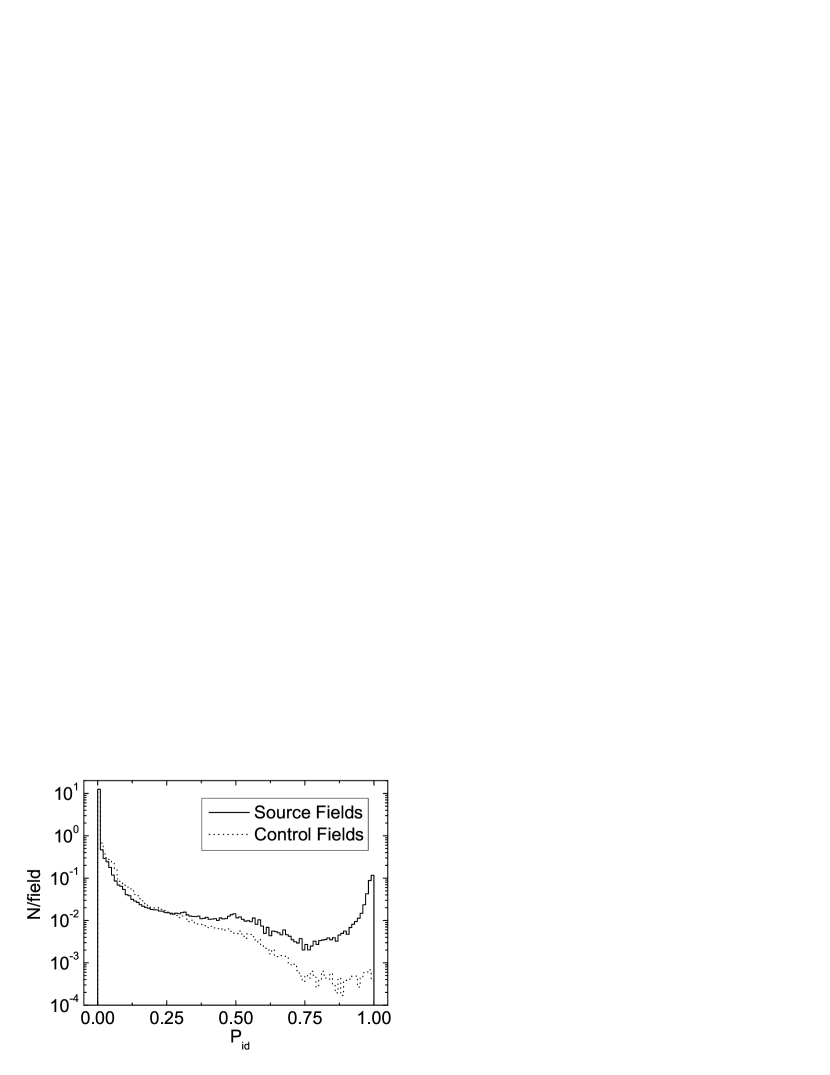
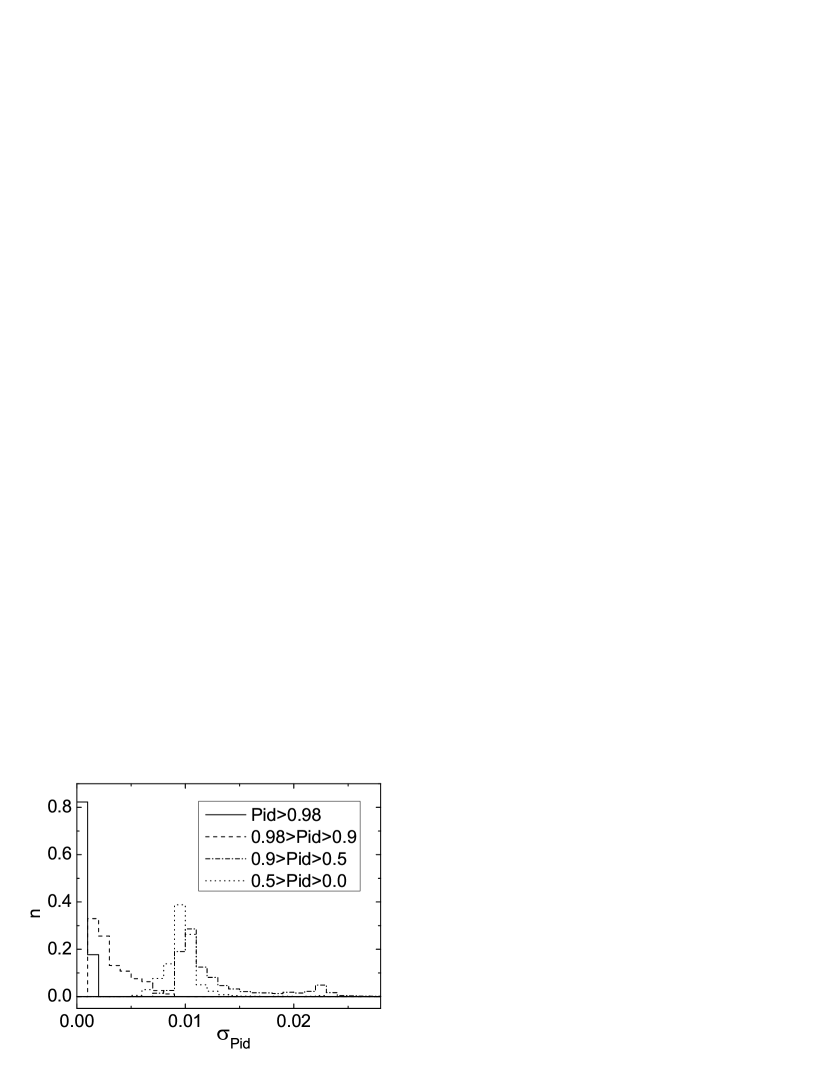
The distributions of statistical uncertainties on are shown in Fig. 8. The high and medium quality matches all have , while the low quality matches have values clustered around 0.01, with a tail in the distribution extending to 0.03. For almost all matches have values clustered around 0.01. The clustering around is due to the bin size used in calculating being adjusted until , since the uncertainty in is approximately the uncertainty in for sources where . The tail of larger consists of sources for which there is a significant difference between and due to the presence of other sources with non-zero values in the same field.
In propagating the uncertainty to , it is assumed that the values in that field are independent. However, due to the method used to calculate , that may not be the case (cf. §2.1). Thus, it must be verified that treating the values as independent has not led to significantly smaller values than those that would result from an error analysis considering correlations. An investigation of the matches in the association catalog reveals that none of the high or medium quality matches have values that are correlated with another value in the field, while 445 low quality matches and 2799 matches do have values that to some extent are correlated with at least one other value in the field. All of these low quality matches have values that are correlated with exactly one other value in the field, while 262 of the matches have values that are correlated with between two and five other values. A conservative rough estimate of the effect of correlations in the error propagation is that is a weighted absolute sum rather than the square root of a weighted sum of squares, so considering correlations could increase by as much as a factor of square root the number of correlated values. Thus, the uncertainties shown for the high and medium quality matches in Fig. 8 should be largely unaffected by the assumption that the values are independent, while 11% of the low quality matches may have quoted uncertainties smaller by as much as a factor of than those that would result from a covariant error analysis. Further, 31% of the matches may have uncertainties that are underestimated by as much as a factor of , while 3% may be underestimated by as much as a factor of . Based on the distributions shown in Fig. 8, almost all low quality and matches would thus have , also in a covariant error analysis. Whether the uncertainty on a low quality or match is or is unlikely to affect a decision to do follow-up observations of the NIR or X-ray source, nor is it likely to affect any conclusions drawn on the basis of the association, so it is concluded that the assumption of independent values is adequate for the present work.
In principle, correlations between two other values in the field of a high or medium quality match could lead to a larger value in an error analysis considering correlations. However, those values are likely to be small compared to the value of the association catalog match (otherwise it would not be a high or medium quality match), so the contribution of the uncertainties on the other values to is likely to be small, whether or not the other values are correlated. Thus, the conclusion remains that the uncertainties shown for the high and medium quality matches in Fig. 8 should be largely unaffected by the assumption that the values are independent. However, the uncertainties for the low quality and matches may be affected by correlations between other values in the field, so the fractions of these matches that are affected may be larger than those quoted above, as may the size of the effect in some cases. Fields for which there are many correlated values are likely to be fields for which the assumption of one or no NIR counterparts to the RASS/BSC source is not valid, so the systematic uncertainty introduced by this assumption is likely to be larger than the propagated statistical uncertainty for these fields. Thus, whether the uncertainty is propagated as if the variables are independent or not would not significantly affect the quantitative or qualitative conclusions under the present analysis.
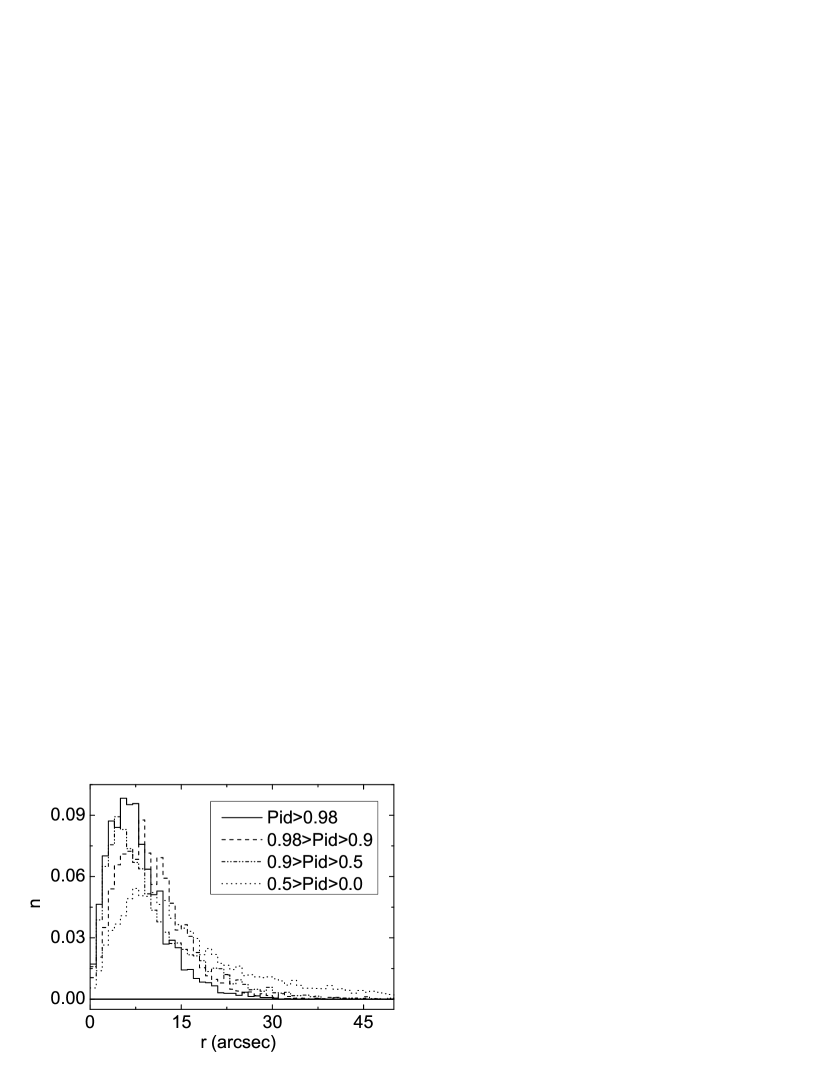
The distribution of separations between the X-ray and NIR sources in the association catalog is shown in Fig. 9. The distribution for high quality matches is the most sharply peaked, and a broadening is seen as decreases. High, medium, and low quality matches are identified out to a distance comparable to the positional uncertainty for the RASS/BSC sources; the mode and average RASS/BSC positional uncertainty are and respectively. Several matches are identified well beyond this range, some at distances greater than .
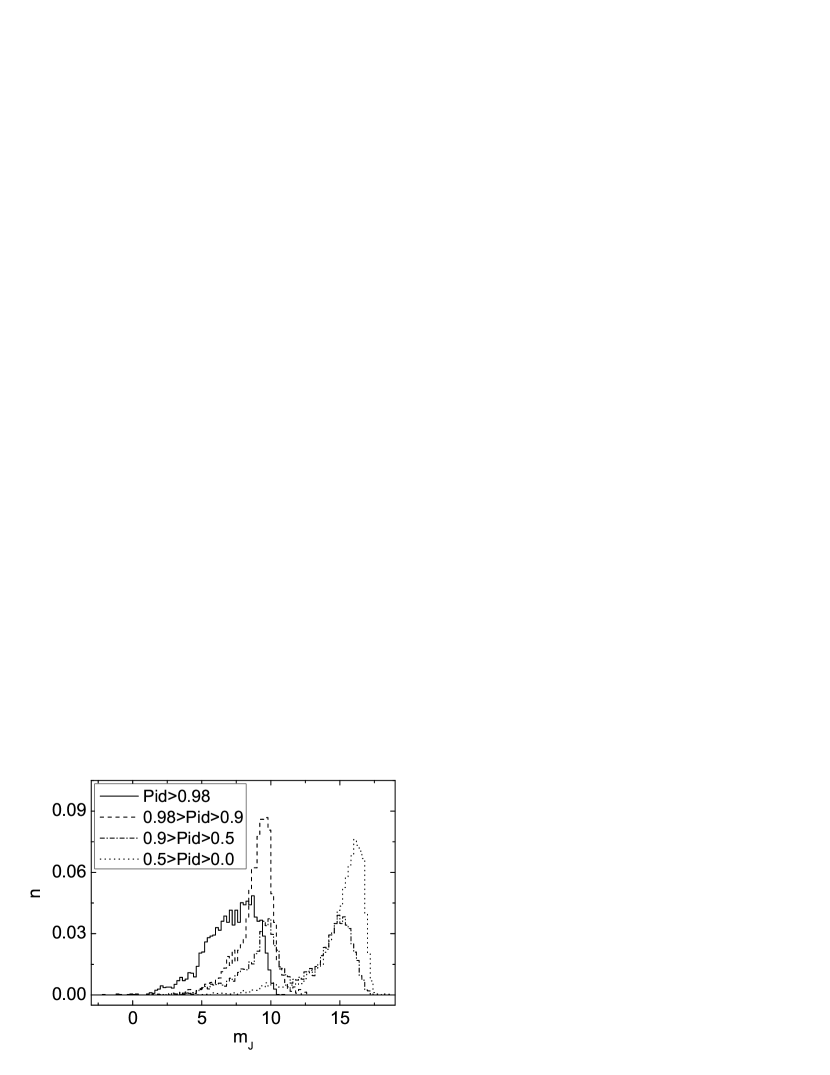
Fig. 10 shows the distribution of J-band magnitudes among the matches in the catalog. Almost all high and medium quality matches have , while the low quality and remaining matches include a population of significantly fainter sources. As will be discussed in §4.1, many of the sources are coronally active stars, and the sharp drop in the number of matches at is likely due to coronally active stars fainter than this having an X-ray flux below the RASS/BSC detection limit. The second, J-band fainter, population of matches seen in Fig. 10 appears to match the brightness distribution of NIR sources in the background fields, indicating that there is no strong X-ray to J-band flux correlation for these matches.
4 SOURCE CLASSES IN SIMBAD
The SIMBAD database444http://simbad.u-strasbg.fr/simbad/ lists source types for many astronomical objects, including—as of 2009 April 23—all 18806 RASS/BSC sources, and 6115 of the 2MASS/PSC sources in the association catalog (Table 3). SIMBAD is an incomplete, heterogeneous database, but offers a sense of the extent to which the association catalog includes previously unknown information. Objects listed in SIMBAD with the source type ‘X-ray source’ or ’Infra-Red source’ are considered unclassified, and these include 12213 (65%) of the RASS/BSC sources and 229 of the aforementioned 2MASS/PSC sources. The remaining 6553 RASS/BSC sources and 5886 2MASS/PSC sources are considered classified in SIMBAD. Of the 18568 matches in the association catalog, 2609 appear as associated in SIMBAD (the RASS/BSC and 2MASS/PSC identifiers are both listed for the same object). This section examines the source types and RASS/BSC–2MASS/PSC associations listed in SIMBAD for the 2MASS/PSC sources in the association catalog.
All RASS/BSC–2MASS/PSC matches fall into one of four mutually exclusive categories: a RASS/BSC source and a 2MASS/PSC source may or may not be associated in SIMBAD, and the 2MASS/PSC source may or may not be classified in SIMBAD. The number of matches in the association catalog that fall into each of these categories is given in Table 4, for several different cutoffs. For the classified 2MASS/PSC sources that are not associated with the corresponding RASS/BSC source in SIMBAD, the 2MASS/PSC source type can be adopted for the RASS/BSC source with confidence . Moreover, this table points out where opportunities to classify RASS/BSC sources exist, through observations of the 2MASS/PSC source. For example, there are 1203 high quality matches for which the 2MASS/PSC source is not classified in SIMBAD, and follow-up optical/IR spectroscopy of these 2MASS/PSC sources could classify the X-ray source as an AGN, star, white dwarf, or other class of X-ray source.
The number of 2MASS/PSC sources in the association catalog with a given SIMBAD source type is shown in Table 5, for several different cutoffs. The number of “new” associations—RASS/BSC–2MASS/PSC associations not present in SIMBAD—is also given for each source type. The new associations include 1464 high quality matches, 679 medium quality matches, and 582 low quality matches with previously classified 2MASS/PSC sources. Of these new associations, only 39 high, 23 medium, and 66 low quality matches are with RASS/BSC sources that are classified in SIMBAD. Thus, almost all the new associations with previously classified 2MASS/PSC sources provide probable new classifications for RASS/BSC sources. For example, the high quality matches provide likely new RASS/BSC classifications including 125 (127 if ignoring previous RASS/BSC classifications) double or multiple stars, 173 (184) high proper motion stars, and 758 (772) stars.
Also given in Table 5 is the fraction of 2MASS/PSC sources of a given type that are high quality matches. This fraction illustrates the efficiency with which the method described in §2 associates high quality counterparts for a given source type (limited, of course, by any selection biases in SIMBAD). Stars, and other bright near-infrared point sources, are among the NIR counterparts with the largest fraction of high quality matches, while none of the 718 quasars or 306 Seyfert type galaxies have . This difference is most likely due to the definition of LR in the present work, which selects bright NIR sources.
4.1 Color–Color Diagram
A RASS/BSC–2MASS/PSC match has flux information both in an X-ray band and in multiple NIR bands, and can be plotted with X-ray–J color against J–K color. Such a color–color diagram is useful in studying the properties of the matches in the catalog.
The ROSAT PSPC count rate (0.1-2.4 keV) of each RASS/BSC source is converted to an X-ray flux (0.4-2.4 keV) using the HEASOFT tool pimms, by assuming that the spectrum is a power-law of photon index 2. Two X-ray fluxes are computed: the uncorrected X-ray flux (setting in pimms), and the absorption-corrected X-ray flux . The value of used to calculate the absorption-corrected flux of each source is derived from the measurements of the Leiden/Argentine/Bonn Survey of Galactic HI (Kalberla et al., 2005), using the HEASOFT tool nh. The output of nh chosen in this case is the weighted average of the data points from the survey closest to the direction of the RASS/BSC source, and it should be noted that this corresponds to the total integrated column to the edge of the galaxy. Thus, the applied correction is systematically too large for sources within the Galaxy.
To calculate the extinction-corrected NIR magnitudes and , it is necessary to relate the extinction in the two respective bands to the value of . Such a connection can be made by assuming that four separate relations between extinction corrections in various bands hold for all sources: The first relation (Predehl & Schmitt, 1995),
| (7) |
allows the V-band magnitude correction to be found from the value of ; the second relation (Schild, 1977),
| (8) |
allows the B–V color correction to be found from ; and the final two relations (Fitzpatrick, 1999),
| (9) |
and
| (10) |
allow the J- and K-band magnitude corrections and to be found from . In the relation for , the midpoint of the range (0.33-0.38) given for the prefactor is used. Having computed the J-band magnitude extinction correction, the corresponding extinction corrected flux is
| (11) |
where the prefactor is the ’In-Band’ zero-magnitude flux for the 2MASS J-band (Cohen et al., 2003).
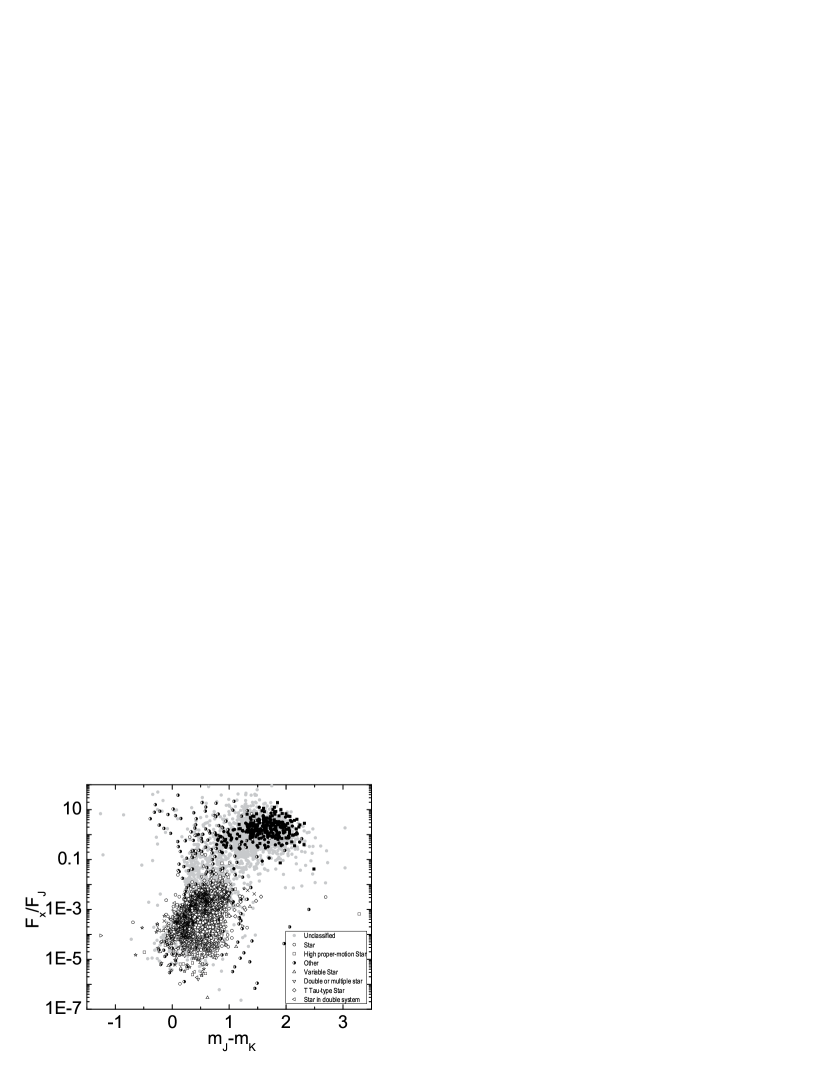
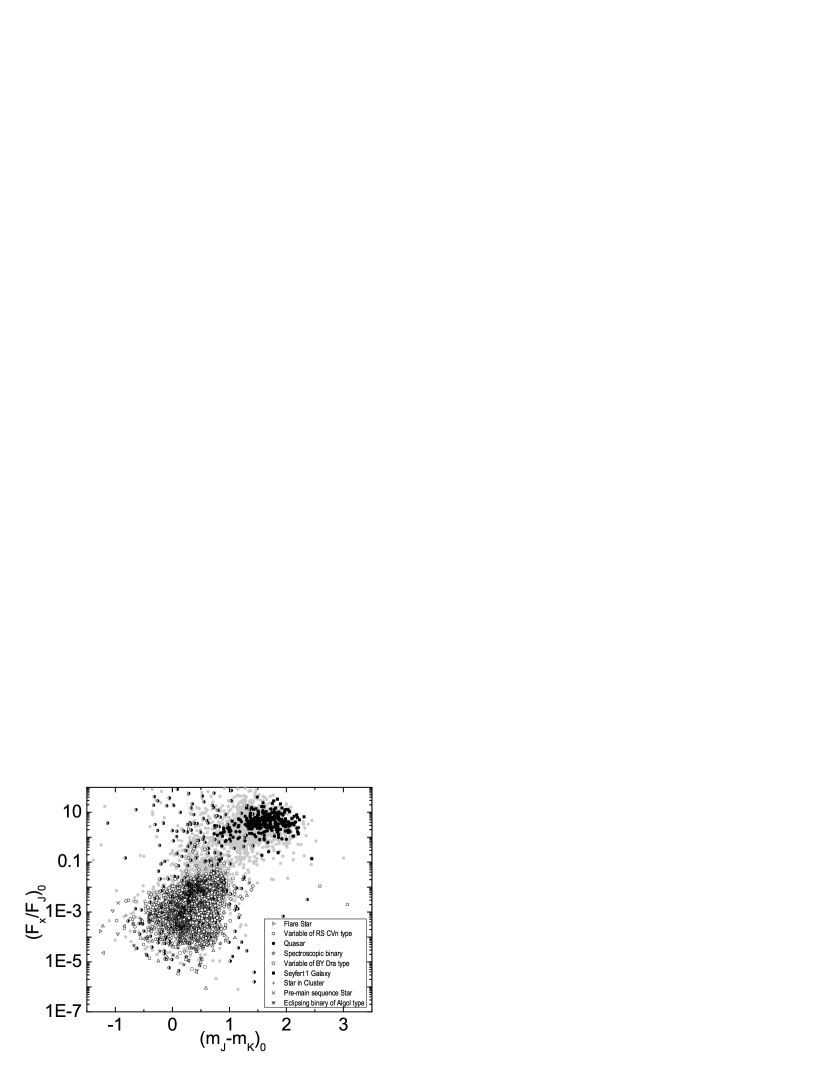
The X-ray to J-band flux ratio against J–K color of the matches is shown in Fig. 11 (uncorrected) and Fig. 12 (corrected for X-ray absorption and NIR extinction). The source type listed in SIMBAD for the 2MASS/PSC source is shown for source types with 50 such matches, while the remaining classified sources are labeled as ’Other’. Sources not listed in SIMBAD, or listed as ‘X-ray source’ or ’Infra-Red source’, are considered ’Unclassified’. The majority of classified sources are either galaxies or coronally active stars, where ’galaxies’ include the source types ’Quasar’ and ’Seyfert 1 Galaxy’, while ’coronally active stars’ include the remaining source types listed in the joint legend of Fig. 11 and Fig. 12 (excluding ’Other’ and ’Unclassified’). Galaxies and coronally active stars appear to occupy distinct regions of the color–color diagram: The galaxies have and , while almost all the coronally active stars have and . There are unclassified matches in the region occupied by coronally active stars, in the region occupied by galaxies, and in the remainder of the color–color diagram.
The X-ray flux of the bulk of the RASS/BSC sources only spans a range of about one order of magnitude, so the large range in seen in Fig. 11 is mainly due to the large range of J-band fluxes of sources in the 2MASS/PSC. Thus, the distribution of matches in is closely related to the distribution of matches in , which can be seen in Fig. 10. It appears that the brighter population of sources seen in Fig. 10 consists mainly of coronally active stars.
To determine whether the upper limit on for coronally active stars is physical or due to selection effects (the chosen favors bright J-band sources), a search for correlation between and was performed for the high quality matches for which the 2MASS/PSC source is of one of the stellar source types on the joint legend of Fig. 11 and Fig. 12 (i.e. not ’Unclassified’, ’Other’, ’Quasar’, or ’Seyfert 1 Galaxy’). Only high quality matches were considered to minimize the number of spurious matches, and to exaggerate any selection effects. A clear correlation was seen between and along the line corresponding to the upper limit on , and the probability that and are uncorrelated was found to be (Spearman Rank–Order Correlation; Press et al., 1992). This correlation indicates a physical origin of the upper limit, as no direct dependence on is included in , but a correlation between and could have been introduced through their mutual dependence on . However, the probability that and are uncorrelated is , and the probability that and are uncorrelated is 0.13 (Spearman Rank–Order Correlation; Press et al., 1992), so it is unlikely that a correlation between and could have been introduced through . The upper limit on thus appears to be physical in origin, and is most likely related to the saturation at seen in rotation–activity diagrams for coronally active stars (Güdel, 2004).
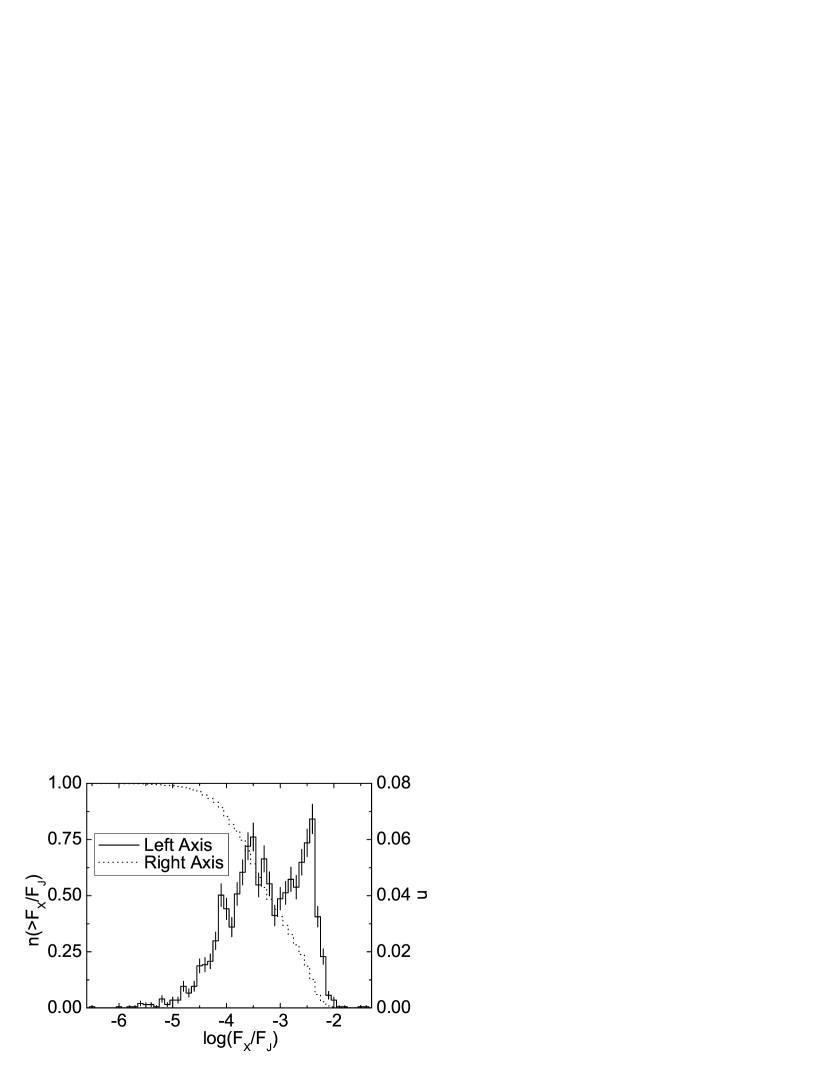
Fig. 13 shows the differential and cumulative number distributions of high quality matches that are coronally active stars against . The sharp cutoff at large is due to the previously discussed physical limit, while the scarcity of very bright J-band sources likely affects the shape of the distribution at small . Since the X-ray flux of the bulk of the RASS/BSC only spans a range of about one order of magnitude, the cutoff due to the physical upper limit on for coronally active stars is the most likely cause of the similar cutoff seen in Fig. 10 around . Since the 2MASS/PSC is practically complete for (cf. §1), all the coronally active stars in the RASS/BSC should have counterparts in the 2MASS/PSC. The association catalog presented in §3.1 is thus only confusion limited for J-band counterparts to coronally active stars, not flux limited.
The definition adopted for favors bright J-band sources (cf. §2.2). The association catalog therefore includes many high quality matches with bright J-band sources, like coronally active stars, but few matches with fainter NIR sources (cf. Fig. 10). If high quality matches with fainter NIR sources are needed, the cross-association can be repeated with a different definition of . For example, if high quality matches with galaxies are needed, could be defined to favor NIR objects with , in much the same way bright NIR objects were favored in the present cross-association.
5 COMPARISON WITH OTHER PUBLISHED CROSS-ASSOCIATIONS
The cross-association method described in §2 is an adaptation to the 2MASS/PSC of the method employed in previous work for the USNO-A2 catalog, so the results of the present work can be directly compared to those of the RASS/BSC–USNO-A2 cross-association. The quality of the USNO-A2 association catalog is 0.652 , so it appears that the the fraction of the RASS/BSC for which the present method can identify a 2MASS/PSC counterpart is is larger than the fraction of the RASS/BSC for which the previous work could identify a USNO-A2 counterpart. The number of counterparts found in both cross-associations is shown in Table 1 for three different cut-offs. The present work finds 42% more high quality matches than the RASS/BSC–USNO-A2 cross-association, but finds 9% fewer matches. This difference in distribution of values may be due to the use of a different passband (NIR) to search for counterparts, which may be sensitive to different source classes than the optical passband. The difference may also be due to the changes made to ; in particular, the added dependence in is expected to lead to higher values for matches in regions with low NIR source density.
Unlike the RASS/BSC–USNO-A2 cross-association, the present work does not consider binary matches. A RASS/BSC source associated with a pair of 2MASS/PSC sources will typically have , and appear in the catalog as one of the matches.
Of the high quality matches, 1418 are associations that are not listed in the SIMBAD database, and that involve a RASS/BSC source for which a high quality match with a USNO-A2 optical source was not presented in previous work. Excluding associations listed in SIMBAD and those involving a RASS/BSC source for which a high, medium, or low quality USNO-A2 match has been previously been presented, the high quality matches in the catalog include entirely new associations for 113 RASS/BSC sources, the medium quality matches for 113 sources, and the low quality matches for 808 sources.
Several cross-associations with other catalogs are described in the RASS/BSC paper (Voges et al., 1999), and these are compared to based cross-associations in the RASS/BSC–USNO-A2 cross-association . In summary, accounting for source confusion, and not selecting counterparts purely based on proximity, make based catalogs more useful than the previous cross-associations for classifying RASS/BSC sources.
Several of the cross-associations listed in Table 1 rely on plausibility arguments. One such example is a cross association with optical sources (Zickgraf et al., 2003), where each optical source in the RASS/BSC error circle was classified through spectroscopy, and the “most likely” counterpart then assigned to the X-ray source. This approach does not provide a for each match, and relies on previous knowledge of the properties of X-ray emitting source classes. It is therefore unlikely to identify new classes of X-ray sources.
Machine learning algorithms can be employed to make the plausibility method quantitative. One application of machine learning algorithms (McGlynn et al., 2004) used a training sample of previously classified X-ray sources to compute the probability that each RASS/BSC source belongs to a given source class. Machine learning algorithms remove the need to specify the properties of a given class—the algorithms infer class properties from the training sample—and the probability that the RASS/BSC source is of a certain class can be found. However, only previously known classes can be used, and the number of objects of a given class in the training sample limits the ability of the algorithm to find similar objects.
6 DISCUSSION AND CONCLUSIONS
The association catalog presented in §3.1 lists each RASS/BSC source, the corresponding , the most likely 2MASS/PSC counterpart, and the of the RASS/BSC–2MASS/PSC match. The catalog includes 3853 high quality matches (), of which are expected to be chance associations with background objects. Of the high quality matches, only 1921 are with a RASS/BSC source for which a USNO-A2 counterpart has previously been identified . Thus, between the present work and the RASS/BSC–USNO-A2 cross-association, there are 4637 RASS/BSC sources with a optical and/or NIR counterpart. The present work thus represents a significant improvement over previous cross-associations.
The purpose of uniquely associating RASS/BSC and 2MASS/PSC sources is to obtain J-, H-, and K-band fluxes for, and better localization of, RASS/BSC sources, to aid in classification. Certain source classes appear to be restricted to specific ranges of X-ray–J color and J–K color (cf. §4.1), so the X-ray, J-, and K-band fluxes of matches can be used to select interesting objects for precise classification through follow-up observations. Previous classification of the proposed 2MASS/PSC counterpart in a match can also provide RASS/BSC classifications. The present work presents likely new classifications for 1425 previously unclassified RASS/BSC sources, based on the classification of the 2MASS/PSC counterpart.
All the coronally active stars in the RASS/BSC should have counterparts in the 2MASS/PSC (cf. §4.1), so unique association of these RASS/BSC sources with NIR counterparts is confusion limited. For any coronally active stars in the RASS/BSC that do not presently have a known 2MASS/PSC counterpart, better X-ray localizations should allow the 2MASS/PSC counterpart to be found. Further, since the fraction of the RASS/BSC sources that do not have counterparts in the 2MASS/PSC is (cf. §2.1), there are RASS/BSC sources with no NIR counterparts in the 2MASS/PSC catalog. These RASS/BSC sources are likely associated with NIR sources fainter than the 2MASS/PSC detection limit, and represent a sizeable discovery space for classes of X-ray sources other than coronally active stars.
RASS/BSC sources with have no likely 2MASS/PSC counterparts. Some of these sources may be associated with an extended near infra-red source not listed in the 2MASS/PSC, some may be associated with NIR sources too far from the RASS/BSC position to be identified, and some may be NIR faint objects. The number of RASS/BSC sources with is 334, and these provide a sample which can be searched for examples of NIR faint X-ray sources like isolated neutron stars.
References
- Bade et al. (1998) Bade, N. et al. 1998, A&AS, 127, 145
- Bauer et al. (2000) Bauer, F. E., Condon, J. J., Thuan, T. X., & Broderick, J. J. 2000, ApJS, 129, 547
- Cohen et al. (2003) Cohen, M., Wheaton, W. A., & Megeath, S. T. 2003, AJ, 126, 1090
- Cutri et al. (2003) Cutri, R. M. et al. 2003, Explanatory Supplement to the 2MASS All Sky Data Release and Extended Mission Products, http://www.ipac.caltech.edu/2mass/releases/allsky/doc/explsup.html (accessed 2009 April 30)
- Fitzpatrick (1999) Fitzpatrick, E. L. 1999, PASP, 111, 63
- Flesch & Hardcastle (2004) Flesch, E. & Hardcastle, M. J. 2004, A&A, 427, 387
- Güdel (2004) Güdel, M. 2004, A&A Rev., 12, 71
- Huensch et al. (1998) Huensch, M., Schmitt, J. H. M. M., & Voges, W. 1998, A&AS, 132, 155
- Hünsch et al. (1999) Hünsch, M., Schmitt, J. H. M. M., Sterzik, M. F., & Voges, W. 1999, A&AS, 135, 319
- Kalberla et al. (2005) Kalberla, P. M. W., Burton, W. B., Hartmann, D., Arnal, E. M., Bajaja, E., Morras, R., & Pöppel, W. G. L. 2005, A&A, 440, 775
- Makarov & Urban (2000) Makarov, V. V. & Urban, S. 2000, MNRAS, 317, 289
- McGlynn et al. (2004) McGlynn, T. A. et al. 2004, ApJ, 616, 1284
- Predehl & Schmitt (1995) Predehl, P. & Schmitt, J. H. M. M. 1995, A&A, 293, 889
- Press et al. (1992) Press, W. H., Teukolsky, S. A., Vetterling, W. T., & Flannery, B. P. 1992, Numerical recipes in C (Cambridge University Press)
- Rutledge et al. (2000) Rutledge, R. E., Brunner, R. J., Prince, T. A., & Lonsdale, C. 2000, ApJS, 131, 335
- Rutledge et al. (2003) Rutledge, R. E., Fox, D. W., Bogosavljevic, M., & Mahabal, A. 2003, ApJ, 598, 458
- Schild (1977) Schild, R. E. 1977, AJ, 82, 337
- Schwope et al. (2000) Schwope, A. et al. 2000, Astronomische Nachrichten, 321, 1
- Skrutskie et al. (2006) Skrutskie, M. F. et al. 2006, AJ, 131, 1163
- Torres et al. (2006) Torres, C. A. O., Quast, G. R., da Silva, L., de La Reza, R., Melo, C. H. F., & Sterzik, M. 2006, A&A, 460, 695
- Turner et al. (2009) Turner, M., Rutledge, R. E., Letcavage, R., Shevchuk, A. S. H., & Fox, D. B. 2009, ApJS, submitted
- Voges et al. (1999) Voges, W. et al. 1999, A&A, 349, 389
- Wilks (1938) Wilks, S. S. 1938, The Annals of Mathematical Statistics, 9, 60
- Wolstencroft et al. (1986) Wolstencroft, R. D., Savage, A., Clowes, R. G., MacGillivray, H. T., Leggett, S. K., & Kalafi, M. 1986, MNRAS, 223, 279
- Zickgraf et al. (2003) Zickgraf, F.-J., Engels, D., Hagen, H.-J., Reimers, D., & Voges, W. 2003, A&A, 406, 535
- Zimmermann et al. (2001) Zimmermann, H.-U., Boller, T., Döbereiner, S., & Pietsch, W. 2001, A&A, 378, 30


| Reference | Cross-association catalogaaThe catalog that was searched for counterparts, and any restriction on which RASS/BSC sources were considered. | bbThe number of candiate counterparts presented, and the expected background contamination in number and as a percentage of the number of candidate counterparts. | Criteria for association |
|---|---|---|---|
| Huensch et al. (1998) | Bright Star Catalogue | 580 | from X-ray source |
| Bade et al. (1998) | RASS/BSC, | 3847 (n/a) | Plausibility |
| Hamburg Quasar Survey | |||
| Voges et al. (1999) | HST-GSC | 9759 | from X-ray source |
| Hünsch et al. (1999) | Third Catalogue of Nearby Stars | 783 | from X-ray source |
| Bauer et al. (2000) | RASS/BSC , | 1556 | |
| , J2000 | |||
| NVSS | |||
| Makarov & Urban (2000) | Tycho-2 | 6954 (n/a) | from X-ray source |
| Rutledge et al. (2000) | USNO A-2, B objects | 2705 | |
| Rutledge et al. (2000) | USNO A-2, B objects | 5492 | |
| Rutledge et al. (2000) | USNO A-2, B objects | 11301 | |
| Schwope et al. (2000) | RASS/BSC , | 2012 (n/a) | Plausibility |
| NED and SIMBAD | |||
| Optical CCD and spectroscopy | |||
| Zimmermann et al. (2001) | Catalogue of Principal Galaxies | 547 | from X-ray source |
| Visual Inspection | |||
| Zickgraf et al. (2003) | RASS/BSC, | 4380 (n/a) | Plausibility |
| Hamburg Quasar Survey | |||
| McGlynn et al. (2004) | USNO-B | 6915 | from X-ray source |
| NVSS and SUMSS | Machine learning classification | ||
| Torres et al. (2006) | RASS/BSC Southern Hemisphere | 1791 (n/a) | from X-ray source |
| Hipparcos and Tycho-2 | |||
| Present work | 2MASS/PSC, J-band | 3853 | |
| Present work | 2MASS/PSC, J-band | 6133 | |
| Present work | 2MASS/PSC, J-band | 10286 |
| Region | Galactic Latitude | Galactic Longitude | ||||
|---|---|---|---|---|---|---|
| Entire Sky | 41192 | 3.17 | 18806 | 2.85 | ||
| 1 | 9168 | 0.44 | 5194 | 0.44 | ||
| 2 | 17270 | 1.06 | 7767 | 1.06 | ||
| 3 | 2455 | 3.27 | 1049 | 3.00 | ||
| 4 | 4910 | 4.32 | 2036 | 3.98 | ||
| 5 | 4932 | 9.12 | 1731 | 8.90 | ||
| 6 | 2457 | 13.93 | 1029 | 14.22 |
| 1RXS | 1RXS SIMBAD Type | PSPC c/s () | 2MASS | 2MASS SIMBAD Type | |||
|---|---|---|---|---|---|---|---|
| J000000.0392902 | X-ray source | 0.13 (0.03) | 0.654 | J000004253929005 | 11.5 | 0.134 | |
| J000007.0081653 | Galaxy | 0.19 (0.02) | 0.324 | J000007020816453 | 13.9 | 0.670 | |
| J000010.0633543 | Seyfert 1 Galaxy | 0.19 (0.03) | 0.449 | J000009816335383 | 16.7 | 0.352 | |
| J000011.9052318 | Seyfert 1 Galaxy | 0.26 (0.03) | 0.266 | J000011720523175 | 14.4 | 0.680 | |
| J000012.6014621 | X-ray source | 0.08 (0.02) | 0.008 | J000012170146173 | Double or multiple star | 8.3 | 0.991 |
| J000013.5575628 | Star | 0.12 (0.02) | 0.029 | J000013465756387 | 9.8 | 0.960 | |
| J000019.5261032 | X-ray source | 0.12 (0.02) | 0.329 | J000019162610283 | 15.5 | 0.347 | |
| J000035.5280553 | X-ray source | 0.07 (0.02) | 0.395 | J000034842805459 | 12.9 | 0.474 | |
| J000038.4794037 | Star | 0.10 (0.01) | 0.009 | J000041217940398 | Star | 8.9 | 0.966 |
| J000042.5621034 | Star | 0.16 (0.02) | 0.006 | J000041676210331 | Star | 6.1 | 0.989 |
Note. — The association catalog is available in machine readable format in the electronic edition of The Astrophysical Journal. A portion of the catalog is shown here for guidance regarding its form and content.
| Total | Associated | Total | ClassifiedaaSources with a listed type other than ’X-ray source’ or ’Infra-Red source’. | UnclassifiedbbSources not listed in SIMBAD, and sources listed as ’X-ray source’ or ’Infra-Red source’. | |
|---|---|---|---|---|---|
| in SIMBAD? | |||||
| 3853 | Yes | 1204 | 1186 | 18 | |
| No | 2649 | 1464 | 1185 | ||
| 6133 | Yes | 1579 | 1538 | 41 | |
| No | 4554 | 2143 | 2411 | ||
| 10286 | Yes | 2122 | 2057 | 65 | |
| No | 8164 | 2725 | 5439 | ||
| 18568 | Yes | 2609 | 2500 | 109 | |
| No | 15959 | 3386 | 12573 |
| Source type in SIMBAD | bbFraction of 2MASS/PSC counterparts of a given class that are high quality matches. | |||||||||
|---|---|---|---|---|---|---|---|---|---|---|
| Total | Newaa2MASS/PSC counterparts that are not associated with the RASS/BSC source in SIMBAD. | Total | Newaa2MASS/PSC counterparts that are not associated with the RASS/BSC source in SIMBAD. | Total | Newaa2MASS/PSC counterparts that are not associated with the RASS/BSC source in SIMBAD. | Total | Newaa2MASS/PSC counterparts that are not associated with the RASS/BSC source in SIMBAD. | Total | Newaa2MASS/PSC counterparts that are not associated with the RASS/BSC source in SIMBAD. | |
| Active Galaxy Nucleus | 0 | 0 | 0 | 0 | 7 | 5 | 46 | 41 | 0.00 | 0.00 |
| Be Star | 4 | 2 | 5 | 3 | 5 | 3 | 5 | 3 | 0.80 | 0.40 |
| BL Lac - type object | 0 | 0 | 0 | 0 | 2 | 0 | 11 | 0 | 0.00 | 0.00 |
| Blazar | 0 | 0 | 0 | 0 | 0 | 0 | 1 | 0 | 0.00 | 0.00 |
| Blue object | 0 | 0 | 0 | 0 | 2 | 1 | 4 | 3 | 0.00 | 0.00 |
| Brown Dwarf () | 0 | 0 | 0 | 0 | 1 | 0 | 1 | 0 | 0.00 | 0.00 |
| Carbon Star | 0 | 0 | 0 | 0 | 1 | 0 | 1 | 0 | 0.00 | 0.00 |
| Cataclysmic Var. AM Her type | 0 | 0 | 0 | 0 | 12 | 0 | 22 | 0 | 0.00 | 0.00 |
| Cataclysmic Var. DQ Her type | 1 | 0 | 1 | 0 | 8 | 0 | 9 | 0 | 0.11 | 0.00 |
| Cataclysmic Variable Star | 0 | 0 | 1 | 0 | 3 | 0 | 17 | 7 | 0.00 | 0.00 |
| Cepheid variable Star | 6 | 0 | 9 | 1 | 9 | 1 | 10 | 2 | 0.60 | 0.00 |
| Classical Cepheid (delta Cep type) | 1 | 1 | 1 | 1 | 1 | 1 | 1 | 1 | 1.00 | 1.00 |
| Double or multiple star | 177 | 127 | 219 | 159 | 242 | 177 | 252 | 184 | 0.70 | 0.50 |
| Dwarf Nova | 0 | 0 | 3 | 0 | 30 | 4 | 45 | 12 | 0.00 | 0.00 |
| Eclipsing binary | 7 | 2 | 7 | 2 | 9 | 3 | 9 | 3 | 0.78 | 0.22 |
| Eclipsing Binary Candidate | 1 | 0 | 1 | 0 | 1 | 0 | 1 | 0 | 1.00 | 0.00 |
| Eclipsing binary of Algol type | 37 | 18 | 43 | 20 | 51 | 26 | 51 | 26 | 0.73 | 0.35 |
| Eclipsing binary of beta Lyr type | 27 | 17 | 33 | 22 | 37 | 25 | 37 | 25 | 0.73 | 0.46 |
| Eclipsing binary of W UMa type | 30 | 4 | 40 | 6 | 45 | 8 | 45 | 8 | 0.67 | 0.09 |
| Ellipsoidal variable Star | 4 | 3 | 6 | 4 | 6 | 4 | 6 | 4 | 0.67 | 0.50 |
| Emission-line galaxy | 0 | 0 | 0 | 0 | 0 | 0 | 3 | 2 | 0.00 | 0.00 |
| Emission-line Star | 15 | 6 | 21 | 9 | 23 | 10 | 23 | 10 | 0.65 | 0.26 |
| Flare Star | 99 | 28 | 147 | 52 | 168 | 63 | 173 | 64 | 0.57 | 0.16 |
| Galaxy in Cluster of Galaxies | 0 | 0 | 0 | 0 | 0 | 0 | 1 | 1 | 0.00 | 0.00 |
| Globular Cluster | 0 | 0 | 0 | 0 | 1 | 0 | 2 | 0 | 0.00 | 0.00 |
| Herbig-Haro Object | 1 | 1 | 1 | 1 | 1 | 1 | 1 | 1 | 1.00 | 1.00 |
| High Mass X-ray Binary | 3 | 0 | 9 | 0 | 15 | 0 | 16 | 0 | 0.19 | 0.00 |
| High proper-motion Star | 286 | 184 | 392 | 264 | 477 | 337 | 493 | 353 | 0.58 | 0.37 |
| Low Mass X-ray Binary | 1 | 0 | 1 | 0 | 2 | 0 | 5 | 0 | 0.20 | 0.00 |
| Low-mass star () | 0 | 0 | 1 | 0 | 4 | 3 | 10 | 9 | 0.00 | 0.00 |
| Nova | 0 | 0 | 1 | 0 | 2 | 0 | 2 | 0 | 0.00 | 0.00 |
| Nova-like Star | 2 | 0 | 3 | 0 | 6 | 0 | 10 | 2 | 0.20 | 0.00 |
| Object of unknown nature | 0 | 0 | 0 | 0 | 0 | 0 | 2 | 2 | 0.00 | 0.00 |
| Planetary Nebula | 0 | 0 | 1 | 0 | 1 | 0 | 1 | 0 | 0.00 | 0.00 |
| Possible Quasar | 0 | 0 | 0 | 0 | 0 | 0 | 6 | 0 | 0.00 | 0.00 |
| Pre-main sequence Star (optically detected) | 15 | 1 | 44 | 3 | 64 | 10 | 71 | 10 | 0.21 | 0.01 |
| Pulsating variable Star | 9 | 3 | 11 | 4 | 11 | 4 | 12 | 5 | 0.75 | 0.25 |
| Quasar | 0 | 0 | 1 | 0 | 161 | 65 | 718 | 401 | 0.00 | 0.00 |
| Rotationally variable Star | 12 | 4 | 12 | 4 | 13 | 4 | 14 | 4 | 0.86 | 0.29 |
| Semi-regular pulsating Star | 15 | 8 | 15 | 8 | 16 | 8 | 16 | 8 | 0.94 | 0.50 |
| Seyfert 1 Galaxy | 0 | 0 | 1 | 0 | 135 | 10 | 304 | 61 | 0.00 | 0.00 |
| Seyfert Galaxy | 0 | 0 | 0 | 0 | 1 | 0 | 2 | 0 | 0.00 | 0.00 |
| Spectroscopic binary | 163 | 86 | 185 | 100 | 205 | 111 | 207 | 113 | 0.79 | 0.42 |
| Star | 1099 | 772 | 1586 | 1190 | 1875 | 1439 | 2024 | 1580 | 0.54 | 0.38 |
| Star in Association | 2 | 1 | 7 | 3 | 10 | 5 | 12 | 7 | 0.17 | 0.08 |
| Star in Cluster | 41 | 18 | 60 | 29 | 65 | 30 | 71 | 35 | 0.58 | 0.25 |
| Star in double system | 67 | 44 | 104 | 77 | 208 | 155 | 222 | 168 | 0.30 | 0.20 |
| Star in Nebula | 0 | 0 | 0 | 0 | 1 | 1 | 2 | 2 | 0.00 | 0.00 |
| SuperNova | 0 | 0 | 0 | 0 | 1 | 1 | 1 | 1 | 0.00 | 0.00 |
| SuperNova Remnant | 0 | 0 | 0 | 0 | 0 | 0 | 1 | 1 | 0.00 | 0.00 |
| Symbiotic Star | 4 | 3 | 5 | 4 | 7 | 4 | 7 | 4 | 0.57 | 0.43 |
| T Tau-type Star | 94 | 2 | 185 | 12 | 238 | 15 | 247 | 17 | 0.38 | 0.01 |
| UV-emission source | 0 | 0 | 0 | 0 | 0 | 0 | 2 | 2 | 0.00 | 0.00 |
| Variable of BY Dra type | 79 | 35 | 91 | 41 | 107 | 49 | 109 | 51 | 0.72 | 0.32 |
| Variable of RS CVn type | 110 | 16 | 123 | 19 | 136 | 24 | 136 | 24 | 0.81 | 0.12 |
| Variable Star | 198 | 61 | 249 | 80 | 278 | 87 | 283 | 90 | 0.70 | 0.22 |
| Variable Star of alpha2 CVn type | 2 | 0 | 2 | 0 | 2 | 0 | 3 | 1 | 0.67 | 0.00 |
| Variable Star of beta Cep type | 5 | 2 | 7 | 3 | 7 | 3 | 7 | 3 | 0.71 | 0.29 |
| Variable Star of delta Sct type | 7 | 5 | 7 | 5 | 8 | 6 | 8 | 6 | 0.88 | 0.62 |
| Variable Star of gamma Dor type | 6 | 2 | 6 | 2 | 7 | 3 | 7 | 3 | 0.86 | 0.29 |
| Variable Star of irregular type | 5 | 5 | 6 | 5 | 6 | 5 | 6 | 5 | 0.83 | 0.83 |
| Variable Star of Mira Cet type | 1 | 0 | 2 | 1 | 2 | 1 | 2 | 1 | 0.50 | 0.00 |
| Variable Star of Orion Type | 3 | 2 | 8 | 4 | 14 | 7 | 19 | 9 | 0.16 | 0.11 |
| Variable Star of RR Lyr type | 0 | 0 | 2 | 1 | 3 | 1 | 4 | 2 | 0.00 | 0.00 |
| Variable Star of W Vir type | 1 | 0 | 1 | 0 | 1 | 0 | 1 | 0 | 1.00 | 0.00 |
| Variable Star with rapid variations | 1 | 0 | 1 | 0 | 1 | 0 | 1 | 0 | 1.00 | 0.00 |
| White Dwarf | 4 | 1 | 5 | 1 | 18 | 2 | 31 | 5 | 0.13 | 0.03 |
| Wolf-Rayet Star | 3 | 0 | 5 | 1 | 5 | 1 | 5 | 1 | 0.60 | 0.00 |
| X-ray Binary | 1 | 0 | 1 | 0 | 1 | 0 | 4 | 0 | 0.25 | 0.00 |
| Young Stellar Object | 1 | 0 | 3 | 2 | 3 | 2 | 4 | 2 | 0.25 | 0.00 |
| Young Stellar Object Candidate | 0 | 0 | 0 | 0 | 0 | 0 | 1 | 1 | 0.00 | 0.00 |
| All Classes | 2650 | 1464 | 3681 | 2143 | 4782 | 2725 | 5886 | 3386 | 0.45 | 0.25 |