Resolved Spectroscopy of Gravitationally-Lensed Galaxies: Recovering Coherent Velocity Fields in Sub-Luminous z2–3 Galaxies
Abstract
We present spatially-resolved dynamics for six strongly lensed star-forming galaxies at –3.1, each enlarged by a linear magnification factor 8. Using the Keck laser guide star AO system and the OSIRIS integral field unit spectrograph we resolve kinematic and morphological detail in our sample with an unprecedented fidelity, in some cases achieving spatial resolutions of 100 pc. With one exception our sources have diameters ranging from 1–7 kpc, integrated star formation rates of (uncorrected for extinction) and dynamical masses of . With this exquisite resolution we find that four of the six galaxies display coherent velocity fields consistent with a simple rotating disk model. Our model fits imply ratios for the systemic to random motion, , ranging from 0.5–1.3 and Toomre disk parameters . The large fraction of well-ordered velocity fields in our sample is consistent with data analyzed for larger, more luminous sources at this redshift. We demonstrate that the apparent contradiction with earlier dynamical results published for unlensed compact sources arises from the considerably improved spatial resolution and sampling uniquely provided by the combination of adaptive optics and strong gravitational lensing. Our high resolution data further reveal that all six galaxies contain multiple giant star-forming Hii regions whose resolved diameters are in the range 300 pc – 1.0 kpc, consistent with the Jeans length expected in the case of dispersion support. From the kinematic data we calculate that these regions have dynamical masses of , also in agreement with local data. However, the density of star formation in these regions is 100 higher than observed in local spirals; such high values are only seen in the most luminous local starbursts. The global dynamics and demographics of star formation in these Hii regions suggest that vigorous star formation is primarily governed by gravitational instability in primitive rotating disks. The physical insight provided by the combination of adaptive optics and gravitational lensing suggests it will be highly valuable to locate many more strongly-lensed distant galaxies with high star formation rates before the era of the next-generation ground-based telescopes when such observations will become routine.
keywords:
galaxies: evolution – galaxies: formation – galaxies: high-redshift1 Introduction
Studies of star-forming galaxies at high redshift () over the past decade have mapped the demographics of the populations as a whole yielding valuable data on their integrated star formation rates, stellar and dynamical masses, metallicities and morphologies (Shapley et al., 2001, 2003; Reddy & Steidel, 2004; Erb et al., 2006; Law et al., 2007a). From these data, a consistent picture of the development of the comoving density of star formation and its contribution to the present day stellar density has emerged (Dickinson et al., 2003; Hopkins & Beacom, 2006). Following a rapid rise in activity at early times, corresponding to the redshift range , the star formation rate has decline markedly over the past 8 Gyr corresponding to the interval . Of particular interest is the relationship between sources observed at the time close to the peak epoch of star formation, and the population of massive galaxies observed today.
Recent theoretical work has focused on the mechanisms via which early galaxies assemble their stars and evolve morphologically to the present day Hubble sequence. Minor mergers and cold stream gas accretion have emerged as a possible means of building disks, central bulges and elliptical galaxies from early star forming Lyman break galaxies (Dekel et al., 2009; Brooks et al., 2009). These models of galaxy evolution rely on simple descriptions of complex physical processes such as gas cooling, star formation and feedback mechanisms. It is therefore crucial to undertake relevant observations to constrain these processes. The most direct observational route to making progress is high quality resolved spectro-imaging of early galaxies which can be used to determine both their dynamical state and the distribution of star-formation.
Integral field unit (IFU) spectroscopy of nebular emission lines is now yielding valuable kinematic data for a growing sample of luminous high-redshift star forming galaxies (Genzel et al., 2006, 2008; Förster Schreiber et al., 2006, 2009; Law et al., 2007b, 2009). Although the galaxies observed so far do not yet in any way constitute a complete well-defined sample, some important results have emerged. The data reveal a mix of dispersion-dominated systems, rotating systems, and major mergers with the common observation that all galaxies studied so far show relatively high velocity dispersions of km s-1. A larger fraction of the more massive () galaxies appear to be rotationally supported, with lower mass galaxies () tending to have dispersion-dominated kinematics (Law et al., 2009).
However, these studies are hampered by the poor spatial resolution inherent in studies of distant star-forming galaxies whose typical sizes are –5 kpc. Even with adaptive optics on a 8–10 meter aperture, the physical resolution is limited to FWHM kpc which means only a few independent resolution elements. Consequently it is unclear whether the velocity shear observed in the smaller 2–5 kpc sources arises from rotation or merging. Moreover, although there are suggestions that distant star-forming regions have sizes much larger than those of local Hii regions (Elmegreen & Elmegreen, 2005), the claim remains uncertain since the distant regions are not properly resolved. Thus, the diffraction limit of the current generation of optical/infrared telescopes limits progress, even with all the adaptive optics tools of the trade.
Fortunately, sources which undergo strong gravitational lensing are enlarged as seen by the observer and can thus be studied at much higher physical resolution in their source plane (Nesvadba et al., 2006; Swinbank et al., 2007). This improvement in physical resolution enables us to better distinguish various forms of velocity field and to examine the properties of star-forming giant Hii regions. A convincing demonstration of the benefits of lensing as applied to this topic was the work of Stark et al. (2008) which analyzed IFU data on a galaxy magnified in area by a factor of 28 demonstrating resolved dynamics on 100 pc scales. This represents an order of magnitude improved sampling compared to the earlier studies cited above.
Here we present IFU observations of a further five strongly lensed galaxies which we add to the source studied by Stark et al. (2008). In addition to studying the well-sampled kinematic structure of a population of sub-L∗ star-forming galaxies at , our fine resolution allows us to examine the size, dynamical mass, and luminosity of typical star-forming regions, thereby probing the conditions in which most of the star formation takes place. We find that all of our galaxies contain multiple, distinct star forming regions. These results offer a preview of the science which will be possible with 30 meter class optical/near-IR telescopes with a diffraction limit comparable to the resolution of our data; they provide the most detailed view to date of typical high-redshift star forming galaxies.
A plan of the paper follows. In 2 we discuss our selection of targets and Keck observations, including the production and use of gravitational lens modeling essential for achieving a high resolution in the source plane. In 3 we analyze our spectroscopic results, discussing each object in turn and summarizing the kinematic data. In 4 we examine the physical scale of our star forming regions in comparison to those seen locally. We summarize our conclusions in 5. Throughout we use a WMAP cosmology (Spergel et al., 2003) with =0.73, =0.27, and H0=72 km s-1 Mpc-1. All quoted magnitudes are in the AB system unless otherwise noted.
2 Observations and Data Reduction
2.1 Target Selection
Ideally, in considering the selection of high redshift galaxies for more detailed resolved studies, care would be taken to construct a mass-limited sample, perhaps defined additionally according to the integrated or specific star formation rate. In practice, even with 10 meter class telescopes, studies are limited by the surface brightness distribution of gaseous emission lines as discussed by earlier workers (Genzel et al., 2006, 2008; Förster Schreiber et al., 2006, 2009; Law et al., 2007b, 2009). In examining gravitationally-lensed systems, which have the unique advantages of probing to less luminous (and presumably more typical) systems, and offering an increased spatial resolution in the source plane, an additional criterion is the reliability of the mass model used to invert the observed data into that of the source plane.
Over the past decade, using the growing archive of HST ACS and WFPC-2 images of rich clusters (e.g. Santos et al. 2004; Sand et al. 2005; Stark et al. 2007) and through specific projects such as the MAssive Cluster Survey (MACS, Ebeling et al. 2001) and Local Cluster Substructure Survey (LoCuSS, Smith et al. 2005), we have studied a large sample of lensing clusters and undertaken a search within these HST images for promising magnified galaxies (arcs) at high redshift. The clusters presented herein do not in any way represent a well-defined sample and, inevitably, there are biases to those which act as spectacular gravitational lenses.
The distant sources described here were located and assessed via two sequential programs. Firstly, a comprehensive multi-object spectroscopic campaign involving Keck and the VLT was used to verify the redshift of the candidate arcs as well as to determine the redshifts of other multiply-imaged sources in each cluster in order to construct robust mass models (e.g. Richard et al. 2007). As the follow-up spectroscopy was undertaken at optical wavelengths, for those sources beyond 2, this provided valuable insight into the strength and distribution of Ly emission. However, as with previous work (e.g. Shapley et al. 2003) we found that the Ly line did not necessarily give a good indication of the relative strengths and extended nature of those nebular emission lines ([Oii], H, [Oiii], H) critical for resolved studies with laser guide-star assisted adaptive optics (LGSAO). Accordingly, we used the Keck II spectrograph, NIRSPEC, in seeing limited mode in a second campaign to ‘screen’ all promising targets in advance of undertaking the more demanding resolved studies with the LGSAO-fed integral field unit spectrograph OSIRIS. Once the redshift of the lensed source was known from optical spectroscopy, we usually followed up the source in more than one near-infrared line, in order to ascertain which would be the most economic tracer of the velocity field.
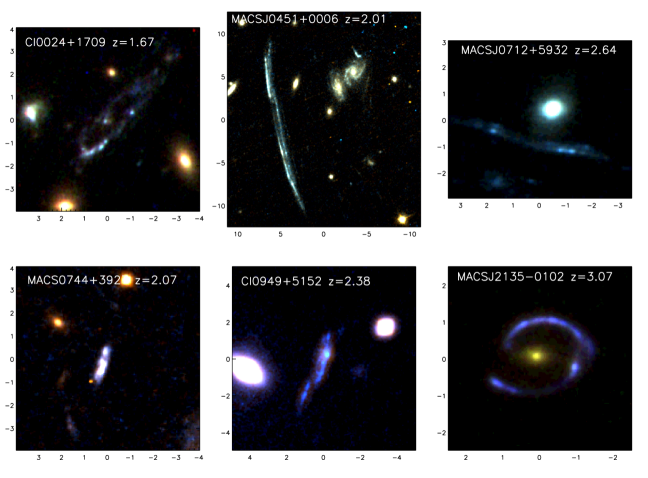
About 75% of our initial sample of 30 arcs have so far been screened and have suitably close reference stars for tip-tilt correction. In order to achieve an adequate signal to noise with OSIRIS, we used the NIRSPEC data to limit the sample to those with an emission line surface brightness erg s-1cm-2arcsec-2 in a region uncontaminated by night sky emission. As a guide, this surface brightness criterion corresponds to a SFR density yr-1kpc-2 for H at . Our sample of 6 sources is drawn from a list of objects fulfilling these criteria. A full account of the NIRSPEC screening program and a discussion of the distribution of line strengths found in that survey is given by Richard et al. (2009). Key properties for the sample of 6 objects, which includes the source discussed by Stark et al. (2008), are given in Table 1. The ACS images of our lensed targets are given in Figure 1 and we briefly discuss these below.
Cl0024+1654 Deep optical and near-infrared imaging of the cluster Cl 0024+1654 with HST reveals five distinct images of a background galaxy originally identified by its blue color and clumpy ring-like morphology (Colley et al. 1996, Figure 1). Optical spectroscopy established a redshift of from interstellar absorption lines (Broadhurst et al., 2000). Near-infrared spectroscopy shows bright, spatially extended H emission at (Richard et al. 2009). To map the velocity field, we observed the counter image northwest of the cluster with OSIRIS around the redshifted H and [Nii]6583 emission.
MACS0451+0006 The HST ACS - and -band imaging of MACSJ0451+0006 shows a striking, multiply-imaged arc 30 arcseconds east of the brightest cluster galaxy (Figure 1). Follow-up spectroscopy with the FORS multi-object spectrograph on the VLT confirmed a redshift of via the identification of Ly and UV ISM absorption lines (Siii1260, Oi1303, Civ1549 and Siiv1400) and Heii1640 and Ciii]1908.7 in emission (PID: 078.A-0420). Follow-up observations targeting the nebular H emission with the NIRSPEC longslit spectrograph on Keck II showed strong, spatially extended H at a redshift of 2.01390.0001 (Richard et al., 2009).
MACS J0712+5932 HST - and -band imaging of MACS J0712+5932 reveals a prominent triply-imaged background galaxy. Each of the galaxy images clearly comprises two prominent clumps with at least one fainter region with surface brightness mags arcsec-2 within a diffuse halo (Figures 1,2). Follow-up near-infrared spectroscopy (Richard et al., 2009) shows strong nebular H, H, and [Oiii] emission at , concentrated in the UV-bright regions.
MACS J0744+3927 HST - and -band imaging of MACS J0744+3927 reveals an arc approximately 15 west of the cluster center. The optical redshift obtained via identification of strong Ly absorption and multiple rest-frame UV absorption lines was later confirmed by the detection of strong H and [Nii] emission at with NIRSPEC.
Cl0949+5153 The HST -band image of Cl 0949+5153 shows a clumpy, elongated arc resolved into two diffuse components (Figure 1). Further spectroscopy around the redshifted nebular emission lines shows extended H, H and [Oiii] emission at .
MACS J2135-0102 For completeness, we also include in our sample discussion of the velocity field of the lensed Lyman Break Galaxy (LBG) at in MACS J2135-0102 (also known as the “Cosmic Eye” due to its lensed morphology; Stark et al. 2008). Multi-wavelength studies have shown that the source is a L∗ Lyman-break galaxy with a stellar age of 80–300 Myr, star formation rate of SFR = 40–60 , and stellar mass of M (Coppin et al., 2007; Siana et al., 2009).
2.2 OSIRIS Observations and Data Reduction
Detailed 2-D spectroscopic observations of the targets listed in Table 1 were made with the near-infrared integral field spectrograph OSIRIS (Larkin et al., 2006) on the 10 meter Keck II telescope using the laser guide star adaptive optics (LGSAO) system (Wizinowich et al., 2006) to correct for atmospheric distortion. A suitably bright star () within of the target was used for tip-tilt correction. We used the 100 milli-arcsecond pixel scale in all observations which provides a field of view of at least 3.26.4. Narrow band and filters (Table 1) were selected to target the H or [Oiii] emission line at a spectral resolution , corresponding to FWHM Å in the K band. MACS J2135-0102 and MACS J0451+0006 were observed on 2007 September 02 and 03 whilst the remaining targets were observed between 2008 November 27 – 30.
All observations were taken in seeing. Before observing each arc, we took short exposures of the tip-tilt reference star to center the IFU pointing. The tip-tilt exposures were also used for flux calibration and to calculate the point spread function. Gaussian fits to the point spread functions of the tip-tilt stars yield 0.13–0.20 FWHM resolution for the 100 milliarcsecond pixel scale. With smaller pixel scales, the resolution delivered by the LGSAO system was 0.11 FWHM. Observations of each target were done in a standard ABBA position sequence to achieve good sky subtraction. In the case of Cl0024+1709 we chopped 8 to sky, whilst in the remaining cases we chopped the galaxy within the IFU. Individual exposures were 600–900 seconds and each observing block was 2.4–3.6 ks which was typically repeated three to six times. The total integration time for each object is given in Table 1.
Our data reduction methods closely followed those described in detail by Stark et al. (2008). We used the OSIRIS data reduction pipeline (Larkin et al., 2006) to perform sky subtraction, spectral extraction, wavelength calibration, and form the data cube. To accurately combine the individual data cubes, we created images of the integrated emission line and used the peak intensity to centroid the object. We then spatially aligned and co-added the individual data cubes to create the final mosaic. Flux calibration was performed by equating the flux density of the tip-tilt stars measured from 2MASS photometry with the observed OSIRIS spectra. We estimate that the uncertainty in flux calibration is typically 10%.
Table 1.
Target List
| Name | texp | Emission lines | FWHM | HST ACS | |||||
|---|---|---|---|---|---|---|---|---|---|
| ∘ | (ks) | and OSIRIS filter | (pc) | photometry | |||||
| Cl 0024+1709 | 00 26 34.43 | +17 09 55.4 | 1.680 | 16.5 | H, [Nii]; Hn5 | 0.8 1.7 | 820 | B,V,r,i,z | |
| MACS J0451+0006 | 04 51 57.27 | +00 06 20.7 | 2.014 | 14.4 | H, [Nii]; Kn1 | 1.3 37.0 | 60 | V,I | |
| MACS J0712+5932 | 07 12 17.51 | +59 32 16.3 | 2.648 | 16.2 | H, [Nii]; Kc5 | 1.5 18.7 | 90 | V,I | |
| MACS J0744+3927 | 07 44 47.82 | +39 27 25.7 | 2.209 | 14.4 | H, [Nii]; Kn2 | 1.9 8.6 | 310 | V,I | |
| Cl0949+5153 | 09 52 49.78 | +51 52 43.7 | 2.394 | 19.2 | [Oiii]; Hn4 | 1.2 6.0 | 350 | V | |
| MACS J2135-0102 | 21 35 12.73 | -01 01 43.0 | 3.074 | 21.6 | H, [Oiii]; Kn1 | 3.5 8.0 | 120 | V,I |
2.3 Gravitational Lens Modeling
In order to investigate the source plane properties we must first correct for the distortion and magnification by the cluster lens. We summarize here the ingredients necessary to construct the relevant cluster mass models. We will follow the methodology defined by earlier relevant articles (Kneib et al., 1993, 1996; Smith et al., 2005; Jullo et al., 2007) within which further details can be found.
Our basic approach is to use the code Lenstool111http://www.oamp.fr/cosmology/lenstool (Kneib et al., 1993; Jullo et al., 2007) to constrain a parameterized model of the dark matter distribution. For each cluster, the model comprises two components: 1 or 2 cluster-scale dark matter halos, parametrized with a dual pseudo-isothermal elliptical mass distribution (dPIE, Elíasdóttir et al. 2007), and 50 galaxy-scale dPIE dark matter halos, centered on massive cluster members occupying the strong lensing region in order to account for the presence of substructure. These galaxy-scale halos are assumed to have mass properties that follow a scaling relation based on the luminosity of the underlying galaxy, assuming a constant mass-to-light ratio (e.g. Smith et al. 2005).
Details on the construction of each gravitational lens model are given in Dye et al. (2007) for MACS J2135-0102, Limousin et al. (2009) for Cl0024+1709 and MACS J0744+3927 and Richard et al. (2009) for the remaining 3 sources in Table 1. Strong lensing constraints originate from the identification of 2-5 multiply-imaged systems per cluster within the various ACS images. We use the astrometric positions and spectroscopic/photometric redshifts of these sources222Spectroscopic redshifts are available for a majority of the systems as individual constraints to derive best fit parameters on the mass distribution. Lenstool uses a Markov Chain Monte Carlo (MCMC) sampler to derive a family of mass models suitably fitting the strong lensing constraints, and we use these to derive the uncertainty on each parameter of the mass distribution.
For each of the sources presented in this paper, the best model was then used to derive the geometrical transformation necessary for mapping the source plane coordinates into the image plane. This transformation enables us to reconstruct the HST morphology and H emission line images in the source plane assuming conservation of surface brightness. The spot magnification and its associated error are computed with Lenstool at different positions across the object, using the family of mass models from the MCMC sampler. We can verify this value by computing the total magnification from the ratio of the sizes (or equivalently, the total fluxes) between the image and its source plane reconstruction. As the magnification factor is not isotropic, the angular size of each image is more highly stretched along a specific orientation (Figure 1) thus affecting our source plane resolution. The linear factors and of the magnification (with ) together with their associated errors are listed in Table 1. A detailed illustration of the uncertainties of the mass modeling method for MACS J2135-0102 is given in Stark et al. (2008).
A key parameter in our analysis is the physical resolution we achieve in the source plane for each target. To measure this, we use observations of the tip-tilt reference stars. These serve this purpose well as they are point sources observed with conditions and an instrumental configuration identical to those of our distant targets. We “reconstruct” these stars in the source plane as if they were located at the arc position using the same transformation as for the lensed galaxies, and fit a bivariate Gaussian to the point spread function in order to determine the source plane resolution. The typical FWHM of each arc in the direction of highest magnification is listed in Table 1 and, with the exception of Cl0024+1709 which is not highly-magnified, varies from 60–350 pc with a mean of 200 pc.
3 Analysis
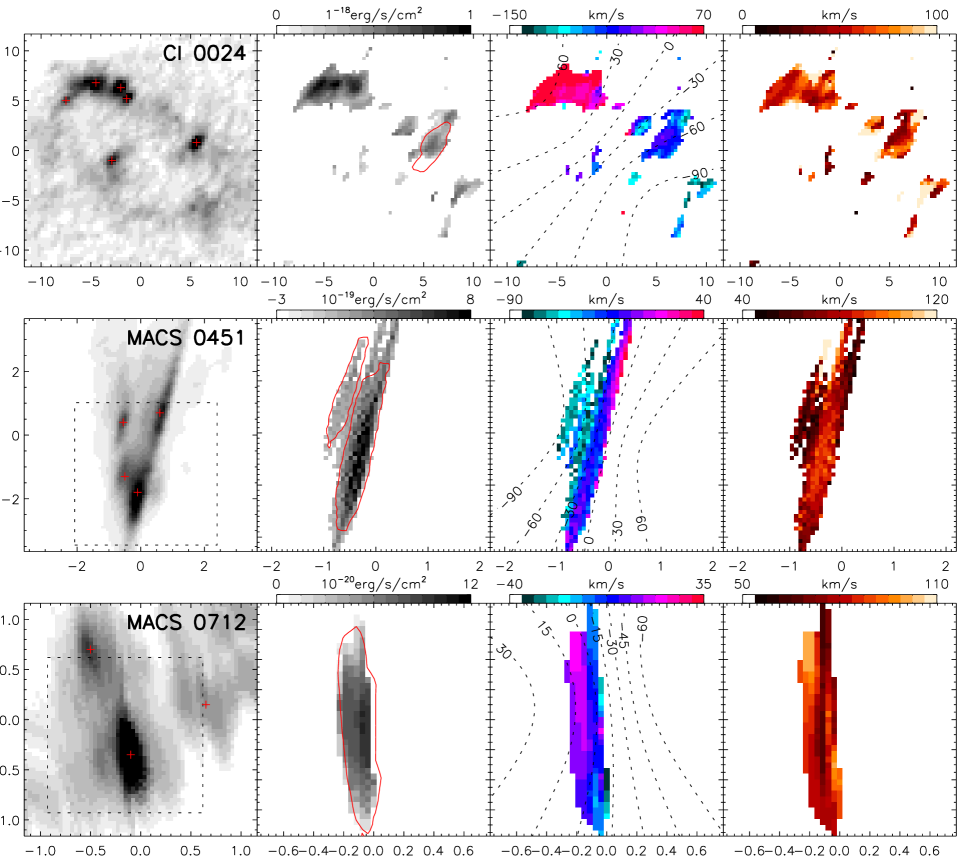
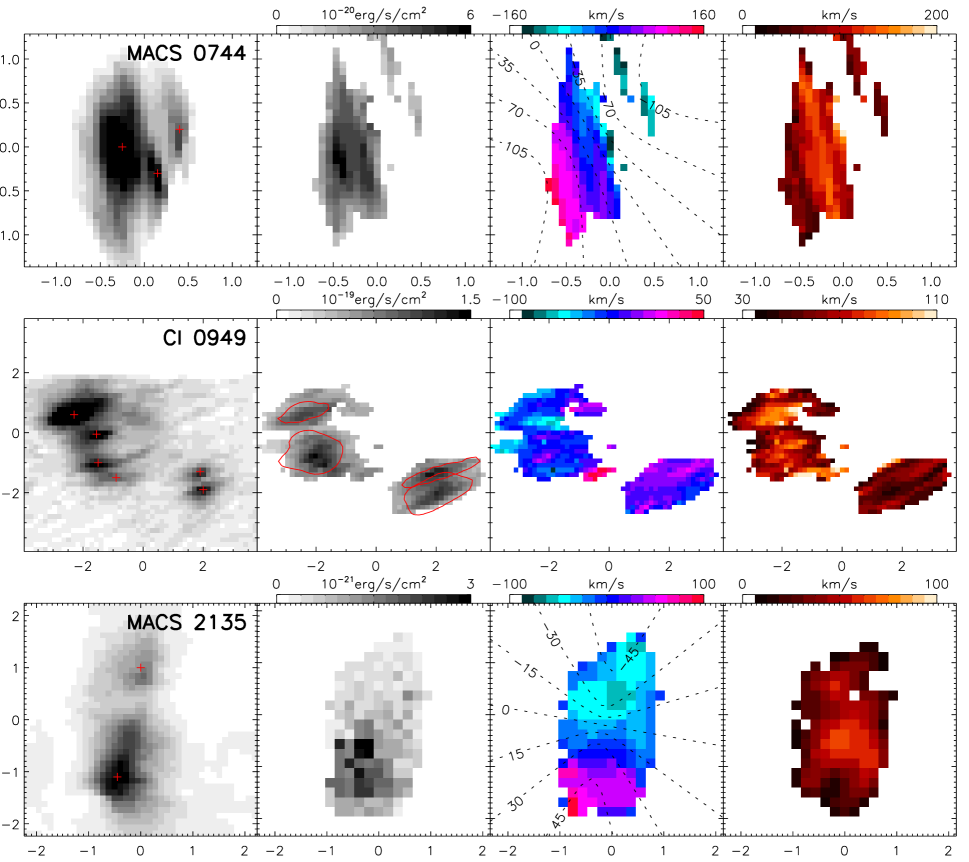
First, we reconstruct the reduced, flux-calibrated data cubes to the source plane using transformations from the gravitational lens models described in §2.3. The resulting data cubes were binned such that each spatial pixel corresponded to 0.5–1 FWHM resolution elements along the direction of highest magnification (Table 1). We fit Gaussian profiles to the strongest emission line (H or [Oiii]) at each spatial pixel using a weighted minimization procedure and determine the two-dimensional intensity, velocity, and velocity dispersion maps. To compute the emission line fits we first subtracted the median value at each spatial pixel to remove any source continuum and residual sky background. A blank region of sky within each data cube was used to determine the sky variance spectrum . The spectra to be fit are weighted by appropriate for Gaussian noise, so that regions of higher noise (e.g. strong sky emission lines) do not cause spurious fits. We compute the statistic for the best-fit Gaussian as well as a for a featureless spectrum () and require a minimum improvement over the fit with no line of –25 for the various arcs (i.e. 4–5 emission line detection). If this criterion was not met, we averaged the surrounding 33 spatial pixels to achieve higher signal-to-noise. No fit was made if the 33 averaging still failed to produce the minimum improvement. We calculated the formal 1 error bounds by perturbing the Gaussian fit parameters until the increases by 1 from the best-fit value. In all following sections, we have deconvolved the line widths with the instrumental resolution () by subtracting the instrumental resolution in quadrature from the best-fit Gaussian . The resulting source plane intensity, velocity, and dispersion fields for the entire sample are shown in Figure 2 and demonstrate detailed kinematic and morphological properties on scales down to 100–200 pc.
From the source plane nebular emission line intensity and dynamics we estimate the size, dispersion and dynamical mass of each galaxy. The size is calculated as the maximum diameter from pixels with successful emission line fits, roughly equivalent to a major axis diameter with limiting isophote erg s-1 cm-2 arcsec-2. The uncertainty is dominated by errors in the lensing magnification and is %. We estimate the global average velocity dispersion of each galaxy as the flux-weighted mean of the fit pixels, with typical uncertainty of % estimated from errors in the fit parameters and the spread of in individual pixels. This measurement of the dispersion is not affected by resolved velocity gradients. The six galaxies in our sample all have large , which is consistent with other resolved observations of non-lensed galaxies at (e.g. Förster Schreiber et al. 2009; Law et al. 2009; Lehnert et al. 2009)
3.1 Kinematic Modeling
To test whether the kinematics of each galaxy are consistent with a rotating system, and to estimate the inclination of any disks, we construct and fit simple disk models to the observed velocity fields. The disk model for MACS J2135-0102 is discussed in detail by Stark et al. (2008), and we follow a similar method for the rest of the sample. We use an arctangent function to estimate the circular velocity as a function of radius,
| (1) |
which Courteau (1997) showed to be an adequate simple fit to galaxy rotation curves in the local universe. The disk models contain seven parameters: inclination , position angle , coordinates (, ) of the disk center, scale radius , asymptotic velocity , and systemic velocity .
To test how well these simple models can describe the data, we constructed velocity fields covering a large range of parameter space for each galaxy. From the disk center, inclination, and position angle we compute the disk radius at each pixel in the source-plane velocity maps. We then calculate the circular velocity from Equation 1, and correct for the azimuthal angle and inclination to obtain the observed velocity field of the model disk. To simulate lensing distortion, the models were then convolved with an elliptical point spread function estimated as the best 2D Gaussian fit to the reconstructed tip-tilt reference star images. To estimate the goodness-of-fit we compute the statistic using the 1 error from emission line fits. The emission line fits routinely yield a reduced close to unity indicating that these errors are a good estimate of the true uncertainty. To estimate uncertainty in the parameters we perturb the model until the increases by one standard deviation from the best fit. Best-fit values for each galaxy are given in Table 2, except for Cl 0949+5152 for which no reasonable fit was found. Velocity contours for the best-fit disk models are shown in Figure 2.
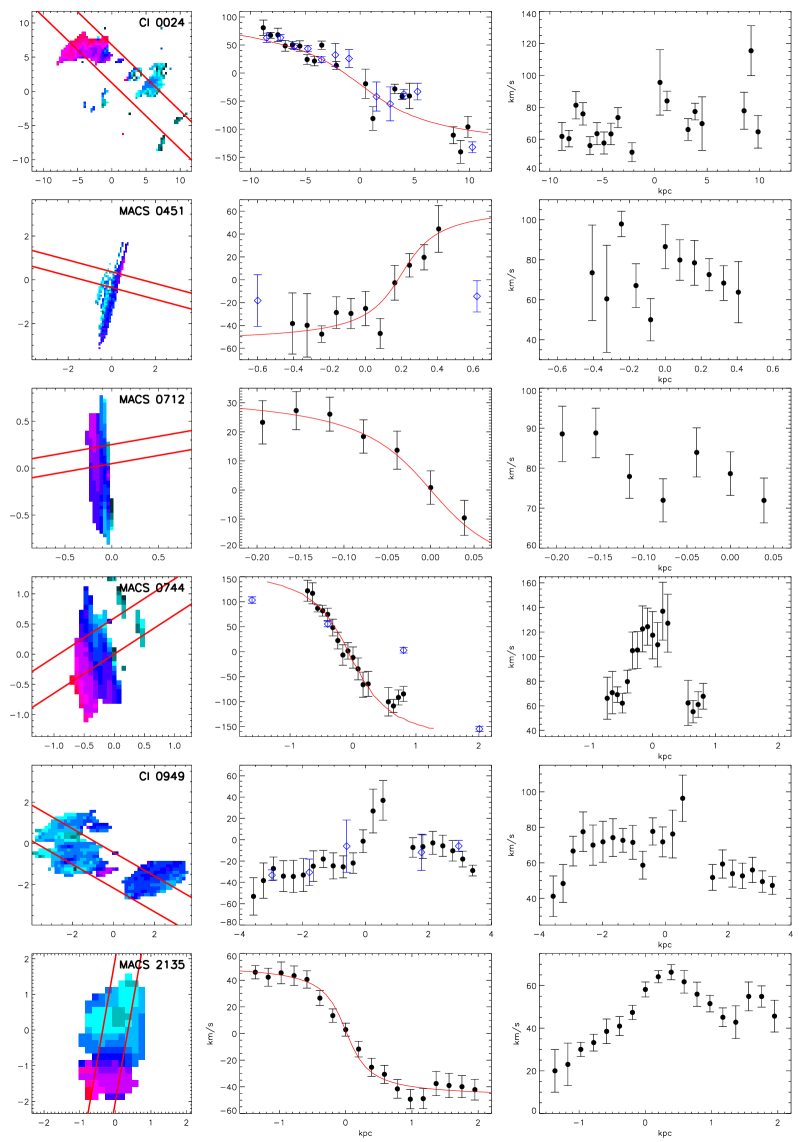
For galaxies which can be reasonably well described with disk-like kinematic structure, we extract the rotation velocity, inclination and disk position angle (major axis) from the model. The latter two values are usually estimated from morphology, but such methods are not necessarily accurate in this case due to the lensing distortion and asymmetric light distribution of these objects. We therefore adopt the inclination and position angle from best-fit disk models. In Figure 3 we show the one-dimensional velocity and dispersion profiles extracted from the data along a slit aligned with the disk position angle (or with the morphological major axis for the merger Cl 0949+5153). This allows us to better quantify the kinematic structure and, particularly, to estimate an approximate rotational speed for each galaxy. The circular velocity is a parameter in the disk models, however, in some objects the velocity field does not reach an asymptotic value (e.g. MACS J0744+3927). In such cases the best fit value of does not necessarily accurately represent the observed range of velocity. However, 4/5 galaxies in addition to MACS J2135-0102 display a coherent and roughly monotonic velocity curve consistent with the disk model. From these we estimate as half of the range in the one-dimensional model profile in the region detected in H emission, which provides a more reliable measure of the observed velocity range than the best-fit . Values of as well as the best-fit inclination from disk models are given in Table 2.
To estimate the dynamical mass for each galaxy, we adopt two approaches. First, we use the velocity dispersion and maximum extent of the H emission and calculate with appropriate for a sphere of uniform density and the radius is taken as half the maximum diameter. The geometrical factor is likely between 3 and 10 for these highly turbulent galaxies (Erb et al., 2006). The dynamical mass is likely uncertain to within a factor 2 due to the assumed geometry and exclusion of rotationally-supported mass, whereas random uncertainty propagated from and is %. We also use the velocity gradient to estimate the dynamical mass via but note that the maximum velocity shear in the sample gives for all galaxies, so the rotational mass is less than half of the dispersion-supported mass before correcting for inclination. In future sections, we therefore typically adopt the dynamical mass calculated from velocity dispersion, noting that the total uncertainty is roughly a factor of two dominated by the assumed with an additional systematic error due to the ignored rotational support. Adopted values of the diameter, dispersion, and dynamical mass are given in Table 2.
Before we discuss what can be learned from the sample as a whole, we briefly review the results for each of the six galaxies in turn.
3.2 Review of Individual Properties
3.2.1 Cl 0024+1709
After accounting for lensing amplification, the extent of H emission is kpc from our lens model, making this the largest object in our sample. The integrated H emission line flux implies an intrinsic SFR (uncorrected for dust extinction).
The H emission line and rest-UV morphologies both show a clumpy ring surrounding a fainter central region (Figure 2), similar to that seen in some other massive, extended galaxies at high redshift (e.g. the galaxy Q2643-BX482 in Genzel et al. 2008) as well as local ring galaxies (Romano et al., 2008). The narrow ring, 10 kpc diameter, and misaligned central feature suggest that the ring of concentrated star formation was triggered by an on-axis collision with another galaxy, as opposed to dynamical resonances within the galaxy. This hypothesis is supported by the numerical simulations of Lynds & Toomre (1976) and identification of interacting companions to ring galaxies by Romano et al. (2008). Unfortunately, the H emission in the central region coincides with a detector glitch in most of the IFU exposures and so the central dispersion and star formation density are only poorly constrained, with . In the ring, five UV- and H-bright knots are resolved with similar isophotal radius, velocity dispersion and luminosity of kpc (for erg s-1 cm-2 arcsec-2), , and erg s-1 cm-2, with uncertainties from the lens model and emission line fits of % in radius, 15% in dispersion and 30% in luminosity. This implies a dynamical mass of the H clumps from the velocity dispersion of assuming uniform density, and a H star-formation rate of SFR . The velocity field shows a smooth velocity gradient around the ring with peak-to-peak amplitude . Using the axial ratio from the optical imaging, we estimate which suggests a rotationally supported mass within a radius of 9 kpc. If the galaxy has a uniform spherical mass distribution, then the observed dispersion suggests a larger dynamical mass of . The resolved star forming regions in the ring thus account for about 50% of the integrated H flux and 15–25% of the mass interior to the ring.
3.2.2 MACS J0451+0006
The integrated H emission line flux suggests a star-formation rate of SFR=, with the two brightest clumps (Figure 2) contributing and . Some parts of the galaxy were not observed with OSIRIS due to the limited field of view and 20 arcsecond extent of the arc. We expect these regions to contribute an additional based on their rest-frame UV flux. The large magnification of this galaxy () leads to an unprecedented 60 pc typical resolution in the source plane, providing unique insight into the kinematic structure of the star forming regions. The H velocity map reveals a coherent velocity field across the galaxy and within the clumps with a peak to peak amplitude of (Figure 3). The bi-symmetric velocity field together with the good disk model fit (=3.6) suggest that the kinematics of this system are likely dominated by rotation rather than merging.
3.2.3 MACS J0712+5932
From our IFU observations, only the brightest UV clump is detected in H with an intrinsic star-formation rate of SFR and we place limits on the remaining clumps of SFR (). The H flux in the brightest clump is consistent with the total galaxy flux derived from longslit spectroscopy, implying very little star formation in the rest of the system. The two prominent UV-bright regions have FWHM sizes kpc and are separated by kpc (Figure 2). The H emission in the brighter region exhibits a velocity gradient of along the highly sheared direction. While the disk model provides an excellent fit to the velocity field with , it is unclear whether the dynamical state of MACS J0712+5932 is dominated by rotation, merging, or dispersion since only the strongest H-emitting region is detected with OSIRIS. Assuming a uniform density within a radius of 0.2 kpc and we derive a dynamical mass of M for the nebular emission region. The N[ii] emission line is detected at the level in individual spatial pixels consistent with the flux ratio N[ii]/H observed in NIRSPEC longslit spectra, with no measurable gradient in the flux ratio.
3.2.4 MACS J0744+3927
H emission is detected across kpc in the source plane and is resolved into 3 bright clumps in both the rest-frame UV continuum and H. The two dimensional velocity map clearly shows a bi-symmetric velocity field and is well described by the disk model with and peak to peak amplitude of km s-1, the largest observed in any high-redshift galaxy of this size (Figure 3). The velocity dispersion varies from – and peaks near the dynamical center of the galaxy. This suggests a turbulent primitive disk with a total star-formation rate of . The dynamical mass within a radius of 1 kpc is Mdyn= inferred from the velocity gradient, or M from the flux-weighted mean dispersion assuming uniform density.
The large rotation velocity, low SFR, and central dispersion peak conceivably make MACS J0744+3927 the most evolved disk-like galaxy of its size yet observed at high redshift and show that small, low mass (), turbulent field disk galaxies are already in place only 3 Gyr after the big bang.
3.2.5 Cl 0949+5153
The reconstructed image of Cl 0949+5153 at shows two diffuse regions separated by kpc, with the southwest component redshifted by from its companion (Figure 3). Both components show resolved velocity gradients of order 30 and 100 but in opposite directions, indicating that these two regions are likely merging (this system can not be described by a disk model). Each component is further resolved into multiple clumps of diameter kpc within an isophote of erg s-1 cm-2 arcsec-2. Interestingly, while the clumpy [Oiii] morphology appears to correlate with the rest-frame UV, the ratio of rest-UV to nebular emission surface brightness varies considerably between clumps. This could be caused by non-uniform extinction or different star formation histories, since the rest-UV traces older star formation episodes than H flux ( and Myr respectively). Assuming a global H/[Oiii] flux ratio from longslit spectra and case B recombination, the H-derived star formation rate of the entire system is yr-1 with 63% of the nebular emission in the larger northeast region.
Dynamically, it appears that Cl 0949+5153 is the only major merger in our sample, containing two spatially separated components with opposite velocity gradients and enhanced dispersion between components. From the velocity dispersion we crudely estimate that the northeast and southwest components have mass and respectively. Both of these components are fragmented further into multiple large clumps with seemingly coherent velocity fields.
3.2.6 MACS J2135-0102
For completeness, we also include in our sample discussion of the velocity field of LBG J2135-0102 (also known as the “Cosmic Eye” due to its lensed morphology). Stark et al. (2008) show that the global dynamics suggest a thick galaxy disk in an early state of assembly with rotation speed (corrected for inclination) of and .
The source plane morphology of this galaxy comprises two distinct star-forming regions embedded in a rotating disk. The northern component has a diameter of kpc, a star formation rate of yr-1 and a peak line width of km s-1. Together, these suggest an intensely star forming region with dynamical mass . The southern component is brighter in the rest-frame UV, but has a lower H-inferred star formation rate of SFR . The diameter of kpc and peak line width of 65 km s-1 suggest a mass .
3.3 Properties of the Ensemble
Having discussed the sources individually, we now turn to general conclusions based upon their integrated properties as listed in Table 2.
Table 2.
Intrinsic Galaxy Properties
| Galaxy | Diameter | SFR | ||||||
|---|---|---|---|---|---|---|---|---|
| (kpc) | () | () | () | () | (∘) | |||
| Cl 0024+1709 | 20 2 | 0.7 | 276 | 5510 | 695 | 7612 | 5.9 | |
| MACS J0451+0006 | 5 1 | 0.4 | 72 | 194 | 805 | 3810 | 3.6 | |
| MACS J0712+5932 | 1.5 0.3 | 0.2 | 51 | 5.71.2 | 812 | 154 | 0.4 | |
| MACS J0744+3927 | 2.0 0.3 | 0.1 | 2.40.5 | 112 | 994 | 12912 | 3.8 | |
| Cl 0949+5152 | 7 1 | 0.5 | 206 | 663 | ||||
| NE | 4.0 0.6 | 135 | 122 | 712 | ||||
| SW | 2.0 0.3 | 73 | 3.80.6 | 572 | ||||
| MACS J2135-0102 | 3.5 0.3 | 1.5 | 405 | 5.91.0 | 544 | 477 | 3.7 |
3.3.1 Kinematics
All six objects in our sample show well-resolved velocity structure. A visual inspection of Figures 2 and 3 reveals that four galaxies (Cl 0024+1709, MACS J0451+0006, MACS J0744+3927, and MACS J2135-0102) have smooth velocity gradients suggesting ordered rotation whilst Cl 0949+5153 appears to be a merger with both components showing well-resolved velocity gradients. The dynamical state of MACS J0712+5932 is unclear since only the brightest H-emitting region is detected with OSIRIS. The nebular emission shows a smooth velocity gradient in MACS J0712+5932, but subtends only four resolution elements in the most highly magnified of the three images and so it is unclear wither the kinematics of MACS J0712+5932 are dominated by rotation, dispersion, or merging.
For the galaxies studied here, the best fit disk models have values which range from 0.4 to 5.9 with a mean of 3.5, indicating agreement typically within 2 for individual pixels. For reference, disk models for 18 galaxies in the SINS survey which show the most prominent rotation yield best-fit values of 0.2–20 to the models of Cresci et al. (2009), so our simple model provides an equally good fit to the lensed galaxies. All galaxies show small-scale deviations from the model as indicated by the typical ; these proper motions could be caused by the effects of gravitational instability, or simply be due to the unrelaxed dynamical state indicated by high velocity dispersions . We therefore conclude that the model provides an adequate fit to the data and that the velocity fields are consistent with the kinematics of a turbulent rotating disk, except in the case of Cl 0949+5152.
It is illustrative to demonstrate the dramatic improvement in our understanding of the internal dynamics of our sources that arises uniquely through the improved spatial sampling enabled by studying strongly-lensed galaxies. To do this we bin the source-plane data cubes of our targets to a coarser resolution typical of that achievable for unlensed sources observed with an AO-corrected resolution of 0.15′′. We then re-fit the emission lines and extract one-dimensional velocity profiles using the same methods as adopted for the original data. Since the lensing magnification results in times more flux spread over times as many pixels, the binned signal-to-noise ratio is a a factor higher than equivalent observations of unlensed versions of our galaxies. These simulations therefore represent non-lensed galaxies observed for much longer integrations ( hours!). Even so, the resulting velocity profiles (also shown in Figure 3) are considerably inferior to those of our lensed data. A credible rotation curve is only retrieved for Cl 0024+1709, our least magnified galaxy, with important kinematic detail lost in all other objects (for example, MACS J0712+5932 is unresolved). Such poor spatial sampling is insufficient to distinguish between rotation and merging. More quantitatively, velocity gradients in all of our objects except Cl 0024+1709 are significantly underestimated (typically ).
3.3.2 Physical Characteristics: Size, Luminosity and Mass
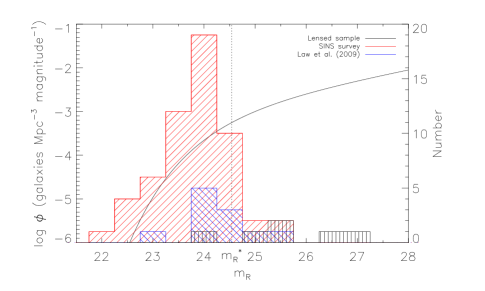
Next, we examine the integrated physical properties of the lensed galaxies. First we briefly compare the luminosity, size and mass to the general Lyman break population at –3. In Figure 4 we compare the distribution of apparent -band magnitudes for our sample to that of the Lyman-break population at (Shapley et al., 2001). The comparison demonstrates that five of our six galaxies are fainter than , ranging from , with median well below that of other spatially resolved IFU studies. The intrinsic H flux of the arcs is also lower than in other surveys, with a mean and median inferred SFR of 17 (Table 2) compared to 26–33 in Law et al. (2009) and Förster Schreiber et al. (2009). Comparing the typical spatial extent of the nebular emission to other surveys, the median radius (extent of detected nebular emission) and dynamical mass of the lensed sample are 2.1 kpc and , somewhat more extended than the compact galaxies studied by Law et al. (2009) which have median radius of 1.3 kpc and M. Turning to the dynamics, the flux-weighted mean velocity dispersions are perfectly consistent with those studied by Law et al. (2009): both samples span a range of 50–100 with mean and median 70–75 , indicating that the two sets of galaxies probe the same range of dynamical mass density. We note that the median H FWHM (from longslit spectra; Erb et al. 2006) and stellar mass of 6 kpc and are a better representation of the Law et al. (2009) sample as they do not depend on sensitivity of the data. The SINS survey probes somewhat more extended objects, with median H FWHM and stellar mass of 8 kpc and M. The mass density and extent of nebular emission of the lensed galaxies are therefore comparable to the more luminous Law et al. (2009) sample and somewhat lower than in the SINS survey. The lensed galaxies are also below the average size and mass for systems at similar redshifts, with the notable exception of Cl 0024+1709.
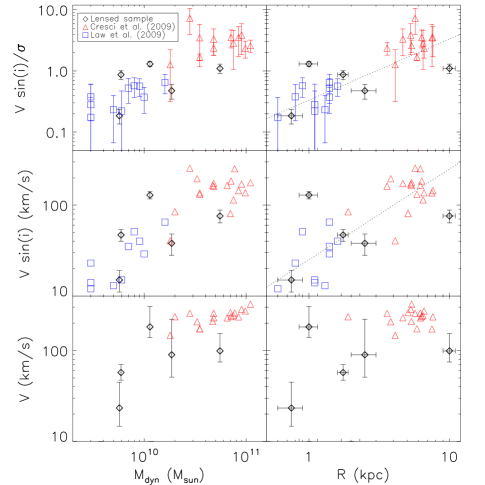
Our high resolution data enable us to determine reliable dynamical properties and compare with other IFU observations. In particular we can examine the prevalence of dispersion and rotation as a function of size and dynamical mass. Law et al. (2009) report evidence for dispersion-dominated kinematics in compact low-mass galaxies in contrast to the equal mix of rotation, dispersion, and complex/merger kinematics found in the SINS survey (Förster Schreiber et al., 2009), although the dispersion-dominated fraction is higher for more compact SINS galaxies. However, this claim is hampered by the small number of resolution elements (2–4) subtended by each source (although see Epinat et al. 2009). We can address this issue with the superior resolution offered by gravitational lensing. The relevant relations between and size or dynamical mass is shown in Figure 5 for the five lensed galaxies which are reasonably well fit by disk models compared to the compact LBGs from Law et al. (2009) and the rotation-dominated SINS galaxies described by Cresci et al. (2009), showing that the ratio of velocity shear to dispersion is higher for larger, more massive galaxies. Furthermore, the general agreement between the lensed sample and other comparison samples is also shown in Figure 5 and demonstrates that the dynamics of sub- star-forming galaxies do not differ substantially from more luminous objects.
Noting that many galaxies do not reach an asymptotic velocity within the region probed by our IFU observations, it is likely that larger circular velocities exist in faint outer regions of these galaxies. Indeed, the spatial extent and mass inferred from longslit spectra and photometry are higher than from relatively shallow IFU data. We therefore also compare the observed velocity gradient and, where appropriate, inclination-corrected rotational velocity as a function of size and dynamical mass in Figure 5. The observed velocity gradients of 3/5 lensed galaxies and the entire comparison sample are within 0.3 dex of the median value kpc-1. The consistent velocity gradients and corresponding obtained with a typical (Figure 5) suggest that the extended structure in some of the compact objects may in fact host velocity fields comparable to the larger disk galaxies.
While MACS J0451+0006 and MACS J2135-0102 have velocity gradients consistent with the other samples considered here, the clear outlier MACS J0744+3927 demonstrates that at least some small galaxies at this redshift have significant dynamical support from ordered rotation. This galaxy has an inclination-corrected at radius kpc and a H-derived star-formation rate surface density , which is a factor three lower than any galaxy in the dispersion-dominated sample, possibly indicating a later stage of evolution.
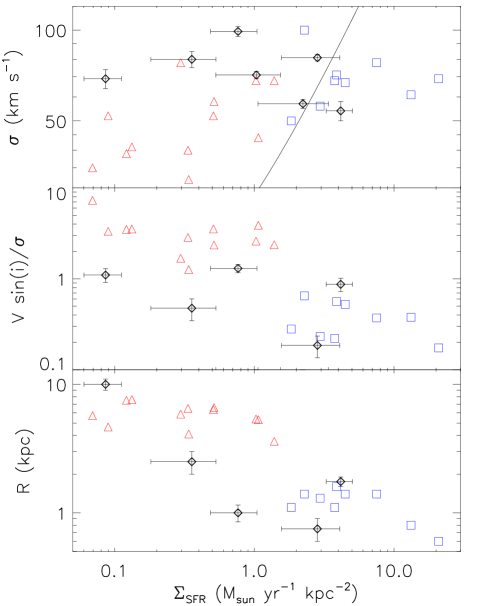
Motivated by the relatively large velocity shear and small of MACS J0744+3927, we explore the possibility that the low observed in many compact galaxies is an effect of selecting galaxies in early stages of evolution with large dispersions and star formation rates. This is expected in models of star formation feedback, which predict that mechanical energy introduced by supernovae leads to higher velocity dispersion and hence lower as increases. In one such model, Dib et al. (2006) simulate the velocity dispersion within the inter-stellar medium of galaxies induced by supernovae energy injection (assuming a 25% feedback efficiency) and predict a correlation between star-formation surface density and velocity dispersion.
To test whether supernova feedback might be responsible for the high dispersion observed in all star-forming galaxies, we show the velocity dispersion as a function of in Figure 6. For the range of with modeled supernova feedback, the observed velocity dispersions –80 are much higher than the predicted –15. We note that the density used in these simulations is lower than inferred for the galaxies, so the simulated dispersion is likely overestimated by a factor of . While the data show a slight trend of increasing with , the observed relation is inconsistent with simulations. We therefore conclude that supernova feedback is insufficient to explain the observed velocity dispersions. Figure 6 shows the relation between –, clearly demonstrating that decreases with . However, this trend is likely ultimately due to the velocity-size relation: larger galaxies tend to have larger rotation velocities (Figure 5) and smaller (Figure 6). This is explained by different sensitivities of the data, as deeper spectra (lower ) reveal more extended structures at larger radius with larger rotation speed. The velocity-size correlation contributes much more to the observed – relation than any correlation between and the velocity dispersion. These data thus do not support the hypothesis that is strongly affected by the density of star formation: increases by less than a factor of 2 over two orders of magnitude in .
3.4 Star-Formation Scales within Disks
The small and clumpy morphology of all galaxies suggest that the rotating disks are highly turbulent and may be dynamically unstable. We therefore explore the scale lengths for gravitational collapse within the high redshift disk galaxies.
Evidence is accumulating that the mode of star formation may be very different in early systems compared to that seen locally (Bournaud et al., 2008; Elmegreen & Elmegreen, 2005). Rather than forming stars within giant molecular clouds which condense out of a stable galaxy, star formation may be triggered by fragmentation of a dynamically unstable system. Briefly, in a rotating disk of gas and stars, perturbations smaller than a critical wavelength are stabilized against the inward pull of gravity by velocity dispersion while those larger than some are stabilized by centrifugal force. If the dispersion and rotation velocity are too low, and perturbations of intermediate wavelength grow exponentially. This interplay is summarized by the Toomre parameter which is calculated from the velocity dispersion, rotation curve, and mass distribution (Toomre, 1964). Galaxies with are therefore unstable on scales between and and will fragment into giant dense clumps. This could trigger star formation in clouds of much higher mass and radius than GMCs in local spiral galaxies with , and can explain the clump-cluster and chain morphologies observed in many high-redshift galaxies. Dynamical friction, viscosity and tidal interactions may cause these clumps to migrate toward the center of the galaxy potential, forming a bulge which stabilizes the system against further fragmentation.
From the galaxies whose velocity fields can be reasonably well described by rotating systems, we calculate the Toomre parameter via:
| (2) |
which describes the stability of a rotating disk of gas. If the system is unstable to local gravitational collapse and will fragment into overdense clumps. The value of is somewhat uncertain as it depends on the unknown mass distribution; our observations are consistent with a range – corresponding to constant and respectively. Adopting appropriate for a uniform disk and using dynamical mass to estimate the surface mass density , we find an inclination-corrected for all galaxies in our sample. We estimate that the uncertainty in is dominated by a factor of error in the dynamical mass. The assumed introduces a negligible 15% uncertainty, with an additional random error of % from the input parameters. Disk thickness and stellar abundance also affect the value of . Combined, these effects result in roughly a factor of 2 uncertainty. Even so, these galaxies all appear to be dynamically unstable since . Hence we expect them to fragment into massive clumps on scales of order the Jeans length for dispersion support. In a uniform disk, the largest scale for which velocity dispersion stabilizes against gravitational collapse is
| (3) |
which is readily estimated from the dispersion and dynamical mass density. As with , the uncertainty in is a factor of dominated by the dynamical mass with additional uncertainty from the unknown mass distribution, disk height, stellar content, and directional dependence of . The resulting instability scale is 1–3 kpc for Cl 0024+1709 and 0.1–1.5 kpc for all other objects, consistent with the observed clump sizes.
4 Star Forming Regions at High Redshift
For each galaxy in our sample, the gain in resolution provided by gravitational lensing reveals multiple resolved giant Hii regions which, as a group, dominate the integrated star formation rate. This gain enables us to study, in more detail than hitherto, the properties of individual star forming complexes in typical high redshift galaxies. In the following analysis, we concentrate on those Hii regions with extended bright emission which are sufficiently isolated. Ideally we would construct a complete well-defined sample, however, in the exploratory work presented here we wish to limit the sample to objects for which the size and flux can be measured robustly. We therefore specifically exclude Hii regions with overlapping emission in the H emission line maps (such as those in MACS J0744+3927).
In brief, Hii regions were selected with a flux isophote in the image plane where the instrumental response is well known. Thus we can check whether each Hii region is sufficiently resolved by comparing with the point-spread function produced by a bright tip-tilt reference star. To measure the area, each Hii region was deconvolved with the point spread function using a method which accounts for the distorted shapes produced by gravitational lensing. The intrinsic flux and area were then computed by reconstructing the Hii region in the source plane.
Hii regions were selected above a flux isophote corresponding to , where is the noise level measured in narrow-band images, constructed by collapsing continuum-subtracted OSIRIS data cubes around the strongest emission feature. Only isolated Hii regions (in which there is a single local maximum within the isophote) were selected. Regions not meeting this criterion are excluded from this analysis since attempting to disentangle multiple confused sources would introduce a large uncertainty. The isophote used varies from 1.4–4.6 erg s-1 cm-2 arcsec-2 for different arcs. The isophote for each selected Hii region is shown in Figure 2. Each Hii region subtends 0.5–0.9 arcseconds in the image plane, with the notable exception of the giant clump in MACS J0451+0006 which spans 3.2 arcseconds. The selected Hii regions are all well-resolved since the point spread function has FWHM in all observations.
For each Hii region we calculated the total nebular line flux and intrinsic angular size in the image plane. The luminosity of each Hii region was taken as the total flux within the selection isophote, with the uncertainty determined from the noise level in the narrow-band image. The Hii region size is more complicated to derive since the effect of the spatial resolution needs to be taken into consideration. We proceed by making two basic assumptions. First, we assume the observed flux distribution is a convolution of the actual distribution with the instrumental point spread function. We can therefore compute the approximate intrinsic spatial variance by subtracting the Gaussian PSF variance from the measured variance within the isophote, . This is equivalent to subtracting FWHM in quadrature from Gaussian profiles, but the procedure is applicable to non-Gaussian asymmetric distributions. In all cases confirming that the Hii regions are well resolved: for one Hii region and for all others. Second, we assume that the isophotal area scales with spatial variance such that intrinsic surface area , where is defined as the pixel size multiplied by the number of pixels within the isophote. Uncertainty in the isophotal flux ranges from 12–27% propagated from flux calibration and noise level in the narrow-band image. The uncertainty in is estimated by assuming an error of PSF for the isophote diameter. The range of resulting angular diameter () and relative error is to arcseconds.
To determine the source plane properties, each Hii region is finally reconstructed using the lens model transformation. The total magnification is calculated from the ratio of image- to source-plane flux. The source plane diameter is then defined as . This method is robust against the spatially varying magnification of the lensed arcs. Uncertainty in the lens model has little effect on the diameter but significantly contributes to the error in flux. From the H flux (converted from [Oiii] for Cl 0949+5153) we estimate the star formation rate using the Kennicutt (1998) prescription. The values range from 0.8–3.6 star formation rate and 0.3–1.0 kpc diameter.
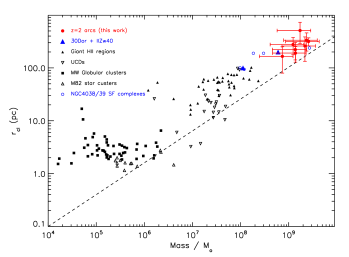
From the source plane diameters and kinematic data, we estimate the dynamical mass of the Hii regions. We use the flux-weighted mean velocity dispersion within the clump and assume a uniform spherical mass distribution () as discussed in §3.1. The Hii regions have large flux-weighted mean dispersions, with ranging from 45–80 . The dynamical masses range from 0.7–3 , far greater than typical star-forming clusters in the local universe. Statistical uncertainty in the dynamical mass is 20–60%, so the additional factor of systematic uncertainty in contributes significantly to the dynamical mass estimate. The mass-radius relation of the high-redshift clumps is shown in Figure 7 along with a sample of local star clusters and giant Hii regions for comparison. This shows that the Hii regions studied here are comparable in size and mass to the largest local star-forming complexes and consistent with the mass-radius relation observed locally.
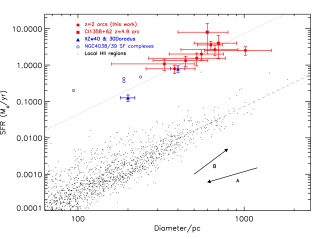
In Figure 8 we compare the size–luminosity relation of these star forming regions with equivalent data observed locally (from Gonzalez Delgado & Perez 1997 for normal spirals, and Bastian et al. 2006 for intense starbursts such as the Antennae) and with a lensed arc at (Swinbank et al., 2009). The sizes observed in the high redshift galaxies are comparable to the largest local star forming (Hii) regions but with 100 higher star formation rates than in local spiral galaxies. However, the implied star formation rate densities are roughly consistent with that observed in the most vigorous local starbursts. This result is not significantly affected by the resolution of different observations, although varying the selection isophote alters the radius-luminosity relation. We note that the flux isophotes used to define Hii regions in local spirals are much lower, so to quantify this effect we extract individual Hii regions from narrow-band H images of local galaxies from the SINGS and 11HUGS surveys (Kennicutt et al., 2003; Lee et al., 2007) using various isophotes. The effect on the size–luminosity relation as the isophote is increased is shown in Figure 8 as the vector A, which demonstrates that the extracted regions become smaller with higher average surface brightness. The vector B shows the effect of degrading the resolution while the isophote is kept fixed, which causes distinct Hii regions to merge together giving the appearance of a larger region with similar surface brightness. Since the surface brightness of the high-redshift Hii regions is higher than in local spirals, we conclude that the offset cannot be explained by different resolution and sensitivity of the various data sets. Metallicity also fails to explain the offset, as demonstrated by MACS J2135-0102 which has an R23 index and Civ P Cygni profile suggesting 0.4–1 Z⊙ metallicity (Stark et al., 2008; Quider et al., 2009). This implies that the luminosities in the high redshift Hii regions are truly much larger than in local spirals. Furthermore the observed diameters are consistent with the Jeans length for support by velocity dispersion, suggesting that they collapsed as a result of disk instabilities. We expect this to occur since the Toomre Q parameter is less than unity for all galaxies in our sample. It therefore seems likely that intense star-formation in high redshift galaxies is driven by the fragmentation of gravitationally unstable systems.
5 Conclusions
We have utilized strong gravitational lensing together with laser-assisted guide star adaptive optics at the Keck observatory to study the internal characteristics of six star-forming galaxies with a spatial resolution down to parsecs. Extending beyond the diffraction limited capability of current 8–10 meter class telescopes, our study provides an interesting preview of the science that will routinely be possible with future 30 meter class optical/infrared telescopes with adaptive optics systems (Ellis 2009). We demonstrate that enhanced resolution allows us to resolve morphological and kinematic structure which has not been (and cannot be) discerned in AO-based surveys of similar non-lensed sources. In particular we resolve multiple giant star forming regions of size consistent with that expected from Toomre instability in all of our targets (including separate merging components). Furthermore we determine the dynamical state of galaxies which would be too poorly sampled to distinguish between rotation, merging, or dispersion-dominated kinematics without gravitational lensing.
The lensed sample allows a unique study of relatively faint and small galaxies at high resolution. The median luminosity of the sample is half of the characteristic for LBGs and well below that of other high-redshift IFU studies. We find that the kinematics of the sub- population are in general agreement with larger and more luminous galaxies at similar redshifts: four of the six systems are clearly rotating with –1.3, one has a velocity gradient consistent with rotation within the small H-bright region of the arc detected with OSIRIS, and one is a major merger. All have high velocity dispersion –, consistent with all other resolved observations of star-forming galaxies and comparable to the value for stars which formed in the Galactic disk at (Sparke & Gallagher, 2000). Galaxies with a larger radius of detected nebular emission tend to have higher velocity shear and and lower ; these trends are consistent with other observations. The case of MACS J0744+3927 with inclination-corrected clearly demonstrates that some small ( kpc), fast-rotating field disk galaxies are already in place by . Well-sampled velocity fields demonstrate that the ubiquitous giant clumps are often embedded in common rotating systems and are not independent merging components. In contrast, non-lensed clumpy systems with velocity shear have been interpreted as mergers or remained ambiguous. These results demonstrate the need of high-resolution observations to distinguish rotating systems and mergers, as well as to probe the kpc scale of star formation at high redshift.
The observations presented here represent the best current probe of the scale of star formation at and, as such, can be compared to theoretical predictions. Most of the star formation in our sample occurs within giant Hii regions of diameter 0.3–1 kpc comparable to the largest local Hii regions, with star formation rate density comparable to the most vigorous local starbursts and higher than in typical spiral galaxies. This offset in cannot be explained by the different resolution or sensitivity of low- and high-redshift observations. Only one of our six objects is a clear major merger with both merging components broken into high-SFR clumps, suggesting that star formation episodes in sub-L∗ high redshift galaxies are triggered by Toomre instability independent of major merger events. We note that the merging system demonstrates no enhancement in star formation (as traced by nebular emission) compared to the non-merging galaxies. The increased high-mass star formation relative to local spirals likely results from some combination of higher gas density, increased star formation efficiency, shorter star formation timescales, and possibly other effects. The clumpy star formation, high , kinematics consistent with rotation, and small are in qualitative agreement with the galaxy evolution model of Dekel et al. (2009) in which galaxies accrete their baryonic mass from cold streams. In this model the clumps form due to Toomre instability in turbulent disks and migrate into the galaxy center on timescales of a few hundred Myr, forming a bulge which stabilizes the system and increases the star formation timescale after Gyr. Numerical simulations suggest that cold-stream accretion is a dominant mechanism in galaxy assembly, especially at early times and in galaxies with halo masses less than a few (Kereš et al., 2009; Ocvirk et al., 2008; Brooks et al., 2009). In particular the high-resolution simulations of Brooks et al. (2009) show that accretion of cold gas dominates the buildup of stellar disks and bulges in sub- galaxies and allows disk formation at earlier times than if the accreted gas is shock-heated. The rotating kinematics and distribution of star formation in the lensed sample therefore supports, at least qualitatively, a cold-stream accretion scenario for galaxy formation.
Analysis of our sample has shown the benefit of using lensed sources to probe the inner structure of early star-forming galaxies. The advent of many panoramic multi-color imaging surveys will hopefully reveal many further examples of such systems, ensuring further progress with laser-assisted guide star adaptive optics. Ultimately, the next generation of 30-meter optical/near-infrared telescopes will extend the high-resolution studies presented herein to the entire population of high-redshift star forming galaxies.
Acknowledgments
We thank Randy Campbell, Mark Kassis, Jim Lyke, and Hien Tran for their dedication and assistance in obtaining these observations. AMS gratefully acknowledges a Royal Astronomical Society Sir Norman Lockyer Research Fellowships and a Royal Society travel grant. RSE acknowledges financial support from the Royal Society. JR acknowledges support from an EU Marie Curie fellowship. DPS acknowledges support from an STFC Postdoctoral Research Fellowship. These observations were obtained at the W.M. Keck Observatory, which is operated as a scientific partnership among the California Institute of Technology, the University of California and the National Aeronautics and Space Administration. The Observatory was made possible by the generous financial support of the W.M. Keck Foundation.
References
- Bastian et al. (2006) Bastian, N., Emsellem, E., Kissler-Patig, M., & Maraston, C. 2006, A&AP, 445, 471
- Bouché et al. (2007) Bouché, N., et al. 2007, ApJ, 671, 303
- Bournaud et al. (2008) Bournaud, F., et al. 2008, A&AP, 486, 741
- Broadhurst et al. (2000) Broadhurst, T., Huang, X., Frye, B., & Ellis, R. 2000, ApJL, 534, L15
- Brooks et al. (2009) Brooks, A. M., Governato, F., Quinn, T., Brook, C. B., & Wadsley, J. 2009, ApJ, 694, 396
- Colley et al. (1996) Colley, W. N., Tyson, J. A., & Turner, E. L. 1996, ApJL, 461, L83
- Coppin et al. (2007) Coppin, K. E. K., et al. 2007, ApJ, 665, 936
- Courteau (1997) Courteau, S. 1997, AJ, 114, 2402
- Cresci et al. (2009) Cresci, G., et al. 2009, ApJ, 697, 115
- Dekel et al. (2009) Dekel, A., Sari, R., & Ceverino, D. 2009, ApJ, 703, 785
- Dib et al. (2006) Dib, S., Bell, E., & Burkert, A. 2006, ApJ, 638, 797
- Dickinson et al. (2003) Dickinson, M., Papovich, C., Ferguson, H. C., & Budavári, T. 2003, ApJ, 587, 25
- Dye et al. (2007) Dye, S., Smail, I., Swinbank, A. M., Ebeling, H., & Edge, A. C. 2007, MNRAS, 379, 308
- Ebeling et al. (2001) Ebeling, H., Edge, A. C., & Henry, J. P. 2001, ApJ, 553, 668
- Elíasdóttir et al. (2007) Elíasdóttir, Á., et al. 2007, arXiv:0710.5636
- Elmegreen & Elmegreen (2005) Elmegreen, B. G., & Elmegreen, D. M. 2005, ApJ, 627, 632
- Elmegreen et al. (2009) Elmegreen, B. G., Elmegreen, D. M., Fernandez, M. X., & Lemonias, J. J. 2009, ApJ, 692, 12
- Epinat et al. (2009) Epinat, B., Amram, P., Balkowski, C., & Marcelin, M. 2009, arXiv:0904.3891
- Erb et al. (2006) Erb, D. K., Steidel, C. C., Shapley, A. E., Pettini, M., Reddy, N. A., & Adelberger, K. L. 2006, ApJ, 646, 107
- Evstigneeva et al. (2007) Evstigneeva, E. A., Gregg, M. D., Drinkwater, M. J., & Hilker, M. 2007, AJ, 133, 1722
- Förster Schreiber et al. (2006) Förster Schreiber, N. M., et al. 2006, ApJ, 645, 1062
- Förster Schreiber et al. (2009) Förster Schreiber, N. M., et al. 2009, arXiv:0903.1872
- Fuentes-Masip et al. (2000) Fuentes-Masip, O., Muñoz-Tuñón, C., Castañeda, H. O., & Tenorio-Tagle, G. 2000, AJ, 120, 752
- Genzel et al. (2006) Genzel, R., et al. 2006, Nature, 442, 786
- Genzel et al. (2008) Genzel, R., et al. 2008, ApJ, 687, 59
- Gonzalez Delgado & Perez (1997) Gonzalez Delgado, R. M., & Perez, E. 1997, APJS, 108, 199
- Harris (1996) Harris, W. E. 1996, VizieR Online Data Catalog, 7195, 0
- Haşegan et al. (2005) Haşegan, M., et al. 2005, ApJ, 627, 203
- Hilker et al. (2007) Hilker, M., Baumgardt, H., Infante, L., Drinkwater, M., Evstigneeva, E., & Gregg, M. 2007, A&AP, 463, 119
- Hopkins & Beacom (2006) Hopkins, A. M., & Beacom, J. F. 2006, ApJ, 651, 142
- Jullo et al. (2007) Jullo, E., Kneib, J.-P., Limousin, M., Elíasdóttir, Á., Marshall, P. J., & Verdugo, T. 2007, New Journal of Physics, 9, 447
- Kennicutt (1998) Kennicutt, R. C., Jr. 1998, ApJ, 498, 541
- Kennicutt et al. (2003) Kennicutt, R. C., Jr., et al. 2003, PASP, 115, 928
- Kereš et al. (2009) Kereš, D., Katz, N., Fardal, M., Davé, R., & Weinberg, D. H. 2009, MNRAS, 395, 160
- Kneib et al. (1993) Kneib, J. P., Mellier, Y., Fort, B., & Mathez, G. 1993, A&AP, 273, 367
- Kneib et al. (1996) Kneib, J.-P., Ellis, R. S., Smail, I., Couch, W. J., & Sharples, R. M. 1996, ApJ, 471, 643
- Larkin et al. (2006) Larkin, J., et al. 2006, New Astronomy Review, 50, 362
- Law et al. (2007a) Law, D. R., Steidel, C. C., Erb, D. K., Pettini, M., Reddy, N. A., Shapley, A. E., Adelberger, K. L., & Simenc, D. J. 2007, ApJ, 656, 1
- Law et al. (2007b) Law, D. R., Steidel, C. C., Erb, D. K., Larkin, J. E., Pettini, M., Shapley, A. E., & Wright, S. A. 2007, ApJ, 669, 929
- Law et al. (2009) Law, D. R., Steidel, C. C., Erb, D. K., Larkin, J. E., Pettini, M., Shapley, A. E., & Wright, S. A. 2009, ApJ, 697, 2057
- Lee et al. (2007) Lee, J. C., Kennicutt, R. C., Funes, S. J., José G., Sakai, S., & Akiyama, S. 2007, ApJL, 671, L113
- Lehnert et al. (2009) Lehnert, M. D., Nesvadba, N. P. H., Tiran, L. L., Matteo, P. D., van Driel, W., Douglas, L. S., Chemin, L., & Bournaud, F. 2009, ApJ, 699, 1660
- Limousin et al. (2009) Limousin, M., et al. 2009, in preparation
- Lynds & Toomre (1976) Lynds, R., & Toomre, A. 1976, ApJ, 209, 382
- McCrady & Graham (2007) McCrady, N., & Graham, J. R. 2007, ApJ, 663, 844
- Murray (2009) Murray, N. 2009, ApJ, 691, 946
- Nesvadba et al. (2006) Nesvadba, N. P. H., et al. 2006, ApJ, 650, 661
- Ocvirk et al. (2008) Ocvirk, P., Pichon, C., & Teyssier, R. 2008, MNRAS, 390, 1326
- Pryor & Meylan (1993) Pryor, C., & Meylan, G. 1993, Structure and Dynamics of Globular Clusters, 50, 357
- Quider et al. (2009) Quider, A. M., Shapley, A. E., Pettini, M., Steidel, C. C., & Stark, D. P. 2009, arXiv:0910.0840
- Reddy & Steidel (2004) Reddy, N. A., & Steidel, C. C. 2004, ApJL, 603, L13
- Richard et al. (2007) Richard, J., et al. 2007, ApJ, 662, 781
- Richard et al. (2009) Richard, J., et al. 2009, in preparation
- Romano et al. (2008) Romano, R., Mayya, Y. D., & Vorobyov, E. I. 2008, AJ, 136, 1259
- Sand et al. (2005) Sand, D. J., Treu, T., Ellis, R. S., & Smith, G. P. 2005, ApJ, 627, 32
- Santos et al. (2004) Santos, M. R., Ellis, R. S., Kneib, J.-P., Richard, J., & Kuijken, K. 2004, ApJ, 606, 683
- Shapley et al. (2001) Shapley, A. E., Steidel, C. C., Adelberger, K. L., Dickinson, M., Giavalisco, M., & Pettini, M. 2001, ApJ, 562, 95
- Shapley et al. (2003) Shapley, A. E., Steidel, C. C., Pettini, M., & Adelberger, K. L. 2003, ApJ, 588, 65
- Siana et al. (2009) Siana, B., et al. 2009, ApJ, 698, 1273
- Smith et al. (2005) Smith, G. P., Kneib, J.-P., Smail, I., Mazzotta, P., Ebeling, H., & Czoske, O. 2005, MNRAS, 359, 417
- Sparke & Gallagher (2000) Sparke, L. S., & Gallagher, J. S., III 2000, Galaxies in the Universe, by Linda S. Sparke and John S. Gallagher, III, pp. 416. ISBN 0521592410. Cambridge, UK: Cambridge University Press, September 2000.,
- Spergel et al. (2003) Spergel, D. N., et al. 2003, APJS, 148, 175
- Stark et al. (2007) Stark, D. P., Ellis, R. S., Richard, J., Kneib, J.-P., Smith, G. P., & Santos, M. R. 2007, ApJ, 663, 10
- Stark et al. (2008) Stark, D. P., Swinbank, A. M., Ellis, R. S., Dye, S., Smail, I. R., & Richard, J. 2008, Nature, 455, 775
- Swinbank et al. (2007) Swinbank, A. M., Bower, R. G., Smith, G. P., Wilman, R. J., Smail, I., Ellis, R. S., Morris, S. L., & Kneib, J.-P. 2007, MNRAS, 376, 479
- Swinbank et al. (2009) Swinbank, M., et al. 2009, arXiv:0909.0111
- Tacconi et al. (2008) Tacconi, L. J., et al. 2008, ApJ, 680, 246
- Toomre (1964) Toomre, A. 1964, ApJ, 139, 1217
- Veilleux & Osterbrock (1987) Veilleux, S., & Osterbrock, D. E. 1987, APJS, 63, 295
- Wizinowich et al. (2006) Wizinowich, P. L., et al. 2006, PASP, 118, 297
- Wright et al. (2009) Wright, S. A., Larkin, J. E., Law, D. R., Steidel, C. C., Shapley, A. E., & Erb, D. K. 2009, ApJ, 699, 421