IPHAS and the symbiotic stars
Abstract
Context. Knowledge of the total population of symbiotic stars in the Galaxy is important for understanding basic aspects of stellar evolution in interacting binaries and the relevance of this class of objects in the formation of supernovae of type Ia.
Aims. In a previous paper, we presented the selection criteria needed to search for symbiotic stars in IPHAS, the INT H survey of the Northern Galactic plane. IPHAS gives us the opportunity to make a systematic, complete search for symbiotic stars in a magnitude-limited volume.
Methods. Follow-up spectroscopy at different telescopes worldwide of a sample of sixty two symbiotic star candidates is presented.
Results. Seven out of nineteen S-type candidates observed spectroscopically are confirmed to be genuine symbiotic stars. The spectral type of their red giant components, as well as reddening and distance, were computed by modelling the spectra. Only one new D-type symbiotic system, out of forty-three candidates observed, was found. This was as expected (see discussion in our paper on the selection criteria). The object shows evidence for a high density outflow expanding at a speed 65 km s-1.
Most of the other candidates are lightly reddened classical T Tauri stars and more highly reddened young stellar objects that may be either more massive young stars of HAeBe type or classical Be stars. In addition, a few notable objects have been found, such as three new Wolf-Rayet stars and two relatively high-luminosity evolved massive stars. We also found a helium-rich source, possibly a dense ejecta hiding a WR star, which is surrounded by a large ionized nebula.
Conclusions. These spectroscopic data allow us to refine the selection criteria for symbiotic stars in the IPHAS survey and, more generally, to better understand the behaviour of different H emitters in the IPHAS and 2MASS colour-colour diagrams.
Key Words.:
Surveys; (Stars:) binaries: symbiotic; Stars: emission-line, Be; Stars: pre-main sequence; Stars: Wolf-Rayet; (ISM:) planetary nebulae: general| Name (IPHASJ….) | r∗ | i∗ | H∗ | J | H | K | IR | Spec. | E(B-V) | A(V) | A(K) | M(K) | d |
|---|---|---|---|---|---|---|---|---|---|---|---|---|---|
| [mag] | type | type | [kpc] | ||||||||||
| 182906.08–003457.2 | 17.53 | 14.87 | 15.66 | 10.97 | 9.61 | 9.05 | S | M5.7 III | 1.30 | 5.08 | 0.59 | 5.65 | 6.7 |
| 183501.83+014656.0 | 16.34 | 14.47 | 13.83 | 10.74 | 9.48 | 8.92 | S | M5.5 III | 1.40 | 5.45 | 0.63 | 5.55 | 5.9 |
| 184446.08+060703.5 | 14.74 | 13.34 | 12.70 | 11.04 | 9.88 | 9.40 | S | M2.0 III | 1.00 | 3.76 | 0.44 | 3.80 | 3.6 |
| 184733.03+032554.3 | 18.55 | 15.32 | 16.13 | 10.07 | 8.44 | 7.71 | S | M6.5 III | 2.20 | 8.71 | 0.96 | 6.22 | 3.9 |
| 185323.58+084955.1 | 16.53 | 14.25 | 14.28 | 10.32 | 9.05 | 8.51 | S | M6.5 III | 1.35 | 5.33 | 0.61 | 6.15 | 6.5 |
| 193436.06+163128.9 | 16.84 | 14.65 | 14.49 | 10.70 | 9.34 | 8.77 | S | M5.9 III | 1.08 | 4.23 | 0.49 | 5.75 | 6.4 |
| 193501.31+135427.5 | 14.04 | 12.51 | 12.81 | 10.05 | 8.98 | 8.58 | S | M1.5 III | 0.60 | 2.25 | 0.27 | 3.66 | 2.5 |
| 194607.52+223112.3 | 17.54 | 16.04 | 14.70 | 9.22 | 7.19 | 5.96 | D |
∗ From Witham et al. (2008).
1 Introduction
Symbiotic stars, the interacting binaries with the longest periods, are recognised as key objects in the study of different aspects of stellar evolution. These include the formation of supernovae of type Ia (Munari & Renzini 1992, Hachisu et al. 1999), the powering mechanism of supersoft X-ray sources (cf. Jordan et al. 1996) and the formation of jets (Tomov 2003) and of bipolar (planetary) nebulae (Corradi (2003)).
The testing of these possible roles, and in particular their ability to form SNe Ia, depends on the total population of symbiotic stars within galaxies. This figure is, however, poorly known, even in our own Galaxy where less than 200 systems are known (Belczyński et al. (2000)), out of a predicted total population that ranges from 3 (Allen (1984)) up to 4 (Magrini, Corradi & Munari (2003)).
To improve the situation, a comprehensive search for symbiotic stars in the part of the Galactic plane visible from the northern hemisphere was started (Corradi et al. 2008, hereafter paper I). The search begins with analysing the data from the INT Photometric H Survey of the northern Galactic plane (IPHAS, Drew et al. (2005)), taking advantage of the generally strong H emission and presence of a cool giant that characterises this class of objects. Combination of these properties with constraints from 2MASS near–IR data defines the selection criteria adopted in paper I. There, a list of about one thousand symbiotic star candidates was drawn up from the set of IPHAS H emitters available at that time (Witham et al. 2008). As shown in paper I, this list suffers from significant contamination by reddened Be stars and young stellar objects, which are frequent in the Galactic plane.
In this paper, we present follow-up spectroscopy for a sample of 62 IPHAS candidate symbiotic stars. Observations are presented in Sect. 2. Section 3 is a discussion of the spectroscopically confirmed new symbiotic systems, while Sect. 4 outlines the majority group of mimics revealed in our spectra: among these there are several notable, rare object types. Discussion and perspectives are presented in Sect. 5.


2 Spectroscopic observations
In paper I, the discovery of three new symbiotic stars from exploratory spectroscopic observations obtained at the 2.5m Isaac Newton Telescope (INT) on La Palma, Spain, was presented. Since then, our spectroscopic campaign has progressed on different telescopes worldwide in various runs from June 2006 to June 2008.
Six out of the eight newly discovered symbiotic stars presented in the next section were observed at the 2.6m Nordic Optical Telescope on La Palma in September 2007. The ALFOSC spectrograph was used, in combination with grism #4 and a 0′′.5 wide slit. This set-up provides a reciprocal dispersion of 3.1 Å per pixel, a resolution of 8.1 Å, and a spectral coverage between 3700 and 8700 Å. The 2kx2kEEV ALFOSC CCD#8 suffers from severe fringing in the red, with an amplitude as large as 25% at 8000 Å. This is only partially corrected using lamp flat fields taken with the telescope at the position of the target. Exposure times ranged between 10 and 30 min per object. One 5 min higher resolution spectrum of IPHASJ194607.52+223112.3 was also obtained at the NOT using grism#17, covering the region 6350-6850 Å with a 0.65 Å resolution.
Other spectra were obtained at the INT using the IDS spectrograph. They include the new symbiotic star IPHASJ183501.83+014656.0 observed in September 2006. Grating R300V was used, which gives a reciprocal dispersion of 1.9 Å per pixel, and a spectral coverage from 3700 to 8700 Å (these figures slightly vary from night to night). The slit width was 1′′.1, providing a spectral resolution of 5.0 Å. Typical exposure times were 20 to 30 min per object. The 2kx4k IDS EEV CCD also suffers from fringing redward of 7000 Å. In addition, flux calibration is uncertain above 8000 Å because of significant optical aberrations at the edge of the large format CCD used with IDS.
The new symbiotic star IPHASJ193501.31+135427.5, together with another twenty candidates, was observed at the 2.3m ANU telescope at Siding Spring Observatory, Australia, with the DBSB instrument, in August 2008. Blue spectra covering the region from 3700 to 6000 Å, at a reciprocal dispersion of 2.0 Å per pixel and a resolution of 4.5 Å were obtained with exposure times of 30 min. Red spectra covering the range 5700-9000 Å were also obtained, with the same exposure time and similar dispersion and resolution (1.9 Å per pixel and 5.0 Å, respectively).
The other spectra were obtained at the 4.2m WHT telescope on La Palma with the ISIS spectrograph; the 2.1m telescope at San Pedro Martir, Mexico with the Boller & Chivens spectrograph; and the Asiago 1.8m telescope of the INAF Padova Astronomical Observatory equipped with the AFOSC imager+spectrograph. Resolution, depth and spectral coverage varied depending on the instruments and optical elements used in the different nights. In all cases, the reciprocal dispersion was between 1.6 Å and 4.0 Å per pixel, and spectral resolution between 4 and 9 Å. The spectral coverage is indicated in the tables in the following sections of the paper.
Several spectrophotometric standards were observed during the nights for relative flux calibration. Reduction of all spectra was performed with IRAF in a standard fashion.
3 New IPHAS symbiotic stars
Seven out of nineteen S-type candidate symbiotic stars observed, and one out of forty-three D-type candidates, turned out to be new symbiotic stars. Their names (according to IAU–approved IPHAS nomenclature), IPHAS111IPHAS magnitudes are tied to the system of corresponding SDSS bands, with zero magnitude defined by the SED of Vega. and 2MASS magnitudes, near-IR type, and other parameters obtained as discussed below, are listed in Tab. 1. Their optical spectra are shown in Figs. 1 to 3. Note that in order to accept a source as a genuine symbiotic star we opted in favor of the original classification criterion due to Allen (1984), which requires the presence of both a cool giant and ionization condition high enough to produce at least HeII emission lines. This criterion isolates an homogeneous set of objects that are characterised by stable H-burning conditions on the surface of the white dwarf accreting from the cool giant companion, a scenario theoretically proposed by Tutukov and Yungelson (1976), and Paczynski and Rudak (1980), and confirmed observationally by Munari and Buson (1994), and Sokoloski (2003). The more relaxed classification criterion favoured by Belczyński et al. (2000) does not isolate a similarly homogeneous group.
A brief description of the spectrum of each object follows.
IPHASJ182906.08-003457.2 (Fig. 1, top). It shows a classical spectrum of a symbiotic star, with prominent red continuum with the deep TiO absorption bands typical of an M giant222The heads of the most prominent TiO bands in the range covered by our spectra are at 7053, 7589, 8206, and 8432 Å (see Kirkpatrick, Henry and McCarthy (1991))., and emission lines from low to high excitation, including: the HI Balmer series down to H, HeI 5875, 6678, 7065, HeII 4686, 5411, faint [FeVII]5721, [CaV]6086 or [FeVII] 6087, and faint OI 8446. No other nebular forbidden lines are detected at the depth of our spectra. The H/H flux ratio is as large as 24.
IPHASJ183501.83+014656.0 (Fig. 1, middle). Included in the list of faint H emitters by Robertson and Jordan (1989), our spectrum reveals its symbiotic nature by showing both a rising continuum with TiO bands and a rich emission line spectrum. This includes [NeIII]3869, the HI Balmer series down to H, [OIII]4363 stronger than H, HeII4686, [OIII]5007 three times stronger than H and 11 times stronger than [OIII]4363, [NII]5755 stronger than [NII]6583, HeI 5875,6678,7065,7281, and OI8446. The H/H ratio is also 24.
IPHASJ184446.08+060703.5 (Fig. 1, bottom). The object was originally included in the catalogue of planetary nebulae (PNe) by Kohoutek (1965) with name PN K3-12. However, it was suspected to be a symbiotic star by Acker & Stenholm (1990). Our spectrum confirms its symbiotic nature, revealed by the emission line spectrum combined with strong 6825 and 7082 Raman scattered lines and, albeit shallow, TiO bands. Emission lines include the HI Balmer series, HeI 5875,6678,7065, HeII 4686 almost as strong as H, HeII 5411, FeII 4923, 5018, faint [FeVII] 5721 and weak [CaV] 6086 or [FeVII] 6087.
IPHASJ184733.03+032554.3 (Fig. 2, top). The object seems very reddened, with no signal below H. Its symbiotic nature is revealed by the strong TiO bands and the emission lines which include [FeVII] 5720, HeI 5875, 6678, 7065, [CaV] 6086 or [FeVII] 6087, OI8446 and H which is 110 times stronger than H.
IPHASJ185323.58+084955.1 (Fig. 2, middle). Another classical spectrum of a symbiotic star, with prominent continuum with TiO bands in the red part of the spectrum. The emission line spectrum includes the HI Balmer series, HeI 4471, 5875, 6678,7 065, HeII 4686 as strong as H and faint 5411, faint [OIII] 5007, FeII from multiplet #42 at 4923, 5018, and 5169 Å, [FeVII] 4942 5721, [CaV] 6086 or [FeVII] 6087, OI 8446, and the Raman feature at 6825 Å. The H/H ratio is 36.
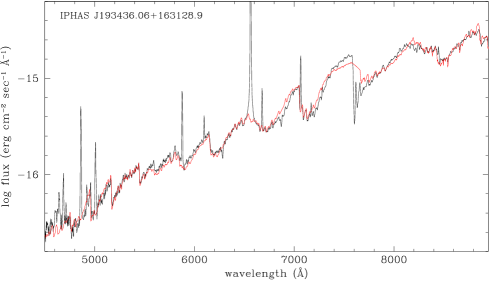
IPHASJ193436.06+163128.9 (Fig. 2, bottom). Superimposed on a red giant continuum with prominent TiO bands, the emission line spectrum includes HI and HeI lines, HeII 4686, hints of FeII of multiplet #42, faint OI 8446, and [OIII] 5007 emission about one third the strength of H and only 2.5 times larger than [OIII]4363. The low [OIII] 5007/4363 flux ratio indicates strong collisional quenching of the [OIII]5007 line at the high densities typical of S-type symbiotic systems.
IPHASJ193501.31+135427.5 (Fig. 3, top). Included in the catalogue of H emission stars of Kohoutek & Wehmeyer (1999), our spectrum unveils its nature as a symbiotic star. The conclusion is based on the evidence of shallow absorption bands of an early M giant similar to IPHASJ184446.08+060703.5, accompanied by an emission line spectrum of moderately high excitation. This includes lines of the HI Balmer series, several HeI and FeII lines, weak OI 8446 and HeII 4686, and forbidden lines of [NeIII] 3869 and [OIII] 5007,4959,4363. Note the presence of several strong diffuse interstellar bands (DIBs) in the spectrum. The [OIII]5007/4363 flux ratios is 5.

IPHASJ194607.52+223112.3 (Fig. 3, bottom). According to its 2MASS colours, this is the only new D-type symbiotic star discovered so far by IPHAS (but see other candidates presented in the next sections). The object shows an optical spectrum dominated by nebular lines of low ([OI], [OII], [NII], [SII]) to high ionization species ([ArIII], [ArV], [OIII], [SIII], HeII, [FeVI], [FeVII], [CaV]). The H/H ratio is 43. The continuum is weak and slowly rising, with no evidence of the absorption bands of a red giant. However, the presence of the Raman scattered emission at 6825 Å proves its nature as a genuine symbiotic star. The situation is similar to that of other D-type symbiotic systems, like He 2-104, where the red giant only shows up in the K band in the near-IR (Santander-García et al. (2008)).
A spectrum around H obtained at a higher resolution at the NOT reveals that each line of the [NII] doublet at 6548 and 6583 Å is split into at least two components, whose peaks are separated by 130 km s-1 (Fig. 4). A 5 min [N ii] image obtained at the NOT under a 0′′.6 seeing does not resolve the nebula spatially. In an optically thin case, such a double-peaked profile cannot be produced by an isotropic mass distribution. In fact, regardless of the geometrical thickness of the spherical shell, a substantial fraction of gas emission would be shifted at low or zero line-of-sight velocity due to projection effects. This would result in a top flattened line profile. The same conclusion holds for moderately elliptical shapes. Such a double-peaked profile might instead be generated by a toroidal, bipolar, or highly collimated mass distribution inclined at a significant angle from the plane of the sky. This is confirmed by simulations covering a range of geometries and velocity laws, and taking into account the thermal broadening of the [N ii] line. However, the [NII]6583/5755 (undereddened) flux ratios is as low as six, indicating that this expanding region is dense, with Ne larger than cm-3. At such densities, the optically thin hypothesis might not apply, and simulations of the line profile would require a more complex modelling that is beyond the scope of this paper. Note also that the higher resolution spectrum does not include the [N ii] 5755 line, and therefore we do not know if all velocity components in the line are produced by gas in a high density regime. We conclude that the object presents an unresolved dense outflow which is likely to be aspherical, expanding at a speed larger than km s-1.
3.1 Modelling the red giants and the reddening to derive the distances
In order to derive the distances to the new symbiotic stars using the observed 2MASS K-band magnitudes, the spectral classification and reddening of their cool giants is needed. They were derived by fitting the observed spectra. We used the Fluks et al. (1994) spectral library of red giants and nebular continua from Osterbrock and Ferland (2006). The RV=3.1 extinction law by Fitzpatrick (1999) was adopted, and the same amount of reddening was assumed to affect both the cool giant and the nebular region. The achieved fits are good and allow spectral types to be constrained to within 0.3 subtypes and the reddening to within 0.1 mag. An example of such a fit is shown in Fig. 5.
The amount of extinction suffered in the V and K bands by the new symbiotic stars was computed from direct integration over the whole band transmission profiles (and not simply at their effective wavelengths), following the procedures outlined in Fiorucci & Munari (2003). This ensures a higher consistency of the results. The distance was then worked out assuming that emission in the K band is entirely due to the red giant, with negligible contribution from either free-free emission from the nebular component or thermal emission from circumstellar dust. Based on the infrared colors of symbiotic stars, Whitelock and Munari (1992) found that, while it is possible that a few dust-free symbiotic M stars may be similar to the bright M giants of the solar neighborhood, it is clear that as a group the symbiotic stars resemble the fainter M giants of the Bulge. For this reason, we adopted the calibration into absolute magnitudes of M spectral types as given by Frogel & Whitford (1987): we used the median values in their Table 3a, scaled to a solar Galactocentric distance of 8.0 kpc.
The spectral type of the giant, the reddening, the extinction in V and K bands, the adopted absolute magnitude of the giant and the derived distance for the new symbiotic stars are summarised in Table 1. This information is not given for the new D-type symbiotic star IPHASJ194607.52+223112.3 whose cool giant is not visible in our spectra.
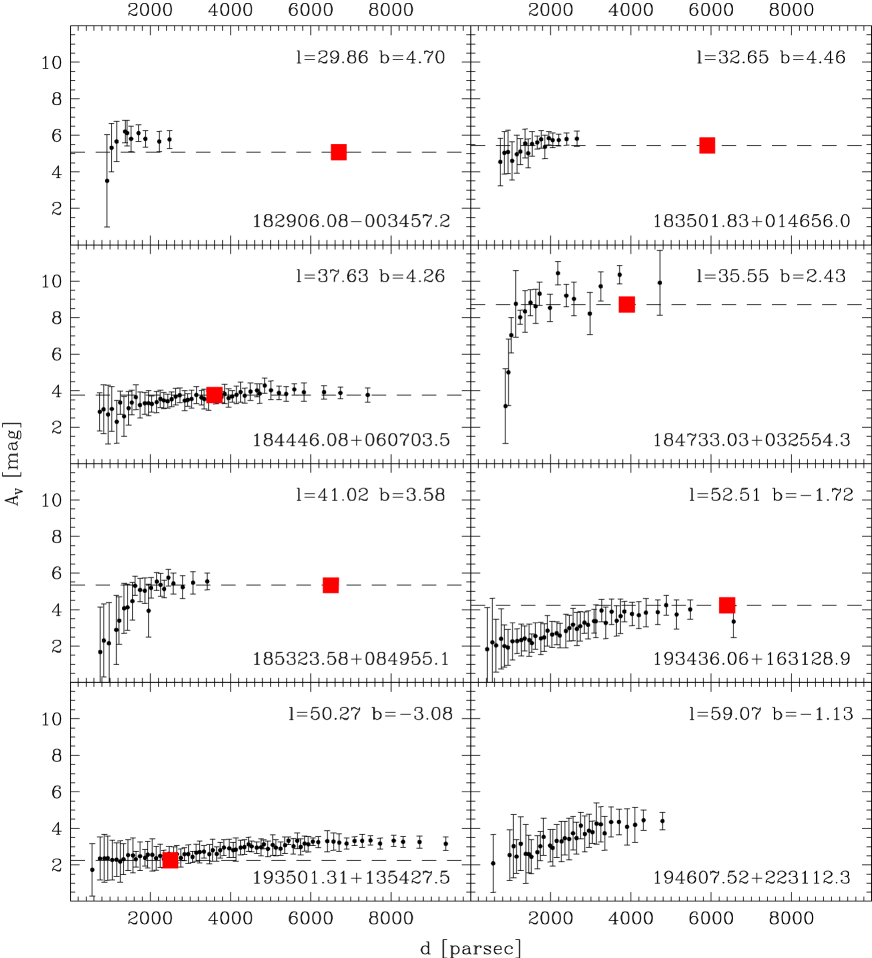
These reddening and distance values are compared with extinction-distance relationships along the line of sight toward each object. Indeed, the IPHAS photometry allows the determination of extinction-distance curves using a large number of main-sequence field stars. The technique has been presented and discussed by Sale et al. (2009). Fig. 6 shows the curves for the newly discovered symbiotic systems, derived from sky areas of around each line of sight, except for IPHASJ182906.08-003457.2 and IPHASJ184733.03+032554.3 where the area considered is twice as large to allow a sufficient number of stars to be included. In these two cases, the usual seeing constraint for IPHAS quality photometry (1′′.7) was also relaxed to 2′′.
The distance and extinction derived by fitting the spectra match within the errors the growth of the interstellar extinction along each line of sight. In all but one instance (IPHASJ193501.31+135427.5), the new symbiotic stars have a reddening value matching the plateau of the extinction curves produced when the line of sight breaks out of the thin dust layer in the Galactic plane. The overall picture of consistency raises our confidence in the parameters of each system listed in Tab. 1.
3.2 Two other candidates
In two other sources, namely IPHASJ190441.53–005957.2 and IPHASJ190832.31+051226.6 (see Tabs. 2 and LABEL:T-yso2), a red giant continuum and an emission line spectrum were detected. Their spectra are fit by an M6.8 III star and =0.87 reddening, and by M4-6 III and 1.6, respectively. However, the emission lines observed are all of low ionization, with only hints of [O iii] emission in IPHASJ190832.31+051226.6.
While completing this article, we noticed that IPHASJ190832.31+051226.6 brightened 1.8 mag in from 2004 to 2008 while its colour decreased almost one magnitude. This might indicate the onset of an outburst in the system. We are collecting new data to further investigate the nature of this interesting object.
3.3 Objects borderline between symbiotic stars and planetary nebulae


Four objects in our list, namely IPHASJ012544.66+613611.7, IPHASJ053440.77+254238.2, IPHASJ194907.23+211742.0 and IPHASJ200514.59+322125.1 (see Tabs. 2 and LABEL:T-yso2), also have a nebular spectrum, as well as 2MASS colours typical of D-type symbiotic stars. The spectrum of IPHASJ194907.23+211742.0 is indeed very similar to that of the genuine symbiotic Mira He 2-104 (cf. the atlas of Munari & Zwitter 2002). However, the absence of both the red giant bands and the Raman scattered emission features in their optical spectra does not allow, at present, a classification as genuine symbiotic stars. In fact, they are discussed in detail by Viironen et al. (2009a) and classified as young planetary nebulae. They form part of a larger sample of objects, including very well studied nebulae like M 2-9 or Mz 3, whose nature as young planetary nebulae or symbiotic stars is controversial. The problem and its complexity have been reviewed by Santander-García, Corradi & Mampaso (2009).
4 Other objects
We now turn to the remaining 48 objects for which we have spectra, whose properties and classification are also summarised in Tables 2 and LABEL:T-yso2. Five of them are confirmed as emission line objects, but are otherwise not yet observed with sufficient signal to allow a probable object type to be assigned to them – these are listed as ’not classified’. Of the remaining 43 objects, 3 are clearly Wolf-Rayet (WR) stars, and 3 more may be relatively high-luminosity evolved massive stars. We also have an emission line object that is undoubtedly high excitation and helium-rich, may be associated with an extended nebula visible in the IPHAS images, but evades classification as a PN. We say a few more words on these relatively rare objects below. A more commonplace finding is represented by IPHASJ184222.67+025807.0 – here, it is the only star we label as dMe. We base this on its relatively weak H emission (its equivalent width, at 13 Å, is the lowest in this sample), absence of any further indicators of accretion, and lack of apparent association with a star-forming region.
By far the largest distinctive sub-groupings are of (i) lightly-reddened classical T Tauri stars, labelled CTT in Tab. LABEL:T-yso2, of which there are 17, and (ii) more highly reddened, intrinsically brighter emission line objects which, in the main, may be either more massive young stars of HAeBe type or classical Be stars (18 objects, variously labelled YSO, or Be/YSO). We look at these more closely first.
4.1 Young stellar objects and classical Be stars
Properties common across this group are the presence in their spectra of CaII, OI 8446 and permitted FeII line emission – nearly all objects in both the CTT and Be/YSO groups present one or more of these, in addition to strong Balmer line emission.
To earn the designation “CTT” in Table LABEL:T-yso2, the observed spectrum should show evidence of a late type K/M photosphere, along with relatively narrow H emission. For nearly all the objects in this group, we give no measurement of H FWHM for the reason that the line emission appears unresolved. For the cases that the FWHM is quoted, it is modest, between 180 and 350 km s-1, quite typical of T Tauri stars. In all cases the H emission equivalent width is above the threshold for the rough estimate of photospheric spectral type at which it is reasonable to infer ongoing accretion (see e.g. figure 4 in Valdivieso et al. 2009, and Barrado y Navascues and Martín 2003).
As would be expected, some objects in the CTT group show signs of continuum veiling in their optical spectra. In one case (IPHASJ230342.17+611850.4) the veiling obliterates the underlying photosphere, but we classify it as CTT on account of the similarity of its optical spectrum to that of DG Tau (Hessman & Guenther 1997), and tentative evidence of LiI 6707 in absorption. In two further objects the continuum is well-enough exposed to provide definite detections of LiI 6707 in absorption. CaII emission is very common in this group, as previously noticed by Vink et al. (2008) in the CTTs of Cyg OB2. The NIR colours of these objects conform with expectation in that they scatter along the often-drawn T Tauri locus, and range from exhibiting no discernable NIR excess to, in one instance, presenting with a very marked one (see Fig. 11 and Sect. 5). Possibly the most extreme example in this group, deserving of individual mention is IPHASJ183807.38+001113.6 (Fig. 7, top): it stands out on account of its extraordinarily high contrast H (at an equivalent width of 500 Å), and its M5 photospheric type.
A unifying property of the objects that have been labelled as YSO or Be/YSO is the presence of a significantly reddened optical continuum, against which only interstellar absorption is seen (NaI D lines, and a number of diffuse interstellar bands). Of course it is not ruled out that photospheric absorption might become more apparent at appreciably higher S/N ratio than is typical of the data presently available - indeed there are 4 objects in which we catch sight of HeI in absorption. For 10 out of this set of 18 objects we are able to resolve the H profile FWHM and find it ranging from 200 km s-1 up to 500 km s-1. At the high end of this range, it seems more likely that these objects are main sequence or more evolved Be objects. A further consideration that pushes in this direction is the presence of diffuse interstellar bands at high equivalent width, since they signal long sightlines through the diffuse ISM, which in turn implies correspondingly high intrinsic source brightness. Conversely, it is possible to be more confident of a YSO designation where a clear NIR excess is present (see Sect. 5). But without further data the existing designations have to be viewed as best guesses.
IPHASJ190021.58+052001.1 (Fig. 7, bottom) is almost in a class of its own in that, uniquely, its spectrum presents an array of forbidden lines indicating a compact HII region. There is also a detectable continuum and breadth to the H emission line, likely to be stellar in origin. This star is presumably responsible for the ionization of the circumstellar environment – hence its inclusion under the Be/YSO heading.


4.2 IPHASJ190015.86+000517.3, IPHASJ193038.84+183909.8 and IPHASJ201708.12+410727.0: three new Wolf-Rayet stars
IPHASJ190015.86+000517.3 (Fig. 8, top), is a newly discovered Wolf-Rayet star with a spectrum that can be typed as WC8, based on comparison with the spectrophotometric library due to Torres & Massey (1987). This can be considered as a sort of serendipitous discovery, as H is absent and the modest H excess displayed by the object is due to the CIV 6560 broad emission. The Galactic latitude of this object, , takes it further out of the Galactic mid-plane than is usual for massive WR stars.
In contrast, IPHASJ193038.84+183909.8 and IPHASJ201708.12+410727.0 (Fig. 8, second and third row, respectively) are new WR stars of WN type. Gvaramadze et al. (2009) have linked the latter object, already listed as an emission line object by Kohoutek & Wehmeyer (1999), to a ring nebula detected at mid-infrared wavelengths. They have analysed its optical spectrum and assign a spectral type WN8-9h. As the pattern of emission lines present in the optical spectra of both these stars is very nearly identical, the spectral type of IPHASJ193038.84+183909.8 must also be WN8-9. Gvaramadze et al. (2009) deduce the reddening to IPHASJ201708.12+410727.0 (or WR 138a) to be . By comparing the dereddened SED of this object to progressive dereddening of IPHASJ193038.84+183909.8, we estimate that the visual extinction of this second WN star is somewhat higher at magnitudes.
Note that the WC star we have found lies in a position in the NIR diagram (see Fig. 11) entirely consistent with the WC locus identified by Homeier et al. (2003), who put together data on a large sample of WR stars. The two WN stars also fall in the region typical of already-known WN stars.
4.3 IPHASJ195935.55+283830.3: a helium-rich source surrounded by a large nebula
We show the spectrum of IPHASJ195935.55+283830.3 at the bottom of Figure 8. Ahead of in-depth analysis it is difficult to know how to type this object convincingly. The emission line spectrum is quite rich and highly-excited, with all but the H line spectrally-unresolved (a Gaussian fit to H yields a deconvolved FWHM of 350 km s-1). Both HeI and HeII lines are seen in emission, and it is striking that the HeII 4686 dwarfs H. There is undoubtedly helium enrichment here. Nitrogen appears also to be enhanced, considering that the [OIII] 4959,5007 lines are scarcely present, while [NII]6548,6583 is strong in this generally high-excitation spectrum. On dereddening the SED, assuming , a very blue O-type continuum is recovered, but no obvious stellar features are seen with the present resolution and S/N. The NIR excess of this source is also remarkable (see Tab. 2).
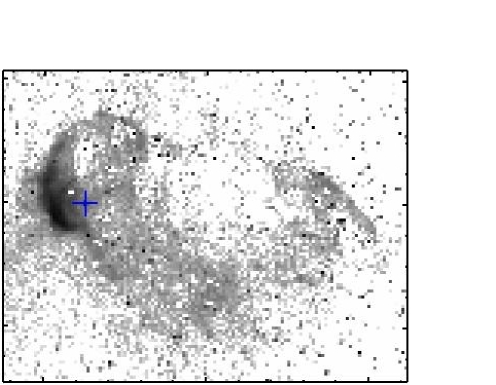
This object is associated with a faint, asymmetrical ionized nebula with a major axis that is nearly 10 arcmin long (Fig. 9). In particular, the star is located near the bright, bow-shaped eastern edge of the nebulosity.
We note that the spectrum of IPHASJ195935.55+283830.3 is very similar to that of NaSt1 (Crowther and Smith (1999)), except that in the latter H is relatively narrow (FWHM50 km s-1). These authors suggest that such a spectrum is produced in dense photoionized ejecta consisting of fully CNO-processed gas, which prevents the observation of a Wolf-Rayet central star of early WN or WC type. This is the reason why IPHASJ195935.55+283830.3 is marked as “WR nebula?” in Tab. LABEL:T-yso2. However, alternative hypotheses should be explored, like the possibility that the source is a young compact binary emerging from a PN phase. A deeper analysis, including additional data that we are acquiring for both the spatially-unresolved emission-line source and the surrounding large nebula, will be presented in a forthcoming paper.
4.4 IPHASJ205544.33+463313.5, and IPHASJ190229.97-022757.0, two B[e] stars
The spectra of IPHASJ205544.33+463313.5 and IPHASJ190229.97-022757.0 (Fig. 10, top and middle, respectively) are notable for their low excitation permitted and forbidden lines, including for the latter, fluorescent [NiII]. Both exhibit very pronounced NIR excesses also (see Table 2 and Sect. 5) and enormously high-contrast H emission. This combination of properties is what has been dubbed the ’B[e] phenomenon’ (Lamers et al. 1998). The presentation of [NiII] fluorescent emission, identified via the ratios among the 6666, 7378 and 7412 line, is not very common – other locations noted for it include the LBV P Cygni and the Orion Nebula (see Lucy 1995 for a discussion of the fluorescent process). It appears to signal strongly illuminated circumstellar environments. For IPHASJ190229.97-022757.0, the rough 6666:7378:7412 flux ratio pattern is 0.17:1:0.44 – to be compared with the pattern for P Cygni (Barlow et al. 1994) that is 0.13:1:0.27.
4.5 IPHASJ185005.71-004041.2: low-mass or massive star?
IPHASJ185005.71-004041.2 (Fig. 10, bottom) has a much more subdued emission line spectrum than the B[e] stars discussed in the previous section. However, it shares with IPHASJ190229.97-022757.0 the presence of [NiII] fluorescent emission. The 6666:7378:7412 flux ratio pattern in this case is even closer to the P Cygni prototype (0.12:1:0.29). Quite marked [NII] emission is seen in this object also, but no HeI is apparent.
Understanding the nature of this source with the present data is difficult. The presence of [NiII] fluorescent emission would suggest that it might also be a massive evolved star, perhaps a LBV. But the [NiII] flux ratio also points to low reddening ( mag) for what is a highly reddened mid-plane sightline (, ), which would make it relatively close and thus intrinsically faint. On the other hand, the detection of reasonably strong DIB absorption and the 2MASS colours of the object suggest instead a significant reddening, i.e. a relatively distant luminous object. Given the uncertainty on its absolute magnitude, until a higher quality spectrum is available no classification is proposed in Tab. LABEL:T-yso2 for this star.


5 Discussion and perspectives
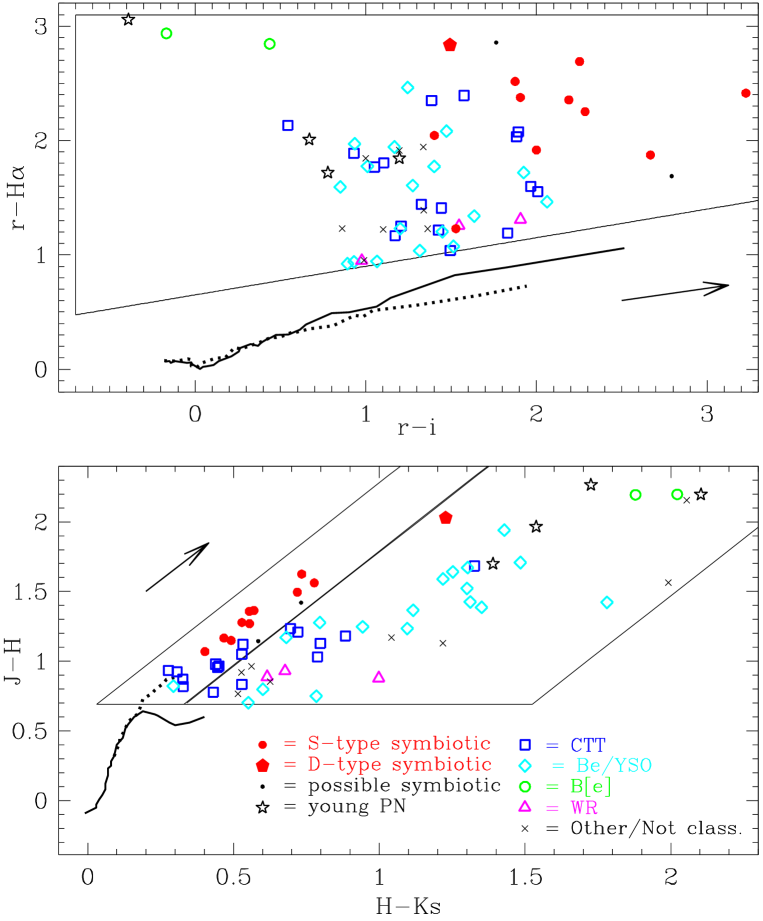
The IPHAS and 2MASS colour-colour diagrams for the sample of sources observed spectroscopically, including the three new symbiotic stars presented in paper I, are shown in Fig. 11. The new symbiotic stars are generally displaced toward the upper-right side of the IPHAS diagram compared to the other H emitters that we have observed. In the 2MASS diagram, the S-type symbiotic stars form an isolated clump corresponding to reddened cool giants. T Tauri and other young stars are much more dispersed in both diagrams, and are generally found at smaller H colours than symbiotic systems.
Comparison with Figs. 1 and 2 of paper I shows that the new symbiotic stars from IPHAS generally have redder colours – both in the optical and in the near-IR – than the sample of objects of this class which were previously known. They are also optically fainter: their magnitudes are between 14.0 and 18.5, compared to the sample of known objects considered in paper I, which were mostly filling the magnitude interval between r=9.5 and r=14.5 mag. The luminosity difference is smaller if the K band is considered, which encourages the conclusion that the redder colours and fainter optical magnitudes are mainly due to the greater interstellar reddening, encountered along many of the lines of sight in the Galactic plane explored by IPHAS. Thus, as expected IPHAS seems to mainly discover reddened objects, which previously escaped detection because of their relatively faint optical magnitude. The IPHAS symbiotic stars discovered so far are concentrated between R.A.=18.5 h (close to the southern limit where the IPHAS coverage starts) and R.A.=20.5 h, i.e. at Galactic longitudes between 30 and 81 degrees. These are directions towards the inner Galaxy: considering the distances in Tab. 1, we conclude that at least half of the new symbiotic stars are located on the side of the bulge closer to the Sun.
Together with the three objects of paper I, so far we have found
eleven new symbiotic systems in the Galactic plane.
Considering that before our survey only eleven systems were known in
the IPHAS area (Belczyński et al. 2000), we have doubled the number
of symbiotic stars known in this region of the sky. The
result is positive, but we are still orders of magnitude below the
large number of objects predicted to exist in the Galaxy (see
Sect. 1). In order to obtain a new, reliable estimate of the total
Galactic population of symbiotic stars, the following steps have to be
followed:
-
•
Build a complete sample of candidates.
The possible symbiotic stars in paper I were selected from the list of IPHAS H emitters by Witham et al. (2008), which in turn was built when the survey’s photometric catalogue was only partially completed. We now need to produce a complete, magnitude limited sample of candidates, scanning the whole IPHAS photometric catalogue in a similar way as done by Viironen et al. (2009b) for compact PNe. A similar search is foreseen in the opposite hemisphere when the IPHAS southern extension, VPHAS+, will be carried out at the 2.6mVST in Chile. The latter will also cover part of the Galactic bulge, where a large fraction of symbiotic stars are located. -
•
Estimate accurately our success rate for the detection of symbiotic stars from the photometric selection.
So far, including the results in paper I, our success rate for S-type symbiotic stars is close to 50% (10 out of 22 candidates observed spectroscopically). As paper I lists 337 candidates, we might expect to find another 150 new S-type systems if we continue the spectroscopic follow up. However, the newly discovered systems have redder and colours than the majority of the candidates (cf. Fig. 6 of paper I), most of which are also quite faint. Thus if the remaining objects prove to be symbiotic stars, they would be faint red giants with little reddening, i.e. faraway objects in clear lines of sight, a combination that is unlikely in the Galactic plane. Indeed, all the objects located in the lowest part of the selection box for S-types observed spectroscopically, turned out to be young stars. We conclude that our global success rate will be significantly lower than obtained so far. More spectra are needed in order to determine this.We have found only one new D-type system. Spectroscopy confirms the idea discussed in paper I that the vast majority of candidates in the adopted D-type selection boxes are young or massive stars. As D-type systems represent 15–20% of the known sample of Galactic symbiotic stars, the effect of missing them is not dramatic and can be taken into account via a correction factor.
-
•
Transform the estimate of the total number of objects in the IPHAS area to the total number in the Galaxy.
This implies introducing the results of our search (completeness and success rate as a function of magnitude and direction) into a model that includes the spatial distribution of symbiotic stars in the Galaxy and the growth of interstellar extinction in every direction.
Acknowledgements.
We are grateful to many of our collaborators in the IPHAS project, for continuous discussion about the properties of the variety of objects that are involved in the analysis of the survey data. RLMC, ERRF, AM, and KV acknowledge funding from the Spanish AYA2007-66804 grant. We are grateful to the Mount Stromlo and Siding Spring Observatory Time Allocation Committee for enabling the spectroscopic follow-up to be obtained.References
- Acker & Stenholm (1990) Acker, A., Stenholm, B. 1990, A&AS 86, 219
- Allen (1984) Allen, D.A. 1984, PASA 5, 369
- Barlow et al. (1994) Barlow M. J., Drew J. E., Meaburn J., Massey R. M., 1994, MNRAS, 268, L29
- Barrado Y Navascués and Martín (2003) Barrado Y Navascués, D., Martín, E.L. 2003 AJ 126, 2997
- Belczyński et al. (2000) Belczyński, K., Mikolajewska, J., Munari, U., Ivison, R.J., Friedjung, M. 2000, A&AS 146, 407
- Corradi (2003) Corradi, R.L.M., 2003, in “Symbiotic stars probing stellar evolution” ASP Conf. Series, Vol. 303, p. 393
- Corradi et al. (2008) Corradi, R.L.M., Rodriguez-Flores, E.R., Mampaso, A., et al. 2008, A&A 480, 409 (paper I)
- Crowther and Smith (1999) Crowther, P.A., Smith, L.J.1999, MNRAS 308, 82
- Drew et al. (2005) Drew, J., Greimel, R., Irwin, M.J., et al. 2005, MNRAS 362, 753
- Fiorucci & Munari (2003) Fiorucci, M., Munari, U. 2003, A&A 401, 781
- Fitzpatrick (1999) Fitzpatrick, E.L. 1999, PASP 111, 63
- Fluks et al. (1994) Fluks, M.A., Plez, B., The, P.S., de Winter, D., Westerlund, B.E., Steenman, H.C. 1994, A&AS 105, 31
- Frogel & Whitford (1987) Frogel, J.A., Whitford, A.E. 1987, ApJ 320, 199
- Gvaramadze et al. (2009) Gvaramadze, V.V., Fabrika, S., Hamann, W.-R et al. 2009, MNRAS, in press
- Hachisu, Kato & Nomoto (1999) Hachisu I., Kato M., Nomoto K. 1999, ApJ 519, 314
- Hessman & Guenther (1997) Hessman F. V., Guenther E. W. 1997, A&A 321, 497
- Homeier et al. (2003) Homeier N. L., Blum R. D., Pasquali A., Conti P. S., Damineli A. 2003, A&A 408, 153
- Kirkpatrick, Henry and McCarthy (1991) Kirkpatrick, J.D, Henry, T.J., McCarthy, D.W. 1991, ApJS 77, 417
- Krause et al. (2003) Krause et al. 2003, A& A 398, 1007
- Jordan et al. (1996) Jordan, S., Schmutz, W., Wolff, B., Werner K., Mürset U., 1996, A&A 312, 897
- Kohoutek (1965) Kohoutek, L. 1965, Bull. Astron. Inst. Czech. 16, 221
- Kohoutek & Wehmeyer (1999) Kohoutek, L., Wehmeyer, R. 1999 A&AS 134, 255
- Lamers et al. (1998) Lamers H. J. G. L. M., Zickgraf F.-J., de Winter D., Houziaux L., Zorec J. 1998, A&A 340, 117
- Lucy (1995) Lucy L. B., 1995, A&A 294, 555
- Magrini, Corradi & Munari (2003) Magrini, L., Corradi, R.L.M., Munari, U., 2003, in “Symbiotic stars probing stellar evolution” ASP Conf. Series, Vol. 303, p. 539
- Munari & Buson (1994) Munari, U., Buson, L.M. 1994, A&A 287, 87
- Munari & Renzini (1992) Munari, U., Renzini, A. 1992, AJ 397, 87
- Munari & Zwitter (2002) Munari, U., Zwitter, T. 2002 A&A 383, 188
- Osterbrock and Ferland (2006) Osterbrock, D.E., Ferland, F.J. 2006, “Astrophysics of Gaseous Nebulae and Active Galactic Nuclei”, 2nd ed., Sausalito, CA: University Science Books
- Paczynski & Rudak (1980) Paczynski, R. & Rudak, R. 1980, A&A 82, 349
- Robertson & Jordan (1989) Robertson, T.H., Jordan T.M. 1989, AJ 98, 1354)
- Santander-García et al. (2008) Santander-García, M., Corradi, R.L.M., Mampaso, A. et al. 2008, A&A 485, 117
- Santander-García, Corradi & Mampaso (2009) Santander-García, M., Corradi, R.L.M., Mampaso, A. 2007, in “Asymmetrical Planetary Nebulae IV”, Corradi, R.L.M., Manchado, A. & Soker, N. eds., IAC, p. 555 (http://www.iac.es/proyecto/apn4/pages/proceedings.php)
- Sale et al. (2009) Sale S. E., Drew J. E., Unruh Y.C., et al. 2009, MNRAS, 392, 497
- Sokoloski (2003) Sokoloski, J.L. in “Symbiotic stars probing stellar evolution”, ASP Conf. Series, Vol. 303, p. 202
- Tomov (2003) Tomov, T. 2003, in “Symbiotic stars probing stellar evolution”, ASP Conf. Series, Vol. 303, p. 376
- Torres & Massey (1987) Torres, A. V., Massey P., 1987, ApJS, 65, 459
- Tutukov & Yungelson (1976) Tutukov, A.V. & Yungelson, L.R., 1976, Afz 12, 521
- Valdivieso et al. (2009) Valdivielso, L., et al. 2009, A&A, 497, 973
- (40) Viironen, K., Mampaso, A., Corradi, R.L.M., et al. 2009a, A&A, in press
- (41) Viironen, K., Greimel, R., Corradi, R.L.M. et al. 2009b, A&A, in press
- Vink et al. (2008) Vink, J.S., Drew, J.E., Greimel, R., et al. 2008, MNRAS 387, 308
- Witham et al. (2008) Witham, A.R., Knigge, C., Drew, J.E., et al. 2008, MNRAS, 384, 1277
- Whitelock & Munari (1992) Whitelock, P.A., Munari, U. 1992, A&A 255, 171
| Name (IPHASJ….) | r | i | H | J | H | K |
|---|---|---|---|---|---|---|
| [mag] | ||||||
| 000432.31+580854.0 | 17.36 | 16.02 | 15.41 | 13.63 | 12.86 | 12.35 |
| 012544.66+613611.7 | 18.87 | 18.20 | 16.86 | 15.48 | 13.22 | 11.49 |
| 031704.34+601500.0 | 16.65 | 15.33 | 15.21 | 13.33 | 12.35 | 11.91 |
| 032039.49+562358.2 | 14.68 | 13.40 | 13.07 | 10.95 | 9.57 | 8.22 |
| 035823.95+522312.6 | 18.96 | 17.77 | 17.05 | 15.74 | 14.83 | 14.30 |
| 045625.15+434931.8 | 18.13 | 17.13 | 16.29 | 15.25 | 14.08 | 13.04 |
| 053018.12+313558.9 | 16.95 | 16.02 | 16.01 | 14.32 | 13.50 | 13.21 |
| 053113.16+382006.6 | 16.53 | 15.68 | 14.94 | 12.54 | 11.74 | 11.14 |
| 053440.77+254238.2 | 17.48 | 16.28 | 15.63 | 14.09 | 12.12 | 10.58 |
| 055254.08+171424.7 | 16.47 | 15.54 | 14.58 | 13.86 | 13.03 | 12.50 |
| 060515.15+204036.7 | 17.82 | 16.48 | 16.43 | 14.77 | 13.21 | 11.22 |
| 060821.91+295255.7 | 17.80 | 16.35 | 16.39 | 14.41 | 13.37 | 12.84 |
| 183748.03-001617.2 | 16.94 | 15.51 | 15.72 | 13.25 | 12.32 | 12.04 |
| 183807.38+001113.6 | 18.47 | 17.08 | 16.12 | 14.20 | 13.24 | 12.79 |
| 183814.63-012213.8 | 17.30 | 15.30 | 15.75 | 12.16 | 10.98 | 10.10 |
| 184222.67+025807.0 | 16.03 | 15.04 | 15.08 | 13.32 | 12.36 | 11.80 |
| 184431.46-001652.4 | 17.21 | 15.76 | 16.00 | 12.54 | 10.87 | 9.56 |
| 184635.85+005521.4 | 14.86 | 13.69 | 13.70 | 11.73 | 10.04 | 8.72 |
| 185005.71–004041.2 | 16.95 | 15.59 | 15.72 | 13.00 | 11.87 | 10.66 |
| 185349.55+052353.7 | 18.48 | 17.08 | 16.70 | 14.34 | 13.06 | 12.26 |
| 185424.82+041905.0 | 18.29 | 16.46 | 17.10 | 13.13 | 11.92 | 11.20 |
| 185448.29+005033.5 | 18.32 | 16.43 | 16.25 | 13.57 | 12.45 | 11.92 |
| 190015.86+000517.3 | 14.94 | 13.97 | 13.99 | 12.18 | 11.30 | 10.30 |
| 190021.58+052001.1 | 17.90 | 16.73 | 15.95 | 13.73 | 12.09 | 10.83 |
| 190229.97–022757.0 | 16.13 | 16.30 | 13.19 | 13.42 | 11.22 | 9.34 |
| 190441.53–005957.2 | 15.88 | 13.08 | 14.19 | 8.89 | 7.75 | 7.16 |
| 190832.31+051226.6 | 17.79 | 16.02 | 14.93 | 10.68 | 9.26 | 8.53 |
| 190857.31+053620.6 | 16.89 | 15.82 | 15.95 | 12.83 | 11.47 | 10.35 |
| 191017.43+065258.1 | 15.82 | 13.89 | 14.10 | 10.42 | 8.71 | 7.22 |
| 192033.79+231040.3 | 16.89 | 15.39 | 15.85 | 13.43 | 12.65 | 12.22 |
| 192249.80+142236.3 | 16.96 | 15.32 | 15.62 | 12.61 | 11.19 | 9.88 |
| 192400.05+230253.1 | 15.79 | 14.68 | 14.56 | 12.82 | 11.97 | 11.34 |
| 192515.05+224720.3 | 16.40 | 15.29 | 14.60 | 13.38 | 12.57 | 12.24 |
| 192841.27+174819.9 | 16.70 | 15.49 | 15.47 | 13.67 | 12.43 | 11.48 |
| 193038.84+183909.8 | 13.26 | 11.35 | 11.95 | 8.21 | 7.28 | 6.60 |
| 193232.88+151711.5 | 14.16 | 13.27 | 13.24 | 11.73 | 10.98 | 10.20 |
| 194609.56+225423.2 | 15.20 | 13.69 | 14.12 | 11.50 | 10.79 | 10.24 |
| 194907.23+211742.0 | 16.77 | 15.99 | 15.05 | 13.58 | 11.88 | 10.49 |
| 195935.55+283830.3 | 15.81 | 14.95 | 14.58 | 12.48 | 10.32 | 8.27 |
| 200514.59+322125.1 | 17.24 | 17.63 | 14.18 | 14.96 | 12.76 | 10.66 |
| 201057.51+343732.4 | 15.68 | 14.36 | 14.64 | 12.08 | 10.84 | 9.75 |
| 201152.98+281517.0 | 17.26 | 15.31 | 16.00 | 12.31 | 10.71 | 9.50 |
| 201708.12+410727.0 | 14.29 | 12.74 | 13.04 | 10.15 | 9.27 | 8.65 |
| 201918.94+381448.5 | 18.61 | 17.68 | 16.64 | 16.04 | 14.87 | 14.19 |
| 202834.25+355417.4 | 15.89 | 14.42 | 13.81 | 11.50 | 10.08 | 8.29 |
| 202947.93+355926.5 | 14.75 | 13.74 | 12.98 | 10.96 | 9.44 | 8.14 |
| 203413.39+410157.9 | 19.00 | 17.75 | 16.54 | 13.23 | 11.29 | 9.86 |
| 203545.40+400332.6 | 19.46 | 17.50 | 17.86 | 14.93 | 13.96 | 13.51 |
| 204134.22+393239.0 | 15.16 | 14.11 | 13.39 | 12.12 | 10.99 | 10.20 |
| 205544.33+463313.2 | 15.72 | 15.28 | 12.87 | 12.61 | 10.41 | 8.39 |
| 210404.87+535124.4 | 18.21 | 16.63 | 15.82 | 13.43 | 12.40 | 11.61 |
| 222628.63+612049.0 | 18.68 | 18.13 | 16.54 | 14.62 | 13.75 | 13.42 |
| 230342.17+611850.4 | 17.55 | 15.66 | 15.52 | 13.04 | 11.81 | 11.12 |
| 231334.92+620944.1 | 17.12 | 15.91 | 15.87 | 14.13 | 13.21 | 12.90 |
3
| Name (IPHASJ….) | Spectral | Continuum and | Main emission features | H | Classification | |
|---|---|---|---|---|---|---|
| range | absorption features | EW | FWHM | |||
| [nm] | [Å] | [ km s-1] | ||||
| 000432.31+580854.0 | 370-750 | featureless | HI,HeI,FeII,CaII H&K | 195 | 350 | Not classified |
| 012544.66+613611.7 | 370-835 | negligible | nebular⋆,OI8446,CaII IR trip. | 950 | – | young PN⋆ |
| 031704.34+601500.0 | 390-780 | TiO | HI, FeII,CaII H&K | 122 | – | CTT |
| 032039.49+562358.2 | 370-870 | featureless,DIB,NaI D | HI,FeII,OI7772,8446,CaII IR trip.: | 210 | – | YSO |
| 035823.95+522312.6 | 390-745 | featureless | HI,FeII,HeI: | 200 | 250 | Not classified |
| 045625.15+434931.8 | 600-740 | featureless | H | 60 | – | Not classified |
| 053018.12+313558.9 | 370-780 | featureless,DIB | HI,HeI | 45 | – | Be/YSO |
| 053113.16+382006.6 | 535-745 | featureless,DIB+NaI | H | 63 | 500 | Be/YSO |
| 053440.77+254238.2 | 370-870 | featureless,DIB | nebular⋆,OI8446,CaII H&K + IR trip. | 200 | 300 | young PN⋆ |
| 055254.08+171424.7 | 350-900 | faint TiO | HI,Balmer jump,HI,HeI,FeII,CaII H&K + IR trip. | 240 | – | CTT? |
| 060515.15+204036.7 | 600-740 | featureless | H | 62 | 300 | Not classified |
| 060821.91+295255.7 | 384-855 | TiO | HI,HeI,FeII,faint OI8446,CaII H&K + IR trip. | 110 | 230 | CTT |
| 183748.03-001617.2 | 370-900 | faint TiO | HI,faint HeI | 40 | 280 | CTT |
| 183807.38+001113.6 | 390-900 | TiO | HI,HeI,CaII H&K + IR trip. | 500 | – | CTT |
| 183814.63-012213.8 | 370-820 | TiO | H,H,[OI],CaII H&K | 175 | 250 | CTT |
| 184222.67+025807.0 | 370-870 | faint TiO,strong NaI | H | 13 | – | dMe |
| 184431.46-001652.4 | 390-900 | featureless,HeI6678,NaI,DIB | HI,FeII,OI8446,CaII IR trip. | 78 | 400 | Be/YSO |
| 184635.85+005521.4 | 370-900 | Li I 6707,6495,NaI,DIB | HI,FeII,faint HeI,OI8446,[SII],[OI],CaII H&K + IR trip. | 95 | 230 | CTT |
| 185005.71–004041.2 | 425-775 | featureless,DIB | HI,FeII,[FeII],[NII],[NiII]6666,7378,7412 | 65 | 250 | ? (see text) |
| 185349.55+052353.7 | 370-900 | featureless | HI,HeI,FeII,CaII IR trip. | 215 | – | YSO |
| 185424.82+041905.0 | 600-900 | weak TiO | HI,strong CaII IR trip. | 38 | 350 | CTT |
| 185448.29+005033.5 | 370-890 | TiO | HI,HeI,[OI] | 90 | – | CTT |
| 190015.86+000517.3 | 370-900 | rising | dominated by strong broad C lines | – | – | WC8 |
| 190021.58+052001.1 | 430-773 | featureless | HI,FeII,[FeII],[OI],[OII],[NII],[SII] | 180 | 250 | Be/YSO |
| 190229.97–022757.0 | 370-850 | faint continuum | HI,HeI,FeII,[FeII],[OI],[OII],OI8446 | 1500 | 250 | B[e] |
| 190441.53–005957.2 | 370-900 | deep TiO | HI,FeII,faint HeI | 70 | 250 | symbiotic? |
| 190832.31+051226.6 | 370-850 | TiO | HI,HeI,OI8446,[OIII]: | 250 | 280 | symbiotic? |
| 190857.31+053620.6 | 370-900 | featureless,DIB,NaI D | HI,[NII],OI8446 | 90 | 350 | Be/YSO |
| 191017.43+065258.1 | 370-900 | featureless,HeI5876,DIB,NaI D | HI,HeI6678(PCyg),[OI],OI8446,CaII IR trip. | 150 | 350 | YSO |
| 192033.79+231040.3 | 430-775 | TiO | HI | 35 | 100 | CTT? |
| 192249.80+142236.3 | 430-775 | featureless,DIB | H,[OI] | 100 | 330 | Be/YSO |
| 192400.05+230253.1 | 370-900 | featureless | HI,faint CaII H&K | 42 | 300 | Not classified |
| 192515.05+224720.3 | 390-900 | TiO | HI,HeI,CaII H&K | 80 | – | CTT |
| 192841.27+174819.9 | 370-900 | featureless | HI,HeI,FeII,complex H,OI8446,strong CaII IR trip. | 63 | 200 | YSO |
| 193038.84+183909.8 | 370-900 | featureless,DIB | strong HeI, HeII | 120 | 700 | WN8-9 |
| 193232.88+151711.5 | 370-900 | HI,HeI,strong DIB,NaI | HI,FeII,OI8446,CaII IR trip. | 52 | 400 | Be/YSO |
| 194609.56+225423.2 | 380-840 | featureless,DIB,NaI D | H,H | 55 | 250 | Be/YSO |
| 194907.23+211742.0 | 370-900 | faint | nebular⋆ | 250 | – | young PN⋆ |
| 195935.55+283830.3 | 360-835 | featureless,DIB | strong HeI and HeII,HI,[NII],[NeIII],[OIII], | 80 | 350 | WR nebula? |
| [FeVII],[CaVII],[SIII],[ArIII],[ArIV],[ArV] | ||||||
| 200514.59+322125.1 | 370-856 | negligible | nebular⋆,OI8446 | 4000 | – | young PN⋆ |
| 201057.51+343732.4 | 370-870 | featureless,strong DIB | HI,FeII,OI7772,8446,CaII IR trip. | 77 | – | YSO? |
| 201152.98+281517.0 | 370-870 | featureless | HI, OI 8446, strong CaII IR trip. | 85 | 220 | YSO? |
| 201708.12+410727.0 | 370-870 | featureless, DIB | HI,broad strong HeI and HeII | 95 | 700 | WN8-9 |
| 201918.94+381448.5 | 370-880 | featureless | HI,HeI,faint CaII H&K | 380 | – | YSO |
| 202834.25+355417.4 | 372-875 | featureless,HeI5876,Na ID,DIBS | HI,[OI],OI8446,CaII IR trip. | 370 | 200 | YSO |
| 202947.93+355926.5 | 370-870 | featureless,weak HeI | HI,FeII,OI8446,CaII IR trip.: | 180 | 350 | YSO† |
| 203413.39+410157.9 | 510-870 | featureless | H,[OI],OI8446 | 370 | 300 | YSO |
| 203545.40+400332.6 | 370-900 | TiO | HI | 105 | – | CTT |
| 204134.22+393239.0 | 370-870 | faint TiO,LiI 6707 | HI,HeI,FeII,[SII],strong CaII H&K + IR trip. | 160 | 200 | CTT |
| 205544.33+463313.2 | 373-875 | faint | rich FeII,[FeII],HI,faint HeI,OI8446,[Ni II],CaII IR trip. | 1500 | 180 | B[e] |
| 210404.87+535124.4 | 370-860 | TiO | HI,HeI,OI8446 | 350 | 180 | CTT |
| 222628.63+612049.0 | 370-900 | TiO | HI,HeI | 260 | – | CTT |
| 230342.17+611850.4 | 370-900 | featureless | HI,FeII,CaII H&K,[SII],strong CaII IR trip.,OI7772,8446 | 145 | – | CTT |
| 231334.92+620944.1 | 390-780 | TiO,NaI D | HI | 80 | – | CTT |
⋆ Viironen et al. (2009b)
† Krause et al. (2003)