xxx–yyy
Accurate Fundamental Stellar Parameters
Abstract
We combine results from interferometry, asteroseismology and spectroscopic analyses to determine accurate fundamental parameters (mass, radius and effective temperature) of 10 bright solar-type stars covering the H-R diagram from spectral type F5 to K1. Using “direct” techniques that are only weakly model-dependent we determine the mass, radius and effective temperature. We demonstrate that model-dependent or “indirect” methods can be reliably used even for relatively faint single stars for which direct methods are not applicable. This is important for the characterization of the targets of the CoRoT and Kepler space missions.
keywords:
stars: fundamental parameters, stars: abundances, stars: late-type1 Why are fundamental parameters important?
Fundamental parameters are critical for the interpretation of both the exoplanet and asteroseismic data from CoRoT and Kepler. These space missions will provide a huge leap forward in our understanding of the interior physics of stars. This is possible by comparing the observed oscillation frequencies with theoretical pulsation models. It will allow us to examine how we can improve the approximations of the physics in the evolution models. To limit the range of models we need reliable estimates of the fundamental parameters of the target stars. Also, characterization of stars hosting exoplanets is important to understand the properties of transiting systems. Since the targets of CoRoT and especially Kepler are faint we must use indirect methods. We will compare direct and indirect methods and determine to what extent we can constrain , mass and radius.

from spectroscopy with 50 K accuracy
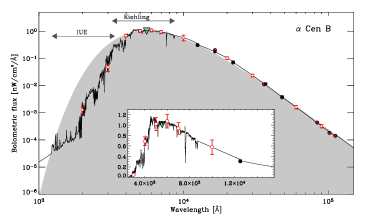
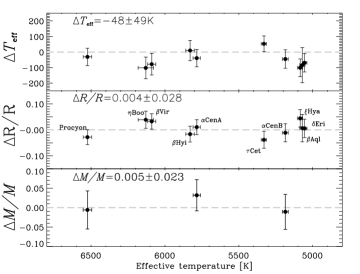
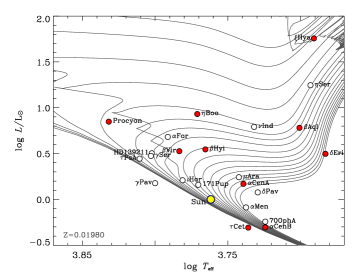
We compared two methods to determine of 10 bright solar-type stars. (1) We used measured angular diameters from the literature combined with the bolometric flux (Fig. 1) yielding from its basic definition. These results are nearly model-independent; only the limb-darkening is from models. (2) We made a “classical” spectroscopic analysis of 100s of Fe i lines requiring that lines with a range of different excitation potentials and line strengths yield the same abundance. We use the VWA tool ([Bruntt et al. 2008, Bruntt 2009]) employing 1D LTE MARCS atmospheric models ([Gustafsson et al. 2008]; spectra are from HARPS@ESO except Boo observed with FIES@NOT). As shown in Fig. 2 (left top panel) the mean difference is K (rms scatter), and there is no significant correlation with . We thus claim that after correcting for the offset we can determine from a high-quality spectrum to K in the spectral range from Procyon A (F5) to Cen B (K1). The stars are shown in the H-R diagram in Fig. 2.
Radius with 3% accuracy without interferometry
We determined the radii of the stars using a direct and an indirect method: (1) We combined the measured angular diameters from the literature with the updated parallaxes from [van Leeuwen (2007)]. (2) We combined the spectroscopic with the luminosity through . The luminosities were determined from the magnitude, BC from [Girardi et al. (2002)], and the parallax from [van Leeuwen (2007)]. The comparison of the two methods to determine is shown in Fig. 2 in the left middle panel. The agreement is good and shows that radii can be determined from indirect methods to % (1- uncertainty).
Mass with 4% accuracy for single stars
Three of the stars are members of binary systems and have well-determined masses (%). For all stars the radius has been measured (%) from interferometry and the mean density is inferred from asteroseismic data (large separation) by scaling from the Sun. Combining the radius and density we get the mass to %. The left lower panel in Fig. 2 compares the mass for the two methods (Procyon A and Cen AB). Although the number of stars is small it is reassuring that the agreement is good (% rms scatter).
References
- [Bruntt 2009] Bruntt, H., 2009, A&A accepted, arXiv 0907.1198
- [Bruntt et al. 2008] Bruntt, H., De Cat, P., Aerts, C., 2008, A&A 478, 487
- [Girardi et al. (2002)] Girardi, L., et al., 2002, A&A 391, 195
- [Gustafsson et al. 2008] Gustafsson, B., et al., 2008, A&A 486, 951
- [van Leeuwen (2007)] van Leeuwen, F., 2007, A&A 474, 653