-
The Warped Disk of Centaurus A from a radius of 2 to 6500 pc
Abstract:
We compile position and inclination angles for tilted ring fits to the warped dusty and gaseous disk spanning radius 1.8 to 6500 pc from recent observations. For radii exterior to a kpc, tilted ring orientations lie on an arc on a polar inclination versus position angle plot, suggesting that precession following a merger can account for the ring morphology. Three kinks in the ring orientations are seen on the polar plot, the one at radius of about 1.3 kpc we suspect corresponds to the location where self-gravity in the disk affects the ring precession rate. Another at a radius of about 600 pc may be associated with a gap in the gas distribution. A third kink is seen at a radius of 100 pc. A constant inclination tilted disk precessing about the jet axis may describe the disk between 100 and 20 pc but not interior to this. A model with disk orientation matching the molecular circumnuclear disk at 100 pc that decays at smaller radii to an inner flat disk perpendicular to the jet may account for disk orientations within 100 pc. Neither model would account for the cusps or changes in disk orientation at 100 or 600 pc.
Keywords: Write keywords here
1 Introduction
In its central regions, NGC 5128 exhibits a well recognized, optically-dark band of absorption across its nucleus. This dusty disk was first modeled as a transient warped structure by Tubbs (1980). The kinematics of the ionized and molecular gas are well modeled by a warped disk composed of a series of inclined connected rings undergoing nearly circular motion (Bland 1986; Bland et al. 1987; Nicholson et al. 1992; Quillen et al. 1992). Recent work has better fit the morphology of the disk in the infrared using Spitzer Space Telescope observations (Quillen et al. 2006b) (and improving on the model fit to disk seen in absorption in the near-infrared; Quillen et al. 1993), with high resolution interferometric molecular CO observations and covering the central arcminute (Espada et al. 2009), tracing the warm molecular hydrogen to within the sphere of influence of the black hole using adaptive optics (Neumayer et al. 2007, 2009), and with new HI observations (Oosterloo et al. 2009).
We take the opportunity to compile tilted ring fits to the disk morphology. The result is a warp geometry, described by tilted ring major axis position and inclination angles as a function of radius, that spans from radius to 350′′ or using a distance of 3.8 Mpc to Centaurus A (Harris et al. 2009) from 1.8 pc to 6.5 kpc. Here the smallest scales are set by the K band resolution of the adaptive optics observations (Neumayer et al. 2007) and the largest scales by the extent of the tilted ring fit to the HI (Oosterloo et al. 2009). The factor of 3600 between the smallest and largest scales is large compared to other studied gaseous disks. This large scale of observations allows us to search for orientation changes caused by different physical processes. In the outer regions the primary processes causing orientation changes are torques from the galactic potential and from perturbations caused by galaxy mergers. Interior to these torques may be caused by a variety of processes including self-gravity in the disk (Sparke 1996), radiation pressure (e.g., Pringle 1996; Maloney et al. 1996), winds or pressure gradients in the ambient ISM (Quillen & Bower 1999; Quillen 2001), and the Bardeen-Petterson effect (e.g., Caproni et al. 2007).
2 Compiling Tilted Ring Fits
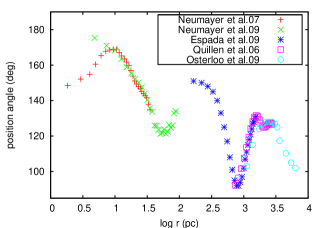
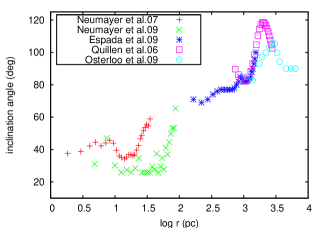
Position and inclination angle for the tilted ring fit to the warm molecular hydrogen emission 1-0 S(1) H2 line at 2.122m were taken from Table 1 by Neumayer et al. (2007) and have a spatial resolution of 0.12′′, covering the central . The submillimeter SMA CO observations have a non-circular beam with widest direction 6′′ FWHM and cover a 1′ field of view (Espada et al. 2009). Angles used are those used to make Figure 8a by Espada et al. (2009) and are those for the tilted ring fit lacking a bar perturbation. The angles from the fit to the 8m morphology seen in Spitzer Space Telescope imaging with the IRAC camera are those used to make Figure 7 by Quillen et al. (2006b). The IRAC camera at 8m has a resolution of 2.2′′. The angles from the tilted ring fit to the new HI observations are by Oosterloo et al. (2009). There are no angles listed within 60′′ from the HI fit because HI is depleted in the center of the galaxy. The fifth set of position and inclination angles are from observations and an associated tilted ring fit that will be described in more detail by Neumayer et al. (2009). The measurements are from integral field spectroscopy with SINFONI and are taken in natural seeing under excellent conditions of 0.5′′, covering a 8 field of view (see Cappellari et al. 2009) and using the same 1-0 S(1) H2 line discussed by Neumayer et al. (2007). Tilted rings were fit to the velocity field using the procedures described by Neumayer et al. (2007). The compiled position and inclination angles from these five studies as a function of log radius in pc are shown in Figure 1. These angles are also listed in Table 1. We note that two sets of these tilted ring fits (Neumayer et al. 2009; Oosterloo et al. 2009) are preliminary and may be updated in future.
The inclination angle is defined such that an edge-on disk is oriented with . Inclinations above refer to those with northern side closer to the viewer (and so masking the northern side of the galaxy) and those below refer to the opposite. The tilted ring fit to the disk seen in extinction (e.g., Quillen et al. 1993) specify which side of the disk is closer to the viewer. The position angle of a ring is that on the sky (counter clockwise from north) of the blue shifted side of its major axis.
There is consistency between the different tilted ring fits in the outer galaxy with the HI based kinematic fit at lower inclination than that done from the Spitzer images. The fit to the Spitzer images was done without kinematic constraints. Because the model was created with a 3D data cube, it was computed faster when the cube was smaller. This likely biased the best fit model to configurations more twisted and compact than the real outer disk. The HI kinematic fit should be considered more accurate than the model used to match the Spitzer images.
The CO data appear to connect the outer and inner regions though we must keep in mind that the molecular gas distribution is dominated in the center by a 100–200 pc radius circumnuclear disk and the gas distribution may contain one or more gaps. The innermost points of the CO ring fit arise from the circumnuclear disk itself and so have well measured position angles. Consequently it is unlikely that the innermost position angles have been overestimated.
The fits to the emission by Neumayer et al. (2007) and Neumayer et al. (2009) overlap and have consistent position angles, but those from the smaller field of view data have about 20∘ higher inclinations. We expect that the fits to high resolution observations by Neumayer et al. (2007) would be more accurate in the center, and those to observations covering a larger field of view by Neumayer et al. (2009) would be more accurate at larger radii. However further analysis (and possibly deeper observations) are required to resolve the discrepancy.
2.1 Outer disk
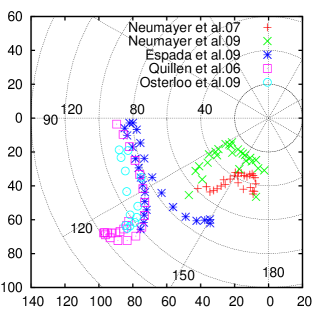
In Figure 2 we show the same angles listed in Table 1 and shown in Figure 1 but on a polar plot. Here the radius of points on the plot is set by the inclination angle and the angle of points on the plot set by the position angle of the tilted rings on the sky. We first discuss the disk exterior to 1 kpc. We see that the ring angles from the outer galaxy lie on an arc. Were we to plot the ring orientations on a sphere the arc on this plot could correspond to part of a circle centered about a particular orientation. The rings in the inner galaxy lie at quite different orientations compared to the rings in the outer galaxy.
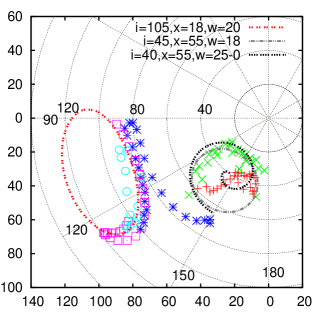
In Figure 3 we show the same polar plot as in Figure 2 but with two separate ovals. Each oval shows vectors that are the same angular distance from a particular orientation. The red oval (on the left) corresponds to all rings that have angular momentum axis 20 degrees from a direction that is 105∘ inclined from the line of sight and at a position angle of on the sky. This is similar to the axis used to set the underlying galaxy symmetry axis assumed by Quillen et al. (1993, 2006b) when generating precession models for the disk, though in neither model was the disk inclination held fixed with respect to the galaxy axis. The model by Quillen et al. (1993) has inclination angle with respect to the assumed underlying galaxy symmetry axis that increases with increasing radius whereas that used to fit the Spitzer data decreases with increasing radius.
The arc in the polar plot from the outer disk can be accounted for with a merger model. Following a merger, gas accreted from another galaxy would have angular momentum that is not necessarily aligned with the symmetry axis of the underlying galaxy. In a coordinate system with respect to a galaxy symmetry axis (assuming the galaxy is approximately axisymmetric) each gas ring would maintain its inclination but would precess about the galaxy symmetry axis. The angular difference between the gas angular momentum and the galaxy symmetry axis sets the size of the oval whereas the galaxy symmetry axis orientation determines the center of the red oval (on the left) in Figure 3.
A simple precession model will not give a perfect fit or prediction because mergers are not expected to leave a gas remnant restricted to a single plane (corresponding to a very narrow distribution of angular momentum orientation), the underlying galaxy itself may be triaxial rather than axisymmetric and would not be static during the merger. The outer HI ring orientations ( kpc or 85′′) lie shifted but not too distant from ring orientations in the disk between 0.8 –1.5 kpc (or 40 – 80′′), suggesting that the angular momentum vector of gas stripped in the outer regions was not too different from that forming the middle regions of the disk.
Within about 1.3 kpc the position angle increases with increasing radius rather than decreases with radius as it does exterior to 1.3 kpc (Figure 1a). This is also seen as a kink or cusp in the points on the lower left in the polar plot (Figure 2). A tilted ring precesses at a rate proportional to the ellipticity of the gravitational potential and the angular rotation of a particle in a circular orbit. Rotation rates are faster in the center of the galaxy so a warped disk should be increasingly corrugated in the center. A reduction in the rate or reversal of direction of precession can cause a cusp in the orientation angles. This kink would either be caused by a variation in galaxy eccentricity, but could also be due to self-gravity in the disk (Sparke 1996). The direction of precession in the outer galaxy and isophotal major axis at a PA of about suggests that either the galaxy is prolate and the disk is oriented near in its symmetry plane or the galaxy is oblate and the disk is in a nearly polar orbit (Quillen et al. 1993; Sparke 1996). A sharp change in galaxy eccentricity is not seen in the m isophotes suggesting that future warp models should reconsider the importance of self-gravity as well as updated mass models for the stellar mass distribution in accounting for the disk morphology.
The outer disk at 8 and 24 m and in HI emission is not symmetrical about the origin (e.g., see Figure 2 by Quillen et al. 2006b) implying that the outer disk is somewhat lopsided. The degree of lopsidedness could be precisely measured from the HI kinematic observations. By studying the evolution of this asymmetry it might be possible to derive constraints on the time since the merger and on the nature of the merging event itself.
2.2 Inner Disk
In the polar plot (Figure 2) there are at least 3 locations where there are abrupt changes in orientation. One change occurs at a radius of about 35′′ or 600 pc, the radius at which Quillen et al. (2006b) failed to find a good model for the Spitzer images and so suggested that there might be a hole in the gas and dust distribution. Espada et al. (2009) found evidence for a gap in the gas distribution between a radius of 200 and 800 pc and also showed that the fits could be improved with a model that included non-circular motions the gas. In Figure 2 the radius of the gap in the gas distribution corresponds to the topmost plotted point where there is a cusp in the CO generated points.
There is a third cusp on the polar angle plot in Figure 2 on the lower right corresponding to orientation angle of the circumnuclear molecular disk at a radius of 100–200 pc (6–12′′). Orientations based on the near-infrared spectroscopy by Neumayer et al. (2009) approach that of the circumnuclear molecular disk, suggesting that there is cusp in the angular orientations at a radius of about 100 pc or 6′′.
The CO circumnuclear molecular disk could be smoothly connected to the disk seen in warm molecular hydrogen within 100 pc. Both the circumnuclear molecular disk at radius 100–200 pc and the innermost rings at a radius of 2 pc are approximately perpendicular to the jet axis, though the innermost points have lower inclinations than the circumnuclear disk. The radio and X-ray jets have a position angle of (Burns et al. 1983; Kraft et al. 2000) with the northern jet suspected to be closer to the observer. VLBI studies suggest that the jet axis lies between 50 and 80∘ from our line of sight (Tingay et al. 1998), however apparent motions suggest an angle between 20 and 40∘ (Hardcastle et al. 2003). A disk perpendicular to the jet would have a major axis position angle of 145∘. If the disk at the smallest measured radii is perpendicular to the jet then the jet is about 40∘ from the line of sight.
On Figure 2 the points by Neumayer et al. (2009) (green X-s) are at higher inclination than those by Neumayer et al. (2007) (red plus signs). Both fits at pc begin near the orientation of the circumnuclear disk on the left in Figure 2 and Figure 3. With decreasing radius, the green points (X-s) (Neumayer et al. 2009) move upwards (to lower inclination) and then to the right, whereas the red points (plus signs) (Neumayer et al. 2007) move to the right and then back to the left at the smallest radii.
Perhaps the circumnuclear molecular disk orientation and that seen interior to it can be connected with an arc corresponding to precession about an axis near the radio jet. Orientations from an angular momentum axis inclined 45∘ from the line of sight and at a position angle of 55∘ are shown as a gray oval (on the right) in Figure 3. The gray oval passes near most of the points by Neumayer et al. (2009) but is inconsistent with the orientation in the inner disk (Neumayer et al. 2007). The jet inclination angle is uncertain (see discussion by Hardcastle et al. 2003), but even if we changed the estimated jet inclination angle and so moved the center of the oval, it would not pass through all the data points interior to the circumnuclear molecular disk in Figure 3, particularly those at radii within 10 pc by Neumayer et al. (2007).
We have also plotted on Figure 3 a black spiral that has an orientation near the circumnuclear disk and approaches an orientation perpendicular to the jet axis at a radius of 1 pc. For this model, the angular distance between the angular momentum of the circumnuclear disk at 100 pc and the jet axis is 25∘. The angle between the angular momentum vector and jet axis smoothly drops to zero with a slope where is inclination and precession angle with respect to the jet axis. as the precession angle advances by 450∘. This spiral was projected assuming that jet axis is from the line of sight. This model passes near data points at radii interior to 10 pc, suggesting that simultaneous precession and damping to a plane perpendicular to the jet axis may be occurring in the disk at radii interior to 100 pc.
The gravitational field of the black hole dominates that from the stellar component within a radius known as the sphere of influence, . For a black hole mass of and velocity dispersion of about 150 km/s (Cappellari et al. 2009) this radius is about pc, consequently the innermost data points by Neumayer et al. (2007) lie within the massive black hole’s sphere of influence. For comparison, the gravitational radius of the black hole at the nucleus is pc. Relativistic frame dragging near for a spinning black hole leads to precession known as Lense-Thirring precession and warping of a disk that is initially misaligned with the black hole spin axis. This is called the Bardeen-Petterson effect. Due to viscous processes, the disk could settle into the plane perpendicular to the black hole’s spin axis as it accretes. The transition or Bardeen-Petterson radius is estimated to be of order (Caproni et al. 2007) corresponding to 0.1 pc for Centaurus A. This is well within that resolved by Neumayer et al. (2007). A similar situation exists for NGC 4258 with only the inner radius of the resolved warped disk near the estimated Bardeen-Petterson radius (Caproni et al. 2007). The discrepancy between the estimated Bardeen-Petterson radius and the observed location of the warp might be resolved if there is a smooth transition between the outer disk and the Bardeen-Petterson radius, as exhibited by simulations of diffusive disks (e.g., Lodato & Pringle 2006). The warped disk of NGC 4258 has been interpreted in terms of the Bardeen-Petterson effect even though the warped disk itself lies outside the estimated Bardeen-Petterson radius (Caproni et al. 2007). The rough correspondence between the black spiral and data points in the inner disk in Figure 3 suggest that a similar model might be applied to Centaurus A’s disk within a radius of 10 pc. Such a model would be a better fit for a jet axis near 40∘ from the light of sight, consistent with the range estimated by Hardcastle et al. (2003), but 10∘ lower than estimated from VLBI observations (Tingay et al. 1998).
Outside the sphere of influence of the black hole, , disk settling or warp diffusion timescales exceed the accretion timescale (Steiman-Cameron & Durisen 1988). However inside the black hole’s sphere of influence the rotation is nearly Keplerian. The warp diffusion timescale is significantly shorter for Keplerian disks than for galactic disks (Papaloizou & Pringle 1983). The warp diffusion timescale for a Keplerian disk , (Papaloizou & Pringle 1983) where is the disk aspect ratio and is the unitless parameter used to characterize the disk viscosity. The Bardeen-Peterson radius (at which a disk would settle to the midplane defined by the black hole spin axis) is estimated by equating to the inverse of the Lense-Thirring precession rate. The ratio of the Lense-Thirring precession rate to the angular rotation rate is at most at 1 pc from the black hole. The expression for illustrates that the Bardeen-Petterson radius could only be located near 1 pc if the disk is extremely thin and viscous, so much so that it is uncomfortable to apply such a model to the inner region of Cen A’s disk. One could consider the possibility that the disk does settle to a plane perpendicular to the jet axis and it does so near and within where the warp diffusion timescale is shorter than exterior to this radius. If this is the case then there are other torques acting on the disk that depend on orientation angle, for example due to radiation pressure or pressure gradients that cause precession faster than Lense-Thirring precession near .
A model with a smoothly changing orientation angle that decays to an axis perpendicular to the jet would not explain the orientations at radii between 100 and 600 pc, where there may be a gap in the gas distribution. Neither would a Bardeen-Petterson effect model account for the cusps or changes in orientation at a radius of 100 pc and at 600 pc. One possibility is that a triaxial bulge induces non-circular motions in this region complicating the measurement of orientations (Espada et al. 2009). Another possibility is that bursts of star formation or nuclear activity have blown out material from this region (e.g., Quillen et al. 2006a). In this case, the kinks in the orientation direction may be related to past episodes of activity. This last possibility suggests that future work could explore a relation between orientation and episodic nuclear activity even at radii interior to 100 pc. Orientation changes related to epochs of nuclear activity would be predicted if either radiative or wind driven warp instabilities operate or if there are variable gradients in the ambient medium associated with jet propagation.
3 Discussion
Surprisingly a comparison of the tilted ring fits shows at least three kinks in the orientation angles as a function of radius on a polar plot. The first (at a radius about 1.3 kpc or 70′′) was previously known (Quillen et al. 1993) and could correspond to a variation in precession rate caused by self-gravity of the disk. The outer disk forms an arc on a polar plot of ring orientation angles implying that precession following a merger, as proposed by Tubbs (1980), is a good explanation for the disk morphology.
Between the hole in the dust distribution at a radius of about 30′′ (or 600 pc) and the circumnuclear molecular disk there is also an abrupt change in angle. There is another change in orientation at a radius of about 100 pc (or 6′′). Precession about the jet axis could match the orientations between 100 and 20 pc, but would not match the orientations interior to this. A model with disk angular momentum axis approaching the jet axis with decreasing radius could be promising. Models of the Bardeen-Petterson effect that are used to interpret NGC 4258’s disk might under extreme conditions be applied to Centaurus A even though the resolved region (outside 1.8 pc) lies outside the estimated Bardeen-Petterson radius. However, the two inner cusps or changes in the disk orientation would not be predicted by a Bardeen-Petterson type of model. Future work could explore models relating disk orientation to past episodes of nuclear activity.
Acknowledgments
We thank Joss Bland-Hawthorn, Aneta Siemiginowska, Richard Nelson and Gordon Ogilvie for helpful discussions. DE is supported by a Marie Curie International Fellowship (MOIF-CT-2006-40298) granted by the European Commission. NN is supported by the DFG cluster of excellence ‘Origin and Structure of the Universe.’ Support for this work was in part provided by by NASA through an award issued by JPL/Caltech, and HST-AR-10972 to the Space Telescope Science Institute. ACQ thanks the Newton Institute for support and hospitality during the fall of 2009.
References
- Bland (1986) Bland, J. 1986, Ph.D. thesis, Univ. Sussex
- Bland et al. (1987) Bland, J., Taylor, K., & Atherton, P. D. 1987, MNRAS, 228, 595
- Burns et al. (1983) Burns, J. O., Feigelson, E. D., & Schreier, E. J. 1983, ApJ, 273, 128
- Cappellari et al. (2009) Cappellari, M., Neumayer, N., Reunanen, J., van der Werf, P. P., de Zeeuw, P. T., & Rix, H.-W. 2009, MNRAS, 394, 660
- Caproni et al. (2007) Caproni, A., Abraham, Z., Livio, M. & Mosquera Cuesta, H. J. 2007, MNRAS, 379, 135
- Espada et al. (2009) Espada, D., Matsushita, S., Peck, A., Henkel, C., Iono, D., Israel, F. P., Muller, S., Petitpas, G., Pihlstrom, Y., Taylor, G. B., & Dinh-V-Trung 2009, ApJ, 695, 116
- Hardcastle et al. (2003) Hardcastle, M. J., Worrall, D. M., Kraft, R. P., Forman, W. R., Jones, C., & Murray S. S. 2003, ApJ, 593, 169
- Harris et al. (2009) Harris, G., Rejkuba, M., & Harris, B. 2009, this proceedings and on the distance to Cen A of 3.8 Mpc
- Kraft et al. (2000) Kraft, R. P., et al. 2000, ApJ, 531, L9
- Lodato & Pringle (2006) Lodato, G., & Pringle, J. E. 2006, MNRAS, 368, 1196
- Maloney et al. (1996) Maloney, P.R., Begelman, M.C. & Pringle, J.E. 1996 ApJ, 472, 582
- Neumayer et al. (2007) Neumayer, N., Cappellari, M., Reunanen, J., Rix, H.-W., van der Werf, P. P., de Zeeuw, P. T., & R. I. Davies 2007, ApJ, 671, 1329
- Neumayer et al. (2009) Neumayer, N., Cappellari, M., Reunanen, J., Rix, H.-W., van der Werf, P. P., de Zeeuw, P. T., & R. I. Davies 2009, in preparation
- Nicholson et al. (1992) Nicholson, R. A., Bland-Hawthorn, J., & Taylor, K. 1992, ApJ, 387, 503
- Oosterloo et al. (2009) Oosterloo, T., Struve, C and Morganti R. 2009, in preparation
- Papaloizou & Pringle (1983) Papaloizou, J. C. B. & Pringle, J. E. 1983, MNRAS, 202, 1181
- Pringle (1996) Pringle, J. E. 1996, MNRAS 281, 357
- Quillen & Bower (1999) Quillen, A. C., & Bower, G. A. 1999, ApJ, 522, 718
- Quillen et al. (1992) Quillen, A. C., de Zeeuw, P. T., Phinney, E. S., & Phillips, T. G. 1992, ApJ, 391, 121
- Quillen et al. (1993) Quillen, A. C,, Graham, J. R., & Frogel, J. A. 1993, ApJ, 412, 550
- Quillen (2001) Quillen, A. C. 2001, ApJ, 563, 313
- Quillen et al. (2006b) Quillen, A., Brookes, M. H., Keene, J., Stern, D., Lawrence, C. R., & Werner, M. W., 2006, ApJ, 645, 1092
- Quillen et al. (2006a) Quillen, A. C., Bland-Hawthorn, J., Brookes, M. H., Werner, M. W., Smith, J. D., Stern, D., Keene, J., & Lawrence, C. R. 2006, ApJ, 641, L29
- Sparke (1996) Sparke, L. S. 1996, ApJ, 473, 810
- Steiman-Cameron & Durisen (1988) Steiman-Cameron, T. Y., & Durisen, R. H. 1988, ApJ, 325, 26
- Tingay et al. (1998) Tingay, S. J. et al. 1998, AJ, 115, 960
- Tubbs (1980) Tubbs, A. D. 1980, ApJ, 241, 969
| Inc | PA | Inc | PA | Inc | PA | |||
| (′′) | (deg) | (deg) | (′′) | (deg) | (deg) | (′′) | (deg) | (deg) |
| NEU07a | NEU09b | ESP09c | ||||||
| 0.05 | 45.0 | 144.0 | 0.26 | 31.0 | 175.3 | 9 | 71 | 151 |
| 0.10 | 37.6 | 148.5 | 0.40 | 47.1 | 171.0 | 12 | 69 | 150 |
| 0.16 | 38.8 | 152.1 | 0.54 | 30.2 | 168.3 | 15 | 71 | 148 |
| 0.22 | 42.2 | 154.8 | 0.68 | 25.8 | 163.4 | 18 | 74 | 145 |
| 0.27 | 44.5 | 160.5 | 0.83 | 27.4 | 158.9 | 21 | 76 | 140 |
| 0.33 | 42.3 | 165.4 | 0.97 | 25.8 | 155.5 | 24 | 77 | 133 |
| 0.39 | 44.1 | 167.8 | 1.12 | 28.5 | 152.2 | 27 | 77 | 125 |
| 0.45 | 45.7 | 168.5 | 1.27 | 34.7 | 150.2 | 30 | 77 | 117 |
| 0.51 | 44.0 | 168.9 | 1.42 | 25.8 | 147.6 | 33 | 77 | 108 |
| 0.57 | 39.5 | 169.0 | 1.57 | 25.8 | 144.0 | 36 | 77 | 101 |
| 0.63 | 36.1 | 167.2 | 1.73 | 25.8 | 140.3 | 39 | 78 | 95 |
| 0.69 | 35.1 | 165.2 | 1.90 | 25.8 | 135.7 | 42 | 80 | 92 |
| 0.76 | 34.2 | 163.5 | 2.06 | 29.6 | 133.7 | 45 | 82 | 92 |
| 0.82 | 35.2 | 161.7 | 2.22 | 27.6 | 126.0 | 48 | 85 | 94 |
| 0.89 | 36.9 | 159.8 | 2.40 | 37.5 | 125.8 | 51 | 84 | 97 |
| 0.96 | 36.8 | 157.0 | 2.57 | 25.8 | 123.5 | 54 | 82 | 102 |
| 1.03 | 36.2 | 153.8 | 2.75 | 29.6 | 121.1 | 57 | 82 | 107 |
| 1.10 | 36.8 | 151.1 | 2.94 | 34.8 | 121.8 | 60 | 82 | 111 |
| 1.18 | 39.7 | 149.3 | 3.14 | 27.8 | 123.8 | 63 | 83 | 115 |
| 1.26 | 42.5 | 147.8 | 3.34 | 41.1 | 121.4 | 66 | 84 | 118 |
| 1.34 | 46.7 | 146.8 | 3.55 | 37.0 | 122.5 | 69 | 85 | 121 |
| 1.42 | 48.9 | 145.1 | 3.77 | 44.5 | 126.2 | 72 | 88 | 124 |
| 1.51 | 51.6 | 144.0 | 3.99 | 49.8 | 124.8 | 75 | 90 | 127 |
| 1.60 | 53.6 | 142.8 | 4.23 | 53.1 | 126.0 | 78 | 93 | 128 |
| 1.69 | 55.6 | 141.6 | 4.48 | 53.3 | 132.8 | 81 | 96 | 130 |
| 1.79 | 54.6 | 137.9 | 4.74 | 65.3 | 134.1 | 84 | 100 | 131 |
| 1.90 | 58.9 | 134.9 | ||||||
| QUI06d | QUI06d | OST09e | ||||||
| 40 | 89.7 | 92 | 105 | 118.3 | 126 | 60 | 85.0 | 103.0 |
| 45 | 86.3 | 96 | 110 | 118.5 | 125 | 75 | 82.8 | 115.0 |
| 50 | 83.7 | 102 | 115 | 117.9 | 125 | 95 | 93.0 | 124.0 |
| 55 | 82.5 | 108 | 120 | 116.7 | 125 | 105 | 97.3 | 127.0 |
| 60 | 82.9 | 114 | 125 | 114.9 | 126 | 120 | 100.0 | 128.0 |
| 65 | 84.9 | 119 | 130 | 112.7 | 127 | 135 | 103.7 | 128.0 |
| 70 | 88.4 | 124 | 135 | 110.2 | 127 | 150 | 105.7 | 128.0 |
| 75 | 93.0 | 128 | 140 | 107.6 | 127 | 165 | 105.5 | 126.9 |
| 80 | 98.7 | 131 | 145 | 105.0 | 127 | 180 | 99.6 | 125.0 |
| 85 | 104.8 | 132 | 150 | 102.6 | 126 | 195 | 94.2 | 117.4 |
| 90 | 110.3 | 131 | 245 | 90.0 | 110.3 | |||
| 95 | 114.5 | 129 | 295 | 90.0 | 105.0 | |||
| 100 | 117.1 | 127 | 345 | 90.0 | 102.0 | |||
aAngles are from Table 1 by Neumayer et al. (2007).
bPreliminary fits by Neumayer et al. (2009).
cAngles are from Figure 8a by Espada et al. (2009).
dAngles are from Figure 7 by Quillen et al. (2006b).
ePreliminary fits by Oosterloo et al. (2009).