Scaling behavior of explosive percolation on the square lattice
Abstract
Clusters generated by the product-rule growth model of Achlioptas, D’Souza, and Spencer on a two-dimensional square lattice are shown to obey qualitatively different scaling behavior than standard (random growth) percolation. The threshold with unrestricted bond placement (allowing loops) is found precisely using several different criteria based upon both moments and wrapping probabilities, yielding , consistent with the recent result of Radicchi and Fortunato. The correlation-length exponent is found to be close to 1. The qualitative difference from regular percolation is shown dramatically in the behavior of the percolation probability (size of largest cluster), the susceptibility, and of the second moment of finite clusters, where discontinuities appears at the threshold. The critical cluster-size distribution does not follow a consistent power-law for the range of system sizes we study () but may approach a power-law with for larger .
pacs:
64.60.ah, 64.60.De, 05.50.+q
I Introduction
Recently, there has been a great deal of interest in a model of “explosive growth” of percolation clusters by the so-called Achlioptas process AchlioptasDSouzaSpencer09 , in which two randomly chosen unoccupied bonds in a system are examined, and the bond that minimizes the product of the size of the two clusters to which it is attached becomes the next one to occupied. This procedure, called the product rule (PR) AchlioptasDSouzaSpencer09 , was originally studied on Erdős-Rényi random graphs AchlioptasDSouzaSpencer09 , then on two-dimensional square lattices Ziff09 and scale-free networks RadicchiFortunato09 ; ChoKimParkKahngKim09 . Other recent papers on explosive and biased percolation include FriedmanLandsberg09 ; RozenfeldGallosMakse09 ; ChoKahngKim10 ; MoreiraOliveiraReisHerrmannAndrade09 ; MannaChatterjee09 ; HooyberghsEtAl10 ; DSouzaMitzenmacher10 ; ChoKimNohKahngKim10 ; AldousOngZhou10 ; RadicchiFortunato10 ; AraujoHerrmann10 ; BasuBasuKunduMohanty10 . Interest in this process derives from its unusual explosive behavior, suggesting a first-order transition, with apparent discontinuities in several quantities. Many of its properties have yet to be discovered.
In this paper we examine in more detail the PR model on the regular square lattice, especially in regards to how it differs from random growth (RG), in which bonds are added one at a time, and which corresponds to standard percolation.
Some preliminary results were given in Ziff09 , where the width of the distribution was investigated. As in AchlioptasDSouzaSpencer09 , was defined as the difference in times in which the maximum cluster size goes from to , where is the number of sites. (Here time is identical to the number of bonds added.) For the Erdős-Rényi graph, the authors of AchlioptasDSouzaSpencer09 found that as for the PR model, while const. for the RG model, showing that the two transitions are qualitatively different. In Ziff09 it was found that for the square lattice, on the other hand, for both the PR and RG models, but with different powers in . It however turns out that if a larger (and in the case of the square boundary, more appropriate) criterion for the upper end of the gap were used, say , then indeed one would find that const. as for the RG model and still to zero for the PR model. So with this criterion, the two models are qualitatively different on the square lattice just as for the Erdős-Rényi graph. (Even with a criterion of , one should have const. for the RG model on the square lattice, but one would have to go to a very large system to see it.)
Recently, Radicchi and Fortunato have also studied both the PR and RG models on the square lattice, and analyzed their behavior in the context of standard two-parameter scaling RadicchiFortunato10 . However, as they mention, it is unclear in what sense this scaling can be applied to the PR problem, considering that several of the quantities show discontinuities. In this paper, we consider the behavior of wrapping probabilities as well as quantities related to the size distribution such as moments. The former refers to having a cluster that connects around the toroidal boundaries of the periodic system (the torus), and is the analog of crossing probabilities for open systems. In order to study scaling behavior precisely, it is also necessary to know the transition point precisely, and we determine it here using a variety of methods. While the convergence of various estimates in ordinary percolation is well-known StaufferAharony94 ; ZiffNewman02 , that is not the case for the PR model, so the convergence behavior is also studied.
II Procedure
Actually, there is a subtle but significant difference in the treatment of the PR process considered previously by the present author Ziff09 and that by Radicchi and Fortunato RadicchiFortunato10 . In Ziff09 , it was assumed that bonds could only be added between different clusters. This assumption bypassed the question of how to assign weights when a bond connects sites that are part of the same cluster, and for the RG model corresponds to “loop-less” percolation previously considered by Manna and Subramanian MannaSubramanian96 . On the other hand, in RadicchiFortunato10 the authors considered that bonds can be placed anywhere, including within the same cluster. Thus, there is a difference in the scaling of the time, but also a difference in the weights with which new bonds are added, so these two processes are not equivalent.
In this paper, we follow the unrestricted bond placement convention used by Radicchi and Fortunato in RadicchiFortunato10 . When an internal bond is selected, we use for its weight the square of the size of the cluster it is part of. We characterize the size of a cluster (or component) by the number of sites it contains.
To carry out these simulations, we used the algorithm of Newman and Ziff NewmanZiff00 ; NewmanZiff01 in which clusters are represented as a tree and a union-find algorithm (modified for the PR) is used to join clusters together. A randomly ordered list of all bonds is made initially, and bonds are taken off that list in pairs. The bond that is not selected according to the PR is put back on the list randomly by switching with a randomly chosen member remaining on the list. We also considered the less efficient procedure of not using a bond list but just randomly selecting bonds on the lattice, skipping over those that were already chosen until two free ones were found. Both methods led to identical results.
To determine cluster wrapping, we assigned extra variables “xcoor” and “ycoor” to each lattice site. These quantities are the and coordinates of that site with respect to the first site of the cluster, without adjusting for the periodic boundary conditions. Wrapping is then indicated when an intra-cluster bond leads to a difference in a coordinate by a multiple of the lattice width or height MachtaChoiLuckeSchweizerChayes96 .
The algorithm of NewmanZiff00 allows one to find the various quantities for all values of in one simulation. We did not carry out the convolution step with a binomial distribution to get the grand canonical (fixed probability) rather than canonical (fixed number) results, as the differences between the two ensembles for the systems we studied are small. We everywhere consider square lattices and square boundaries, with sites and periodic b.c. Many runs were made to get good statistics, ranging from runs for to runs for . In general, the number of runs was sufficient so that the errors are smaller than the symbols or width of the lines or symbols we used to plot the results. We also considered runs for for measuring the size distribution.
III Results
The results of this work are shown in a series of pairs of figures, with results for the RG model placed on the left-hand side, and those for the PR model placed on the right-hand side.
III.1 The maximum cluster size
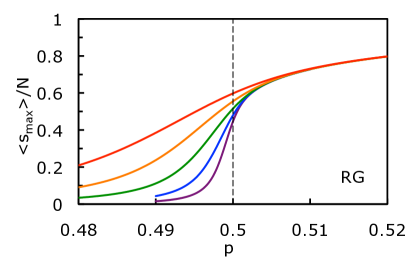
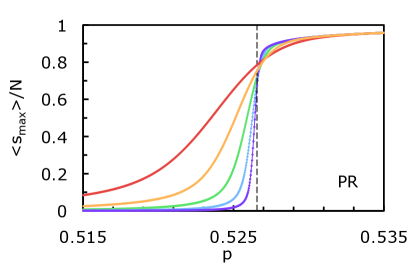
In Fig. 1 we show the average of the maximum cluster size scaled by the number of sites, , as a function of , for the different system sizes. This quantity can also be identified with the usual order parameter, the percolation probability , if one considers that the largest cluster is effectively the “infinite” one. The PR model (right panel) clearly shows qualitatively different behavior than the RG model, with crossing curves in the PR case.
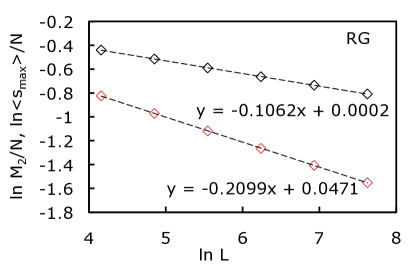
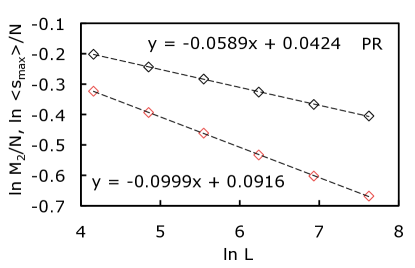
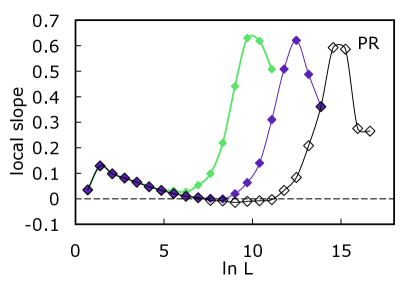
The behavior of at is shown in Fig. 2, using for the RG case and (determined below) for the PR case. For the RG case, the slope () agrees within errors with the scaling predictions of . The points for the PR model are also fit well by a straight line on the ln-ln plot, suggesting scaling for this quantity, with slope , which is clearly different from the RG model. Based upon the variation with size, we estimate the error to this result to be . This value of is consistent with the value (within the error bars ) reported in RadicchiFortunato10 .
III.2 Moments and susceptibility
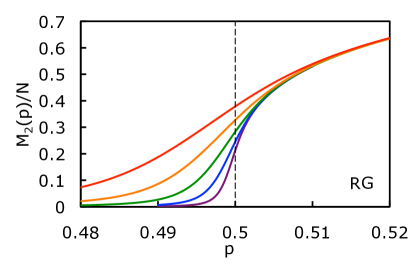
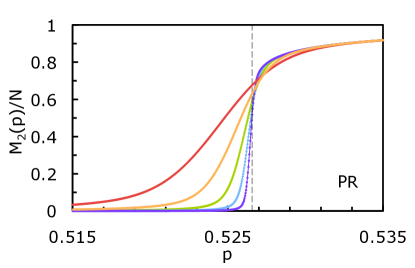
Fig. 3 shows the behavior of the second moment , where is the mass of the -th particle, scaled by . Again, the PR model shows curve-crossing with a possible accumulation or crossing point. The scaling behavior at is shown in Fig. 2. The slope for the RG model is consistent with the prediction . The PR data also appears to obey power-law behavior, with a slope implying , with an estimated error of 0.01. This is somewhat higher than the value reported in RadicchiFortunato10 .
By scaling and hyperscaling in 2d, one would expect that the slopes of the two curves in Fig. 2 should differ by a factor of two: . This is seen to hold well for the RG data, but not so well for the PR case. Further analysis of the data shows that the value seems to be independent of , but appears to be increasing as increases, and may possibly approach the value (as ) implied by this scaling. However, studies on larger systems are needed to confirm this.
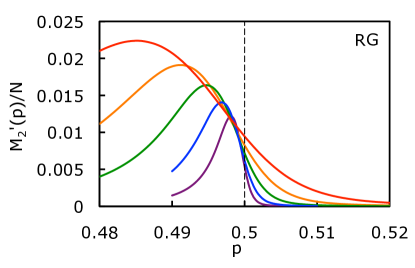
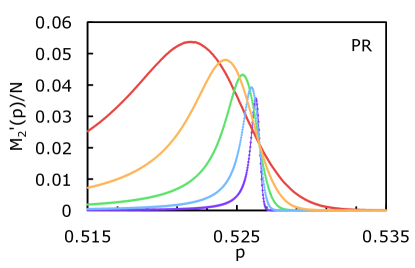
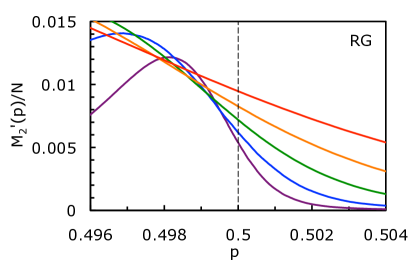
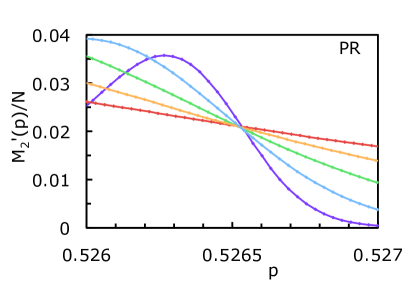
In Fig. 4 we show the behavior of the scaled second moment minus the largest cluster, that is:
| (1) |
According to scaling arguments, this function should go through a maximum at a value where the is a certain constant, at which point, should scale as . We verified that the peaks for RG in Fig. 4 obey this behavior with standard exponents (not shown). However, for the PR model, the curves of very closely pivot around the crossing point at , which is also close to the inflection points of the curves. This suggests that as , is non-zero, which would imply that , in conflict with what we found () from the behavior of . This behavior is another indication of the unusual nature of the PR transition.
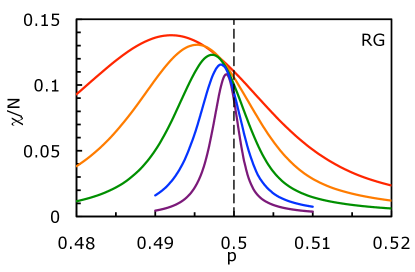
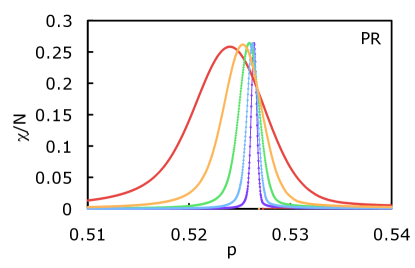
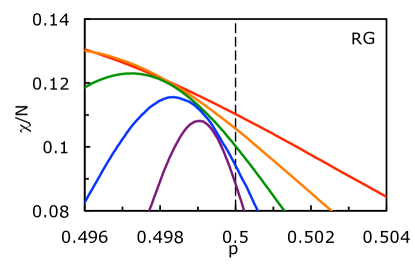
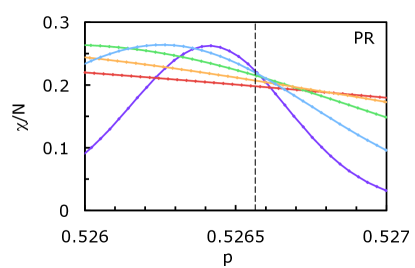
In Fig. 5 we show the behavior of the susceptibility , defined by
| (2) |
which characterizes the fluctuations in the size of the largest cluster. It can also be found from previous quantities via . The peaks of in the RG model decay to zero as , consistent with the scaling prediction . However, the peaks in the PR model apparently increase to a constant value , again consistent with . Also, the locations of at the peaks for the PR model approach as ,again implying . Below we will find that several other quantities also satisfy inverse-size scaling (Fig. 10).
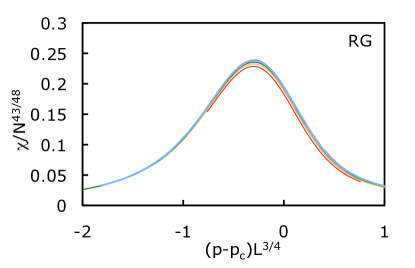
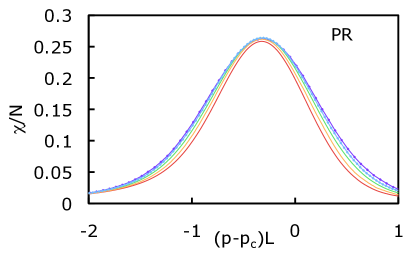
In Fig. 6, we show a scaling plot of vs. assuming , and also , and the fit is seen to be good. (Taking yields a much poorer fit.) A similar plot for the RG model, with standard percolation scaling, is shown for comparison.

III.3 Wrapping probabilities
Next we consider wrapping probabilities. For standard percolation these were studied theoretically by Pinson Pinson94 and numerically in ZiffLorenzKleban99 ; NewmanZiff01 ; OliveiraNobregaStauffer03 . This work has also been generalized to the Potts model Arguin02 ; MorinDuchesneSaintAubin09 . Even though the percolating critical cluster is a fractal and of zero density in the continuum limit, the wrapping probability remains finite and has a value that depends only upon the aspect ratio of the system and the type of wrapping homology.
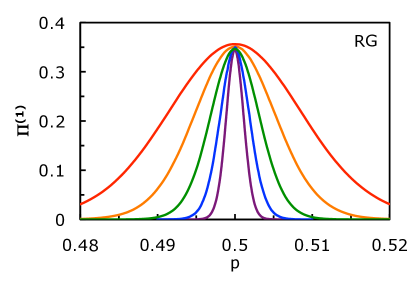
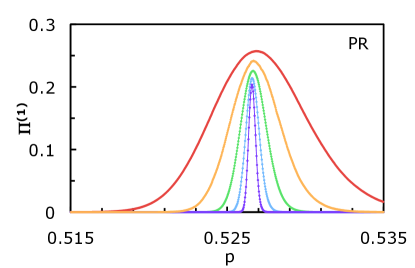
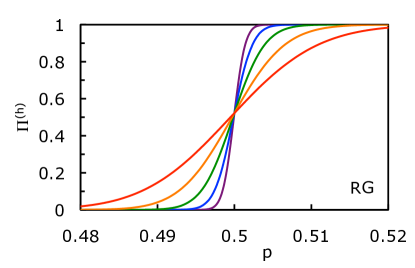
In Fig. 7, we show the (only) one-way wrapping probability , defined as the probability at least one cluster wraps horizontally but not vertically, or wraps vertically but not horizontally. For the RG model, the value of at approaches the predicted value Pinson94 ; NewmanZiff01 very rapidly. The curves are exactly symmetric, because for one-way wrapping there must also be a one-way wrapping on the dual lattice, which in the square system is identical to the original lattice but with bonds occupied with probability . For the PR model, the curves are not quite symmetric, and the value of at the peaks approaches apparently as (not shown). The value of seems to be dropping to a constant value of about as , although the range of values of we considered is not sufficient to be very certain about this behavior.
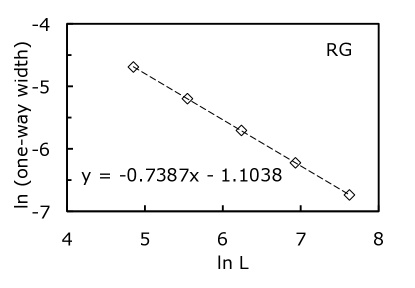
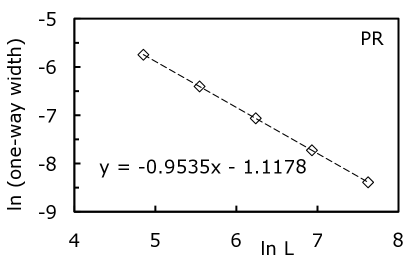
The width (standard deviation) of , as a function of , is shown in Fig. 8. For RG, the data are consistent with the theoretical prediction of a straight line with slope of . For the PR, the overall slope of the points is but decreases to for large , implying that . This is in contrast with the value seen in several other situations.
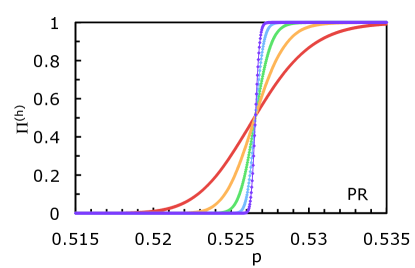
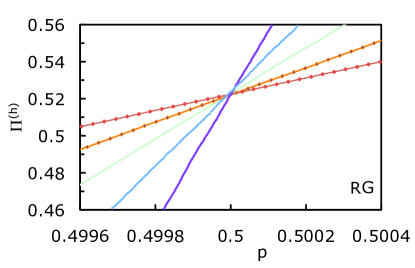
In Fig. 9 we show the probability distribution for horizontal wrapping, irrespective of whether wrapping occurs in the vertical direction. For both the RG and PR models, the curves cross at a single point, within numerical error. The crossing point of the RG model is at , , consistent with Pinson’s theoretical result Pinson94 ; NewmanZiff01 , while that for the PR model is at , . Convergence behavior of the ordinary percolation crossing point was studied in NewmanZiff01 , however for site percolation and in the grand-canonical (fixed ) rather than the canonical (fixed-) ensemble. We have not determined the convergence in this case, but the crossing point for the system sizes we considered clearly gives a very precise indication of .
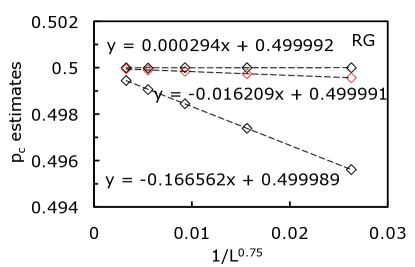
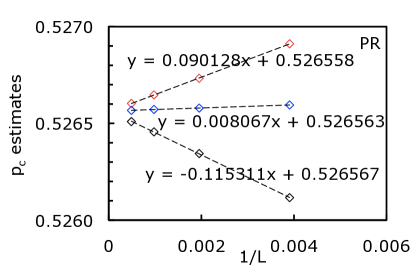
The estimates for that come from various measures are summarized in Fig. 10, plotted as a function of (RG) and (PR). The upper curves show the average of at which one-way wrapping occurs — that is, the mean of the distribution shown in Fig. 7, . The middle curves show the average value of at which horizontal wrapping first occurs; for the PR case, this is nearly horizontal, so this quantity is very good for estimating precisely. The lower curves show the average value of at which either horizontal or vertical crossing first occurs. For the RG model, all estimates extrapolate to a value very close to the expected value , and for the PR model the extrapolations are consistent with .
Note that here, we find a better fit to the data assuming rather than found in the scaling of the one-way width, Fig. 8. However, if we use the latter value, we don’t find a significant change in the estimated value of .
III.4 Size distribution
Finally, we consider the behavior of the cluster size distribution at criticality. We ran simulations on systems of size , , and for both the RG and PR models, and measured , the number of clusters of size , at the critical points . We binned the weighted data as for , thus accumulating the number of occupied sites belonging to clusters in each size range. That is, when growing a cluster of size , we incremented the bin (int) by . (This gives better statistics than the usual method of incrementing the bin by , which corresponds to just counting the number of clusters in each size bin.) For a given run, where , because, in the end, all sites are wetted. For RG, one expects , so is a slowly decreasing function of , until approaches the size of the system, at which point the “infinite” clusters contribute.
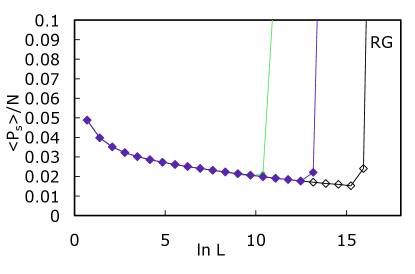
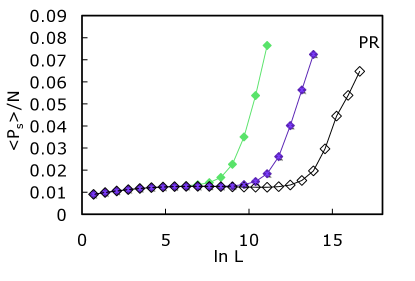
In Fig. 11 we plot the average of the normalized distribution, , as a function of , for different . For the RG case, the data show expected decrease with , except for a large accumulation in the last two bins because of the finite size effects. On the other hand, for the PR case, the seem to be increasing, except possibly for a small region in the largest system, and the accumulation in the large bins occurs over a much wider range.
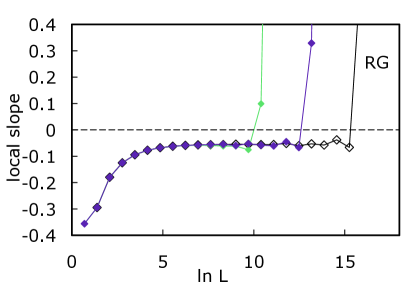
In the lower plots of Fig. 11 we show the slopes between pairs of points (taking the logarithm of first). The data of the slopes for the RG model for large is seen to be consistent with the theoretical prediction . For the PR model, for smaller and , the slopes are positive, consistent with the observation of RadicchiFortunato10 who found . Of course, for a normalizable size distribution, it is necessary that , at least asymptotically. We indeed find that the slope (barely) goes below zero (corresponding to ) for a range of for the largest system; however, it is unclear from these data whether the slope truly approaches a consistent value or whether it contains for example logarithmic terms. Simulations on larger systems should help to answer this question.
For the corrections to scaling for the critical size distribution, one expects
| (3) |
The data for RG are consistent with as found previously ZiffBabalievski99 ; AdlerMoshePrivman82 . If we fit the data of the PR model to (3), we find is negative, , and . The latter value is consistent with through the scaling relation , assuming . The hyper-scaling relation would imply that , and the scaling is also consistent with this value of . Thus, there is evidence that the size distribution becomes power-law and that scaling is satisfied for the situations in which and .
IV Conclusions
We have found the critical bond fraction for the PR model on the square lattice to high accuracy by a number of methods. The two best criteria to determine (in terms of convergence with ) are the average value of at which horizontal wrapping first occurs (Fig. 10), and the crossing point of the horizontal wrapping probability (Fig. 9). (One could just as well use vertical wrapping, or the sum of the two LanglandPouliotSaintAubin94 , as a criterion.) Combining our measurements, we conclude
| (4) |
where the error bars represent a combination of statistical error and also the variation among results based upon different criteria. This is consistent with the value 0.5266(2) given by Radicchi and Fortunato RadicchiFortunato10 .
The striking qualitative different between the explosive and regular percolation is highlighted by the non-zero limiting behaviors of (Fig. 4) and (Fig. 5). These results suggest a discontinuity at the transition point, in contrast to RG (regular percolation), where the corresponding quantities are continuous. (Note that for regular percolation on a hierarchical small-world network, however, the transition can also be discontinuous BoettcherCookZiff09 ).
The cluster size distribution of the PR model shows quite different behavior than the ER model, with possible power-law behavior for very large systems with strong finite-size effects.
The wrapping probabilities proved useful for locating the transition point and, perhaps surprisingly, behave qualitatively quite similar to the RG model. The horizontal wrapping probability shows a very well-defined crossing point, just as found for the RG case. Its value, , is quite close to (but not identical with) the value for standard percolation, Pinson94 . This result recalls the recent findings of various kinetic systems that evolve to mimic random percolation BarrosKrapivskyRedner09 ; SiciliaSarrazinArenzonBrayCugliandolo09 .
On the other hand, the value of the one-way wrapping probability, for the PR model (see Fig. 8) is quite a bit below the RG percolation value, , and it is hard to find its asymptotic value precisely. Evidently, because of the more compact geometry of the PR giant cluster, wrapping one way is more difficult than in the RG case.
Finally, for the scaling, we have found some contradictory results: , , , and the size distribution give , , and , and , implying , where number in parentheses represents our estimated errors in the last digit(s), while some of the other results (such as the behavior of and ) are more consistent with and Perhaps this is indicative that the normal two-parameter scaling does not hold for this model because of the first-order transition, or that logarithmic corrections come into play.
Note added: While this paper was in revision, a preprint appeared which argues that the explosive percolation transition in the case of the PR rule on the random graph is continuous CostaDorogovtsevGoltsevMendes10 . Those arguments however do not apply to the regular square lattice studied here.
ACKNOWLEDGMENTS
The author acknowledges support from the U. S. National Science Foundation grant number DMS-0553487, and also acknowledges useful correspondence with R. D’Souza, S. S. Manna, F. Radicchi and S. Fortunato.
References
- (1) D. Achlioptas, R. M. D’Souza, and J. Spencer, Science 323, 1453 (2009)
- (2) R. M. Ziff, Phys. Rev. Lett. 103, 045701 (2009)
- (3) F. Radicchi and S. Fortunato, Phys. Rev. Lett. 103, 168701 (2009)
- (4) Y. S. Cho, J. S. Kim, J. Park, B. Kahng, and D. Kim, Phys. Rev. Lett. 103, 135702 (2009)
- (5) E. J. Friedman and A. S. Landsberg, Phys. Rev. Lett. 103, 255701 (2009)
- (6) H. D. Rozenfeld, L. K. Gallos, and H. A. Makse, Eur. Phys. J. B 75, 305 (2010)
- (7) Y. S. Cho, B. Kahng, and D. Kim, Phys. Rev. E 81, 030103(R) (2010)
- (8) A. A. Moreira, E. A. Oliveira, S. D. S. Reis, H. J. Herrmann, and J. S. Andrade Jr, Phys. Rev. E 81, 040101(R) (2010)
- (9) S. S. Manna and A. Chatterjee, arXiv:0911.4674(2009)
- (10) H. Hooyberghs, B. Van Schaeybroeck, A. A. Moreira, J. S. Andrade, H. J. Herrmann, and J. O. Indekeu, Phys. Rev. E 81, 011102 (2010)
- (11) R. M. D’Souza and M. Mitzenmacher, Phys. Rev. Lett. 104, 195702 (2010)
- (12) Y. S. Cho, S.-W. Kim, J. D. Noh, B. Kahng, and D. Kim, arXiv:1006.2194(2010)
- (13) D. J. Aldous, J. R. Ong, and W. Zhou, J. Phys. A 43, 025001 (2010)
- (14) F. Radicchi and S. Fortunato, Phys. Rev. E 81, 036110 (2010)
- (15) N. A. M. Araújo and H. J. Herrmann, Phys. Rev. Lett. 105, 035701 (2010)
- (16) U. Basu, M. Basu, A. Kundu, and P. K. Mohanty, arXiv:1008.4293(2010)
- (17) D. Stauffer and A. Aharony, Introduction to Percolation Theory, 2nd ed. (Taylor and Francis, London, 1994)
- (18) R. M. Ziff and M. E. J. Newman, Phys. Rev. E 66, 016129 (2002)
- (19) S. S. Manna and B. Subramanian, Phys. Rev. Lett. 76, 3460 (1996)
- (20) M. E. J. Newman and R. M. Ziff, Phys. Rev. Lett. 85, 4104 (2000)
- (21) M. E. J. Newman and R. M. Ziff, Phys. Rev. E 64, 016706 (2001)
- (22) J. Machta, Y. S. Choi, A. Lucke, T. Schweizer, and L. M. Chayes, Phys. Rev. E 54, 1332 (1996)
- (23) H. T. Pinson, J. Stat. Phys. 75, 1167 (1994)
- (24) R. M. Ziff, C. D. Lorenz, and P. Kleban, Physica A 266, 17 (1999)
- (25) P. M. C. Oliveira, R. A. Nobrega, and D. Stauffer, Braz. J. Phys. 33, 616 (2003)
- (26) L.-P. Arguin, J. Stat. Phys. 109, 301 (2002)
- (27) A. Morin-Duchesne and Y. Saint-Aubin, Phys. Rev. E 80, 021130 (2009)
- (28) R. M. Ziff and F. Babalievski, Physica A 269, 201 (1999)
- (29) J. Adler, M. Moshe, and V. Privman, Phys. Rev. B 26, 1411 (1982)
- (30) R. Langlands, P. Pouliot, and Y. Saint-Aubin, Bull. Am. Math. Soc. 30, 1 (1994)
- (31) S. Boettcher, J. L. Cook, and R. M. Ziff, Phys. Rev. E 80, 041115 (2009)
- (32) K. Barros, P. L. Krapivsky, and S. Redner, Phys. Rev. E 80, 040101 (2009)
- (33) A. Sicilia, Y. Sarrazin, J. J. Arenzon, A. J. Bray, and L. F. Cugliandolo, Phys. Rev. E 80, 031121 (2009)
- (34) R. A. da Costa, S. N. Dorogovtsev, A. V. Goltsev, and J. F. F. Mendes, arXiv:1009.2534(2010)